


TL:DR
Swydo is a marketing reporting tool designed to help lean teams create and deliver cross-channel ad reports.
Who it’s best for:
Small marketing teams primarily focused on paid media reporting (Google, Meta, LinkedIn Ads) that need fast setup and PDF-based delivery, and are comfortable with limitations in data blending, branding, and advanced features.
Key features at a glance:
| Feature | Swydo |
| Integrations | 37 native integrations |
| Stable connections? | Hit-or-miss with data accuracy and stability; users report incomplete or unreliable data pulls. |
| Ease of use | Basic drag-and-drop and template linking within a rigid grid layout; editing mostly via nested menus; a learning curve exists. |
| Data blending | Limited merging from up to five ad platforms into a single widget, but no custom calculated metrics or blending across non-ad platforms. |
| Internal dashboards | Client-specific monitoring boards with KPI widgets; no global dashboard for cross-client performance. |
| Customizable reports | Decent control over branding (colors, fonts, white-labeling), but rigid structure and limited layout customization; no embedding third-party content. |
| Report sharing & automation | Recurring scheduled deliveries (PDF, inline PDF, dashboard link) with timezone matching and failure handling; ad-hoc sending is manual; unique shareable links for live dashboards. |
| Security | Uses third-party hosting and real-time API calls, data is not stored or shared; limited security documentation (no mention of SOC 2, ISO, GDPR details, etc.). |
Pros ✅
- Offers pre-built templates for quick setup.
- Provides decent control over report branding and styling.
- Features like Client Monitoring Overview and Data Source Health Check Alerts are helpful.
- Generally good feedback on customer support (responsive live chat/email).
Cons ❌
- Pricing can be confusing and costly due to per-data-source billing (each account/sub-source counts).
- Some key metrics are missing or don't match source data.
- Limited custom integrations and no built-in no-code API connector, CSV upload tool, or direct data warehouse support.
- Rigid template linking that makes structural edits difficult without unlinking permanently.
- No AI features or dedicated Customer Success Manager.
Why You Can Trust This Review
At Whatagraph, we live and breathe marketing data every day, and we genuinely care about finding you a marketing reporting tool that will make your life easier—not harder.
Swydo doesn’t offer a free trial unless you book a sales call. That makes real-world testing harder for a review like this.
So here’s what I did instead:
- Scoured user forums: Like Reddit, Quora, X, YouTube, and Instagram to see what actual users are saying.
- Read 100+ reviews: From trusted platforms like G2, Capterra, GetApp, Google, and TrustRadius.
- Dug into Swydo’s help center: Straight from the horse’s mouth—pricing documentation, how-to videos, and feature pages to get a clear sense of what’s supported (and what’s not).
Our goal is to help you make an informed decision, whether that leads you to Swydo, to Whatagraph, or to another solution entirely.
Swydo Pricing
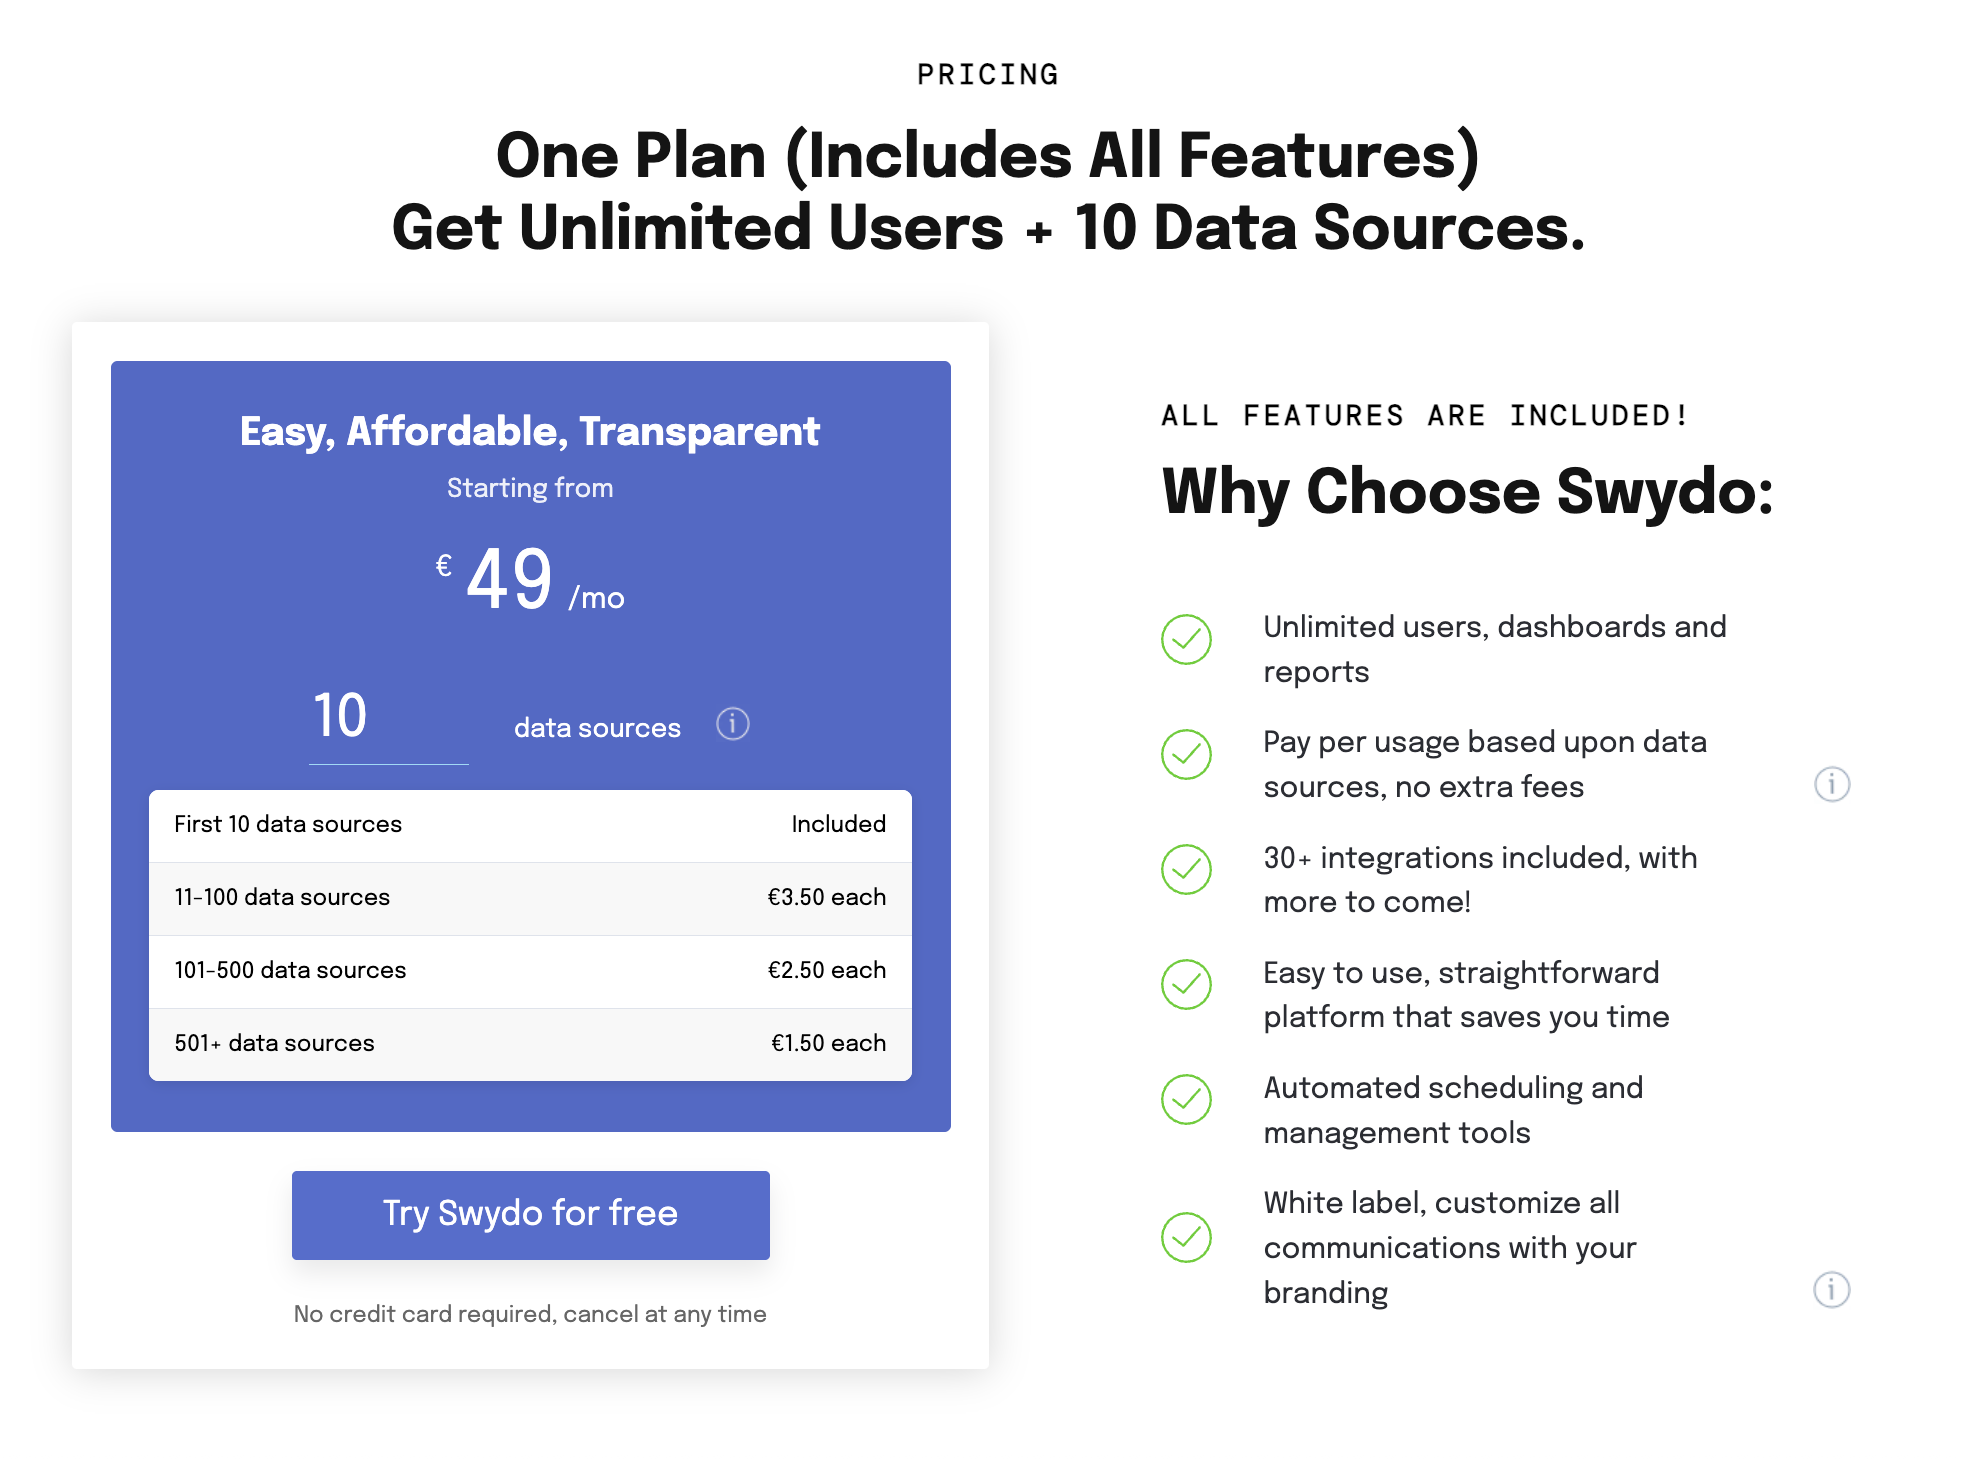
Swydo uses a one-plan-fits-all model: €49/month gets you all features, unlimited users, and 10 data sources included.
Beyond that, it’s pay-as-you-grow:
Data Sources | Cost per Source |
| 11-100 | €3.50 each |
| 101-500 | €2.50 each |
| 501+ | €1.50 each |
They even include a cost calculator—for example, 600 data sources would run you $1,514/month.
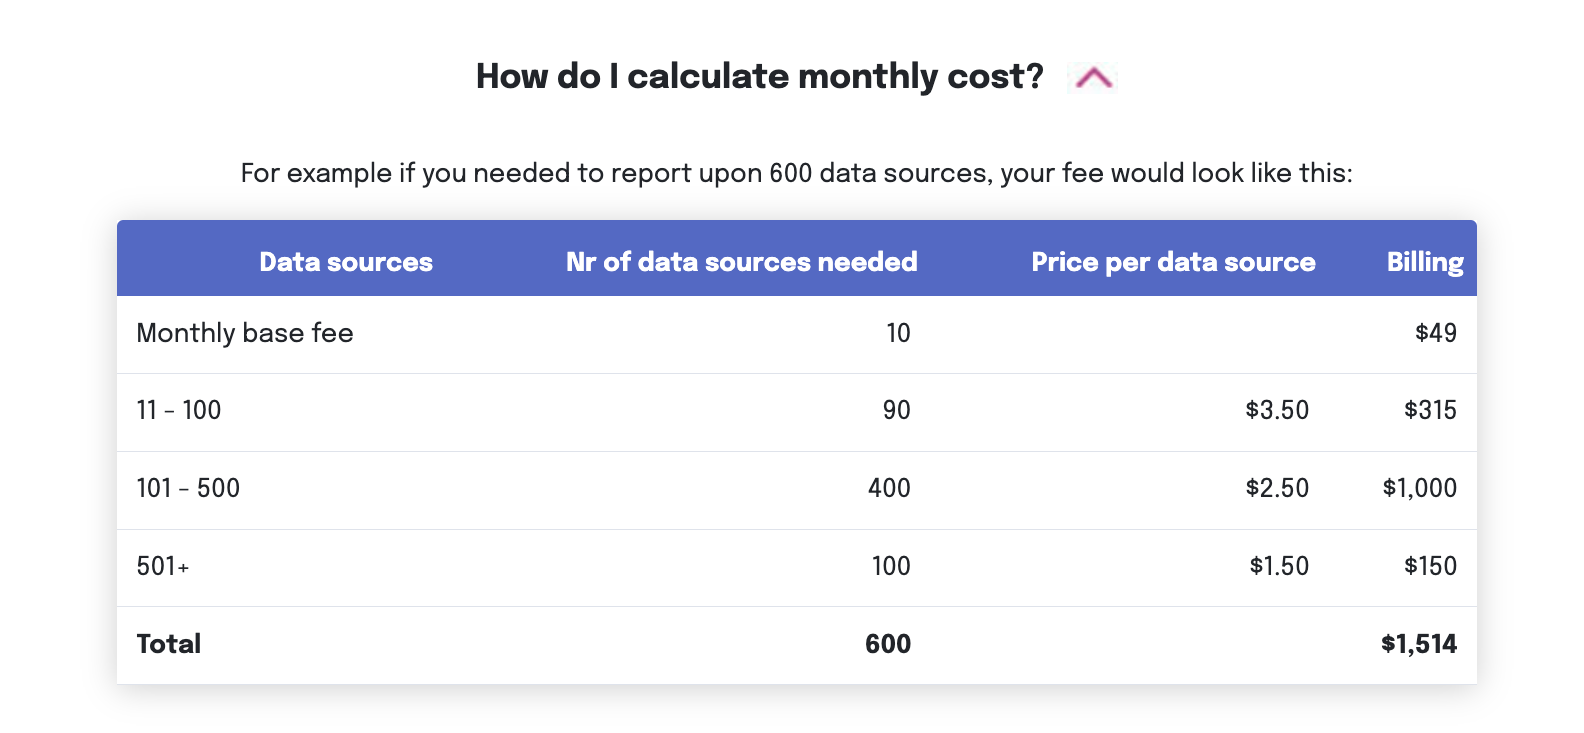
That’s helpful transparency, especially for growing agencies managing dozens (or hundreds) of accounts.
Heads up: The fees do NOT include VAT.
When I saw the bright blue button that said “Try Swydo for free,” I clicked. Of course I clicked.
But there’s no actual free trial.
Instead, you’re prompted to enter your email address and country of origin—fair enough if that led to instant access. But it doesn’t. What happens next is a prompt to schedule a sales consultation.
So while I respect the pricing model itself (flat base rate + pay-as-you-scale for data sources, no seat-based fees), I wish the language around access was clearer. Because in this case, they got my data, but I didn’t get the trial I was promised.
What does Swydo’s pricing mean for your budget?
On the surface, you only pay more if you’re syncing more data. That’s fair. But I spotted at least three reviews in 2025 on G2 alone that take issue with their pricing plan. Here’s one recent review:
“Billing per data source can get pricey depending on how many clients you have + services offered.”
This means:
- You’ll need to monitor usage closely: If your team adds new data sources without tracking the cost impact, your bill can balloon fast.
- Agencies with lots of clients or cross-channel services will feel the pinch: There’s no bundling across PPC platforms, so each connector adds up.
- The pricing model is clear, but not necessarily easy: You have to actively manage it to avoid overspending. And also factor in VAT…
Real User Reviews: What are Customers Saying About Swydo?
Swydo feedback in this section is taken from trusted review sites like G2, Capterra, and Google Reviews, along with Swydo reviews complaints from social platforms like Reddit, YouTube, and X.
The latter might be a little less polished, but that’s where the real stuff bubbles up: the bugs, the billing surprises, the little customer support blocks that don’t show up in product demos.
| Overall Swydo Google ratings | 4.0/5 ⭐ |
| Overall G2 Swydo Rating | 4.6/5 ⭐️ |
| Overall Capterra Swydo Rating | 4.5/5 ⭐️ |
Swydo pros: What real users love
✅ Saves time on cross-channel reporting
Swydo streamlines data pulling and formatting for common ad channels, which is a big win for small teams juggling high-volume clients.
Cedric D., a Digital Marketing Consultant, says:
What I appreciate most is how much time it saves us every month - especially when working across multiple platforms like Google Ads, GA4.
✅ New features improve portfolio visibility and issue tracking
Swydo has been rolling out meaningful product updates.
Robert L. shares in a recent G2 review:
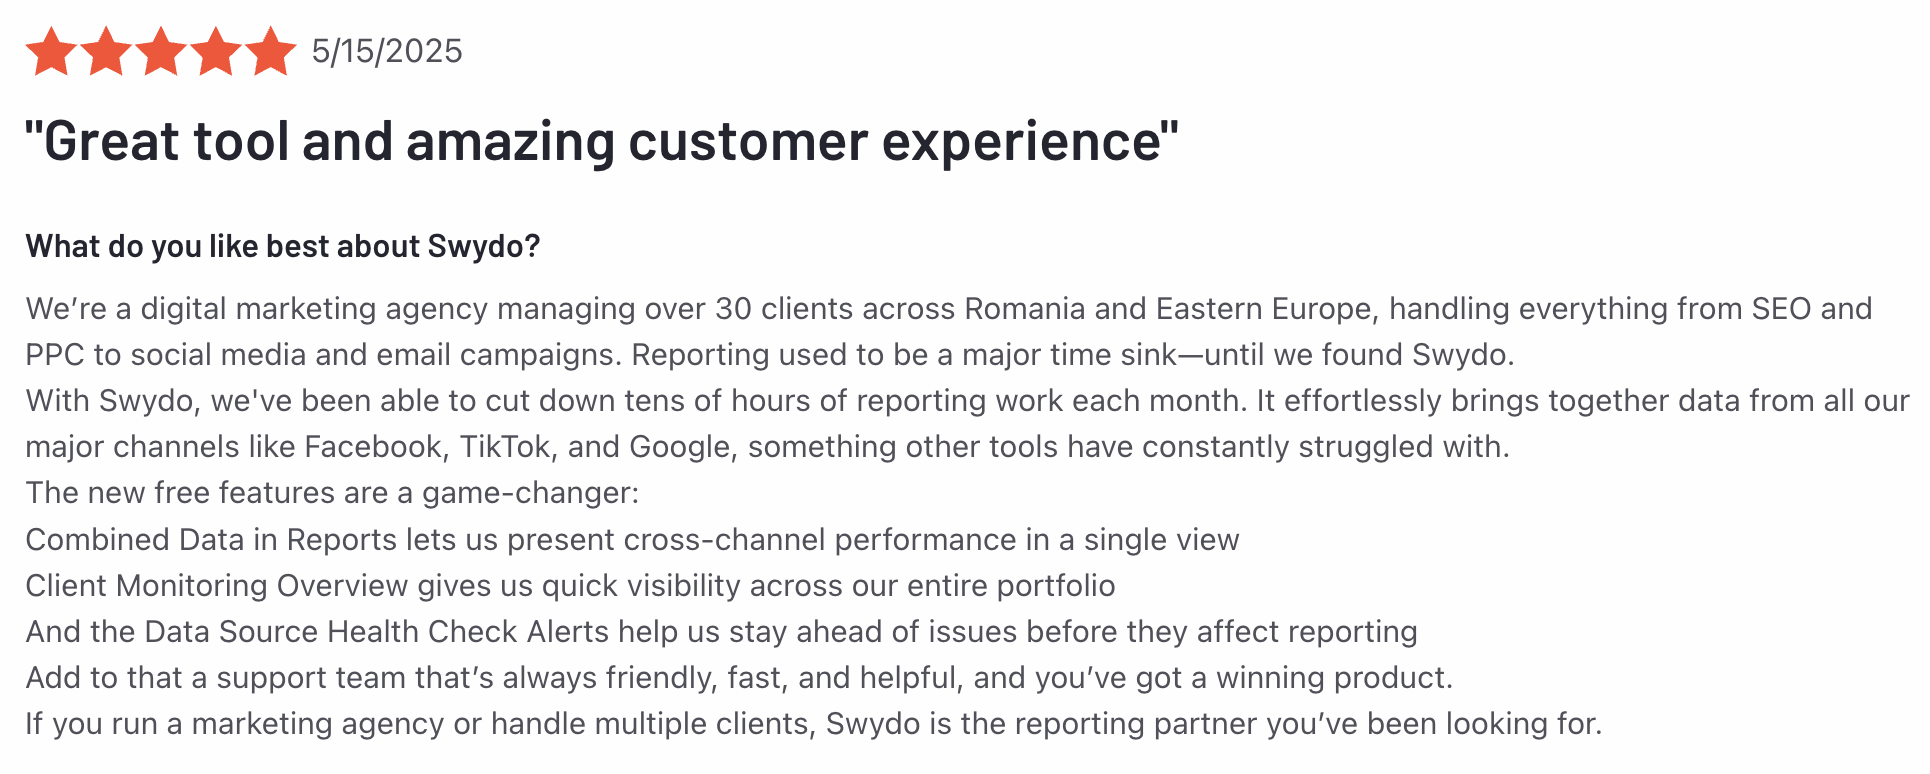
These quality-of-life features can help you spot problems before your client does.
✅ Easy to present polished reports without design work
You can deliver slick-looking reports without hiring a designer or fiddling with Canva. While customization is limited (we’ll get to that), for basic clarity and consistency, Swydo delivers.
Here’s what Natalie S. says:
Swydo is a really easy reporting tool to use, and with lots of visualisation options its easy to set up a dashboard that clients are happy with, showing them clearly what they need to see.
Swydo cons: Where users get frustrated
❌ Pricing is clear on the surface, messy underneath
The confusion often comes down to language: while you might think you're paying per connector (e.g. Google Ads), you're actually charged for each account or sub-source within that platform. So one client with five Google Ads accounts counts as five sources.
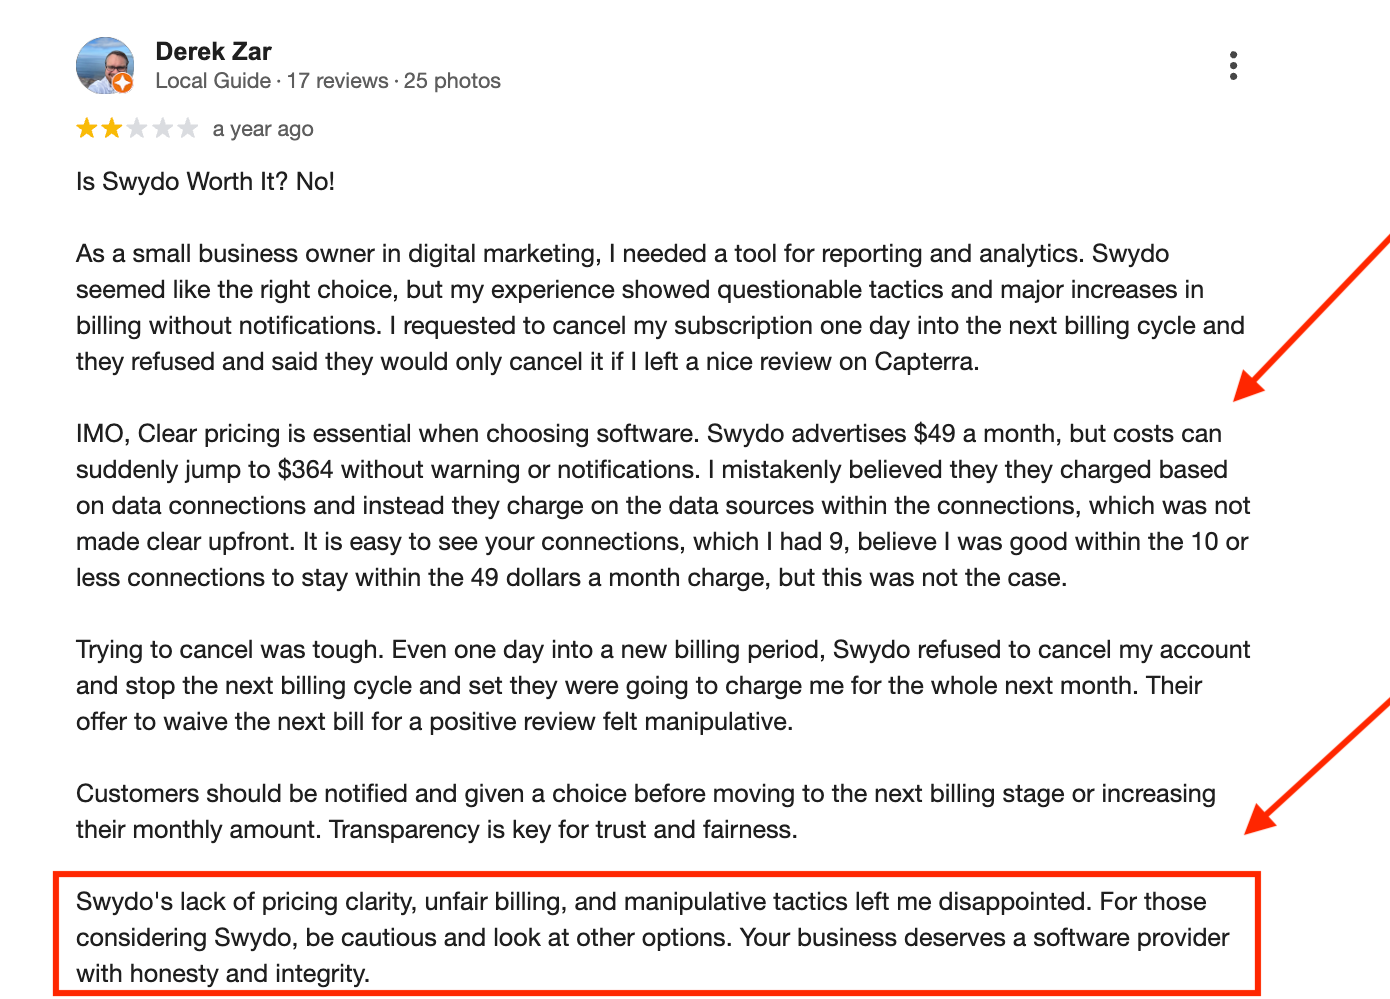
Derek Zar complains on Google:
I mistakenly believed they they charged based on data connections and instead they charge on the data sources within the connections, which was not made clear upfront.
There's also no warning when you're approaching your limit—and no real-time visibility into what’s about to push your bill up. A few users even reported price hikes of 5–7x their expected fee without clear explanation.
You also don’t get any pro-rata credit if you delete data sources mid-cycle. So if you offboard a client halfway through the month, you still pay full freight for the rest of the billing period:
The billing cycle does not prorate when sources are deleted halfway our billing cycle - so this affects our company's budget when we offboard a client.
❌ A customer experience that feels more sales-driven than service-driven
From the moment you hand over your email, you're pushed into a sales cycle. There’s no real trial, no hands-on evaluation, and no easy exit.

And when you try to cancel, some users report being pressured into leaving a good review in exchange for waived fees.
You need clarity, control, and a client reporting partner who respects your time. Swydo’s current setup doesn’t always deliver that.
❌ Some key metrics are missing or don’t match the source
When your client opens a report and sees a metric that doesn’t match what they’re seeing in-platform, you’re the one who looks sloppy.
George, a PPC Account Manager, complains on Capterra:
They don't have all the metrics from Advertising platforms, which can be frustrating and sometimes I find the metric pulls completely differently than whats in Google. This can be frustrating from the client as well when they want to see something and can't.
❌ Custom integrations are limited and developer-heavy
If you’re running campaigns on niche or regional platforms (like Yelp, Basis/Centro, or local ad networks), you’re likely on your own like Albert S.:
My agency uses several platforms that don't have official integrations on Swydo. Examples: Yelp, Basis (Centro), etc. Trying to get these setup via custom integrations has been difficult (or not possible) without a dedicated developer.
Before we get into the deep dives, a reminder that I wasn’t able to test Swydo hands-on, so everything in the following sections is stitched together from their Help Center documentation, official YouTube tutorials, and external YouTube reviews.
I’ve done my best to get a full picture based on what users actually experience and what Swydo officially supports.
Feature Deep Dive #1: Swydo Ease of Use
In practice, ease of use should mean that anyone on your team can build or tweak a client report, whether they’re a senior data analyst or a junior account manager. You shouldn’t have to sit through hours of tutorials just to pull a Google Ads report or align time frames across widgets.
Let’s see how Swydo fares.
Are there ready-to-use templates and drag-and-drop features?
Swydo offers ready-made templates for platforms like Google Ads, Meta, and LinkedIn, and also lets you build your own master templates.
Once inside a report, you can move widgets around. The UI supports a basic drag-and-drop mechanic—you click and hold a widget, then drag it into place. You can also resize widgets and control display settings (e.g., auto hide tables or toggle scroll bars).
To delete a chart, click the three-dot menu and remove it.
Swydo’s drag-and-drop lives inside a structured grid layout, and most customization happens through settings menus, not visual manipulation. There’s a bit of a learning curve, and from reviews, it doesn’t seem like the most user-friendly experience.
Now compare that to Whatagraph’s fluid interface built for easy visual iteration:
Let’s go 10 steps further.
With Whatagraph, you won’t even need to worry about drag-and-drop—you can get AI to create reports and widgets automatically, in seconds.
All you need to do is:
- Create a blank report.
- Type in a prompt for any kind of widget, chart or graph you want to create.
And AI will automatically create that widget, chart, or graph with the data you want to see.
Want to change that widget into a different graph? Just ask AI to edit the widgets however you want, and it applies the changes on your behalf.
Plus, AI can also generate performance summaries in 18 different languages and 4 content types (summaries, recommendations, wins, or issues) based on the data on your report.
See how it works here:
All of this means with Whatagraph, you don’t need to:
✅ Waste time manually writing performance summaries or creating widgets
✅ Watch hours of YouTube videos or read documentation to learn how to create a report
✅ Wrangle with broken reports or widgets
AI takes care of all that for you.
How easy and fast is editing dozens of reports?
Swydo offers bulk editing functionality through linked templates, but with a brittle, one-way workflow.
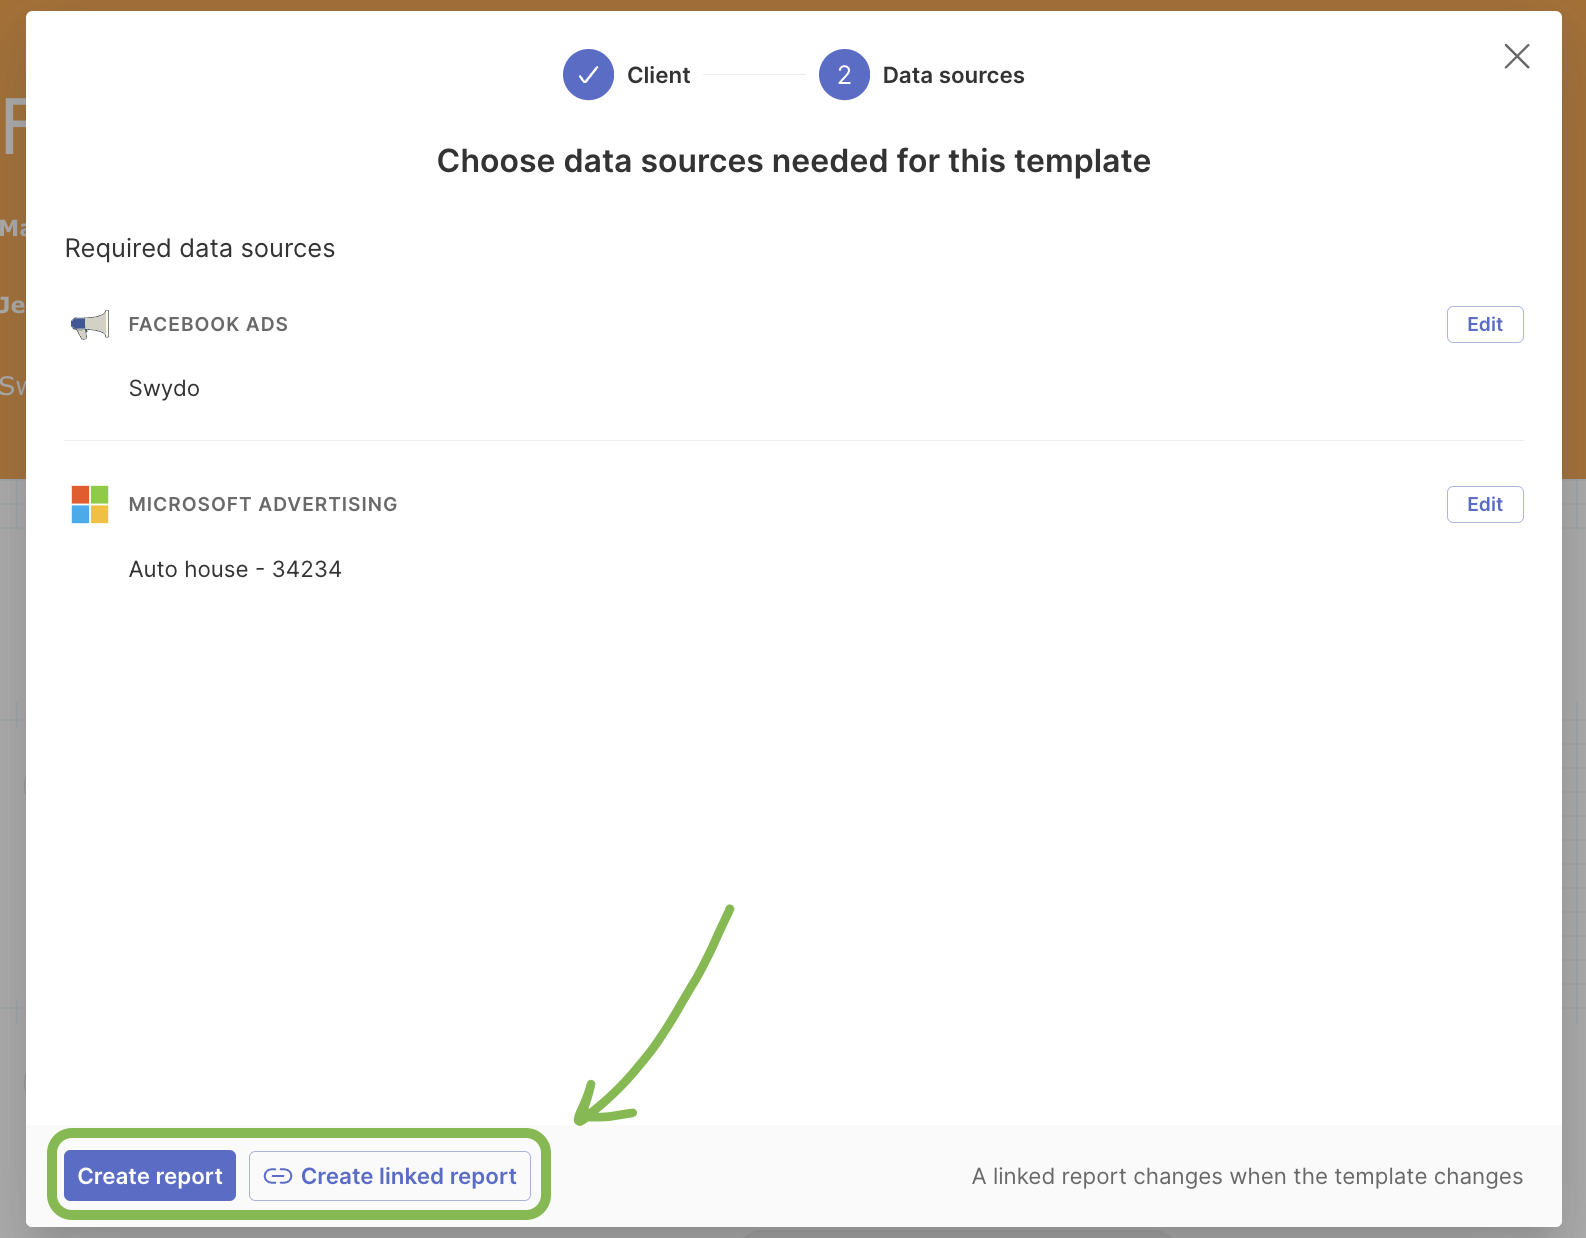
Here’s how it works:
- You can link a report to a master template. Any changes to the template (like adding a widget or metric) will auto-update in all linked reports.
- BUT once a report is linked, you can’t edit it structurally (no adding/removing widgets, no layout changes).
- And if you want to make even a small adjustment, you have to unlink the report.
And once unlinked, it’s permanently independent.
This is what their help center says: “Be aware that if you unlink a report from the template, it stays independent and cannot be relinked later.”
Swydo locks you into a choice: standardize or customize.
In Whatagraph, you can also create a master template and link multiple reports to it, but with much more flexibility that actually respects your reporting process.
- When you edit the template, changes do cascade to all linked reports—same as Swydo.
- BUT Whatagraph still lets you override individual elements within the linked report:
- You can add/remove widgets
- Change filters
- Adjust layout blocks
And still remain linked to the master template.
Here’s how it works:
Swydo offers basic drag-and-drop and template linking, but editing happens in rigid grids and nested menus. Bulk updates work, until you need a one-off change, and then you're stuck managing it manually.
Feature Deep Dive #2: Swydo Integrations
If the metrics don’t pull cleanly, if your platform doesn’t support a key data source, or if you’re stuck exporting CSVs every month, “automated reporting” suddenly becomes a part-time job.
So how does Swydo hold up when it comes to plugging into the tools you actually use?
How many out-of-the-box integrations are there?
As of July 2025, Swydo supports 37 native integrations, covering most of the big players: Google Analytics, Facebook Ads, Microsoft Ads, YouTube, Mailchimp, HubSpot, etc.
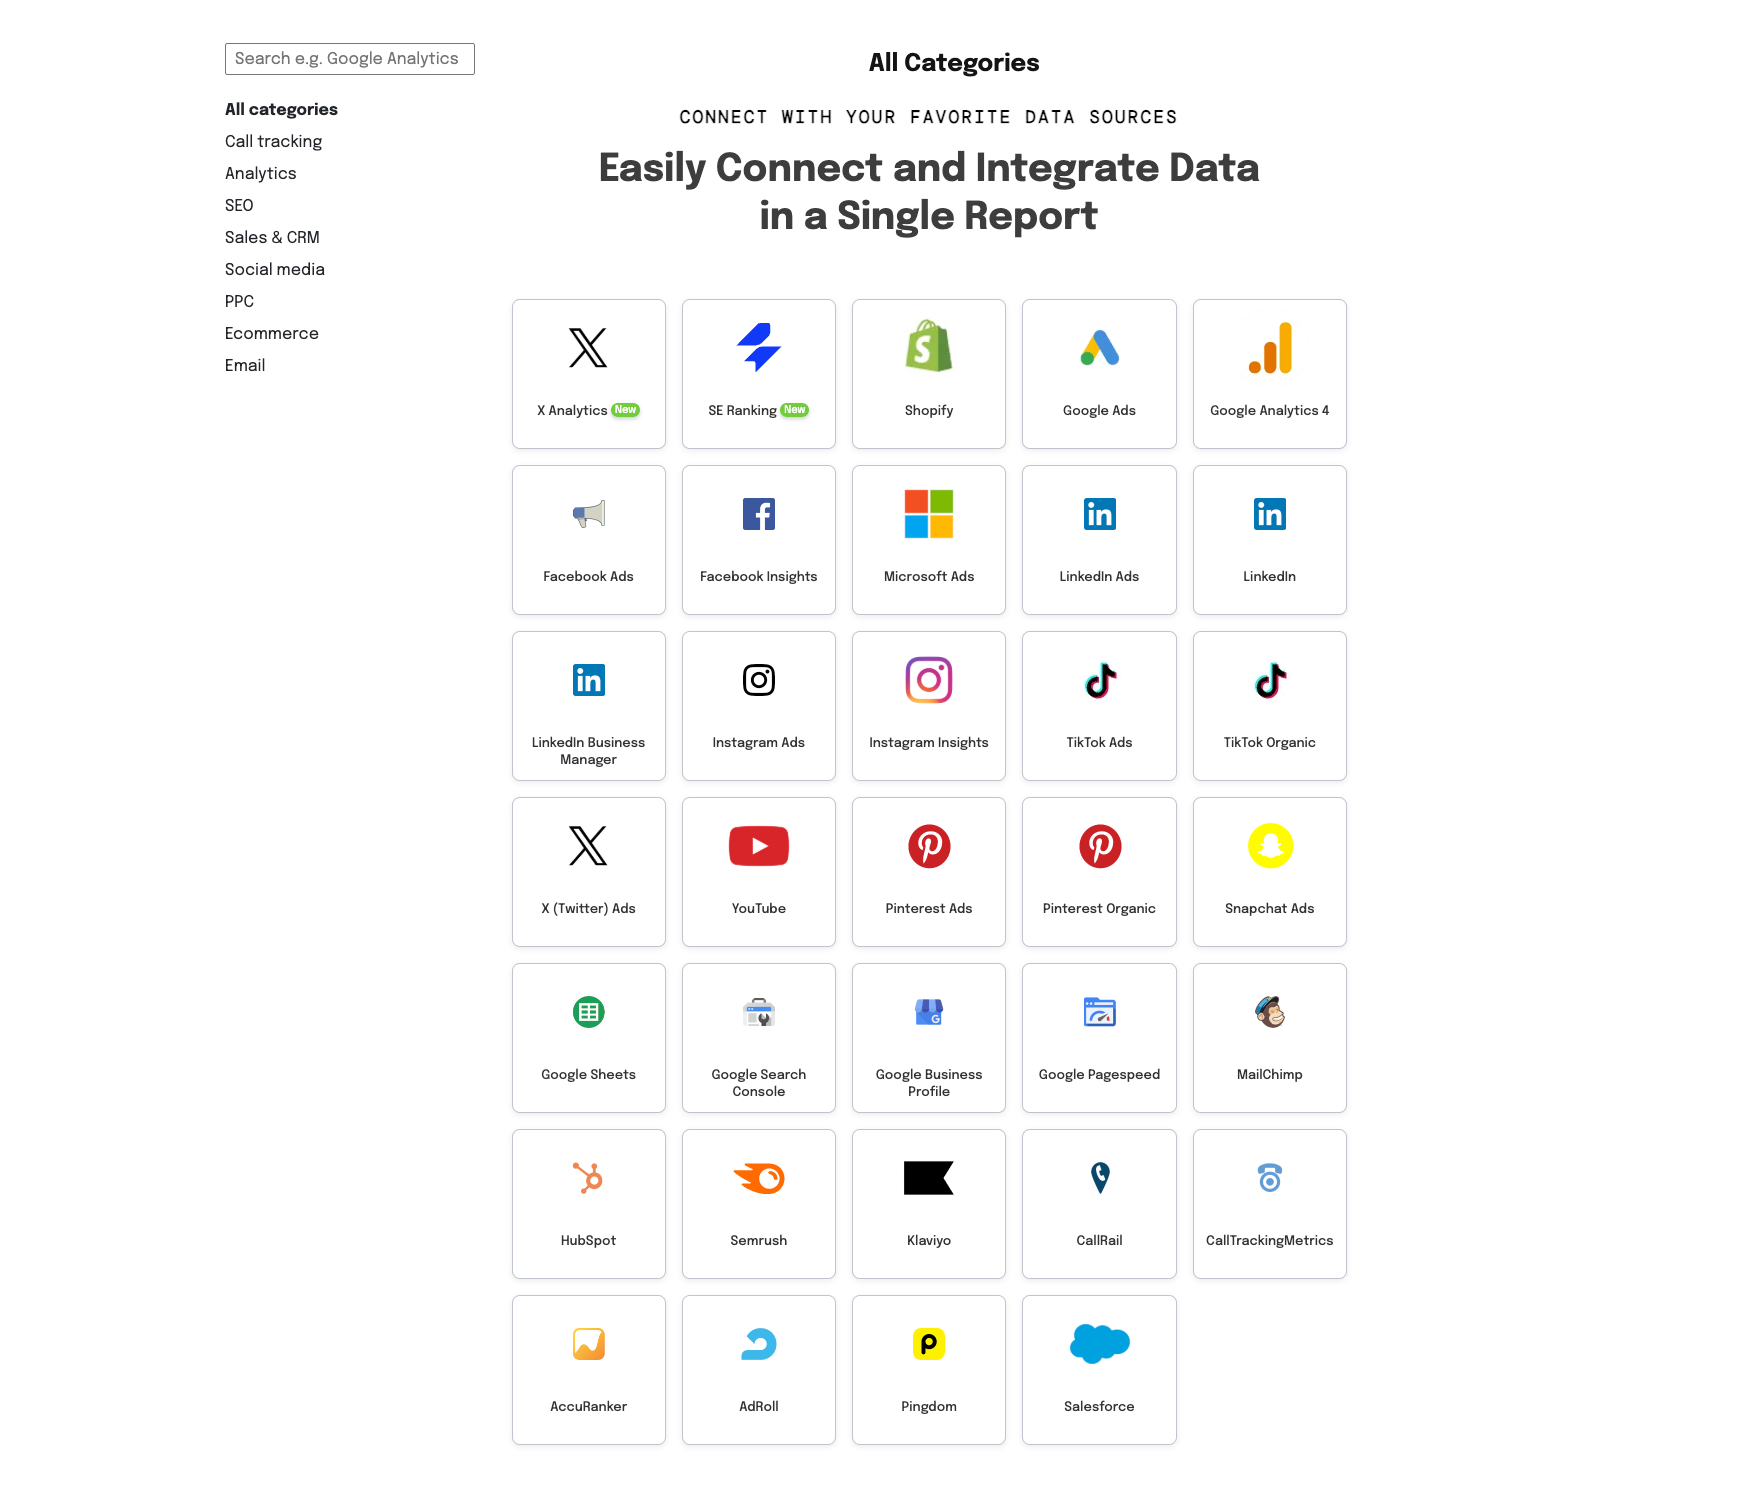
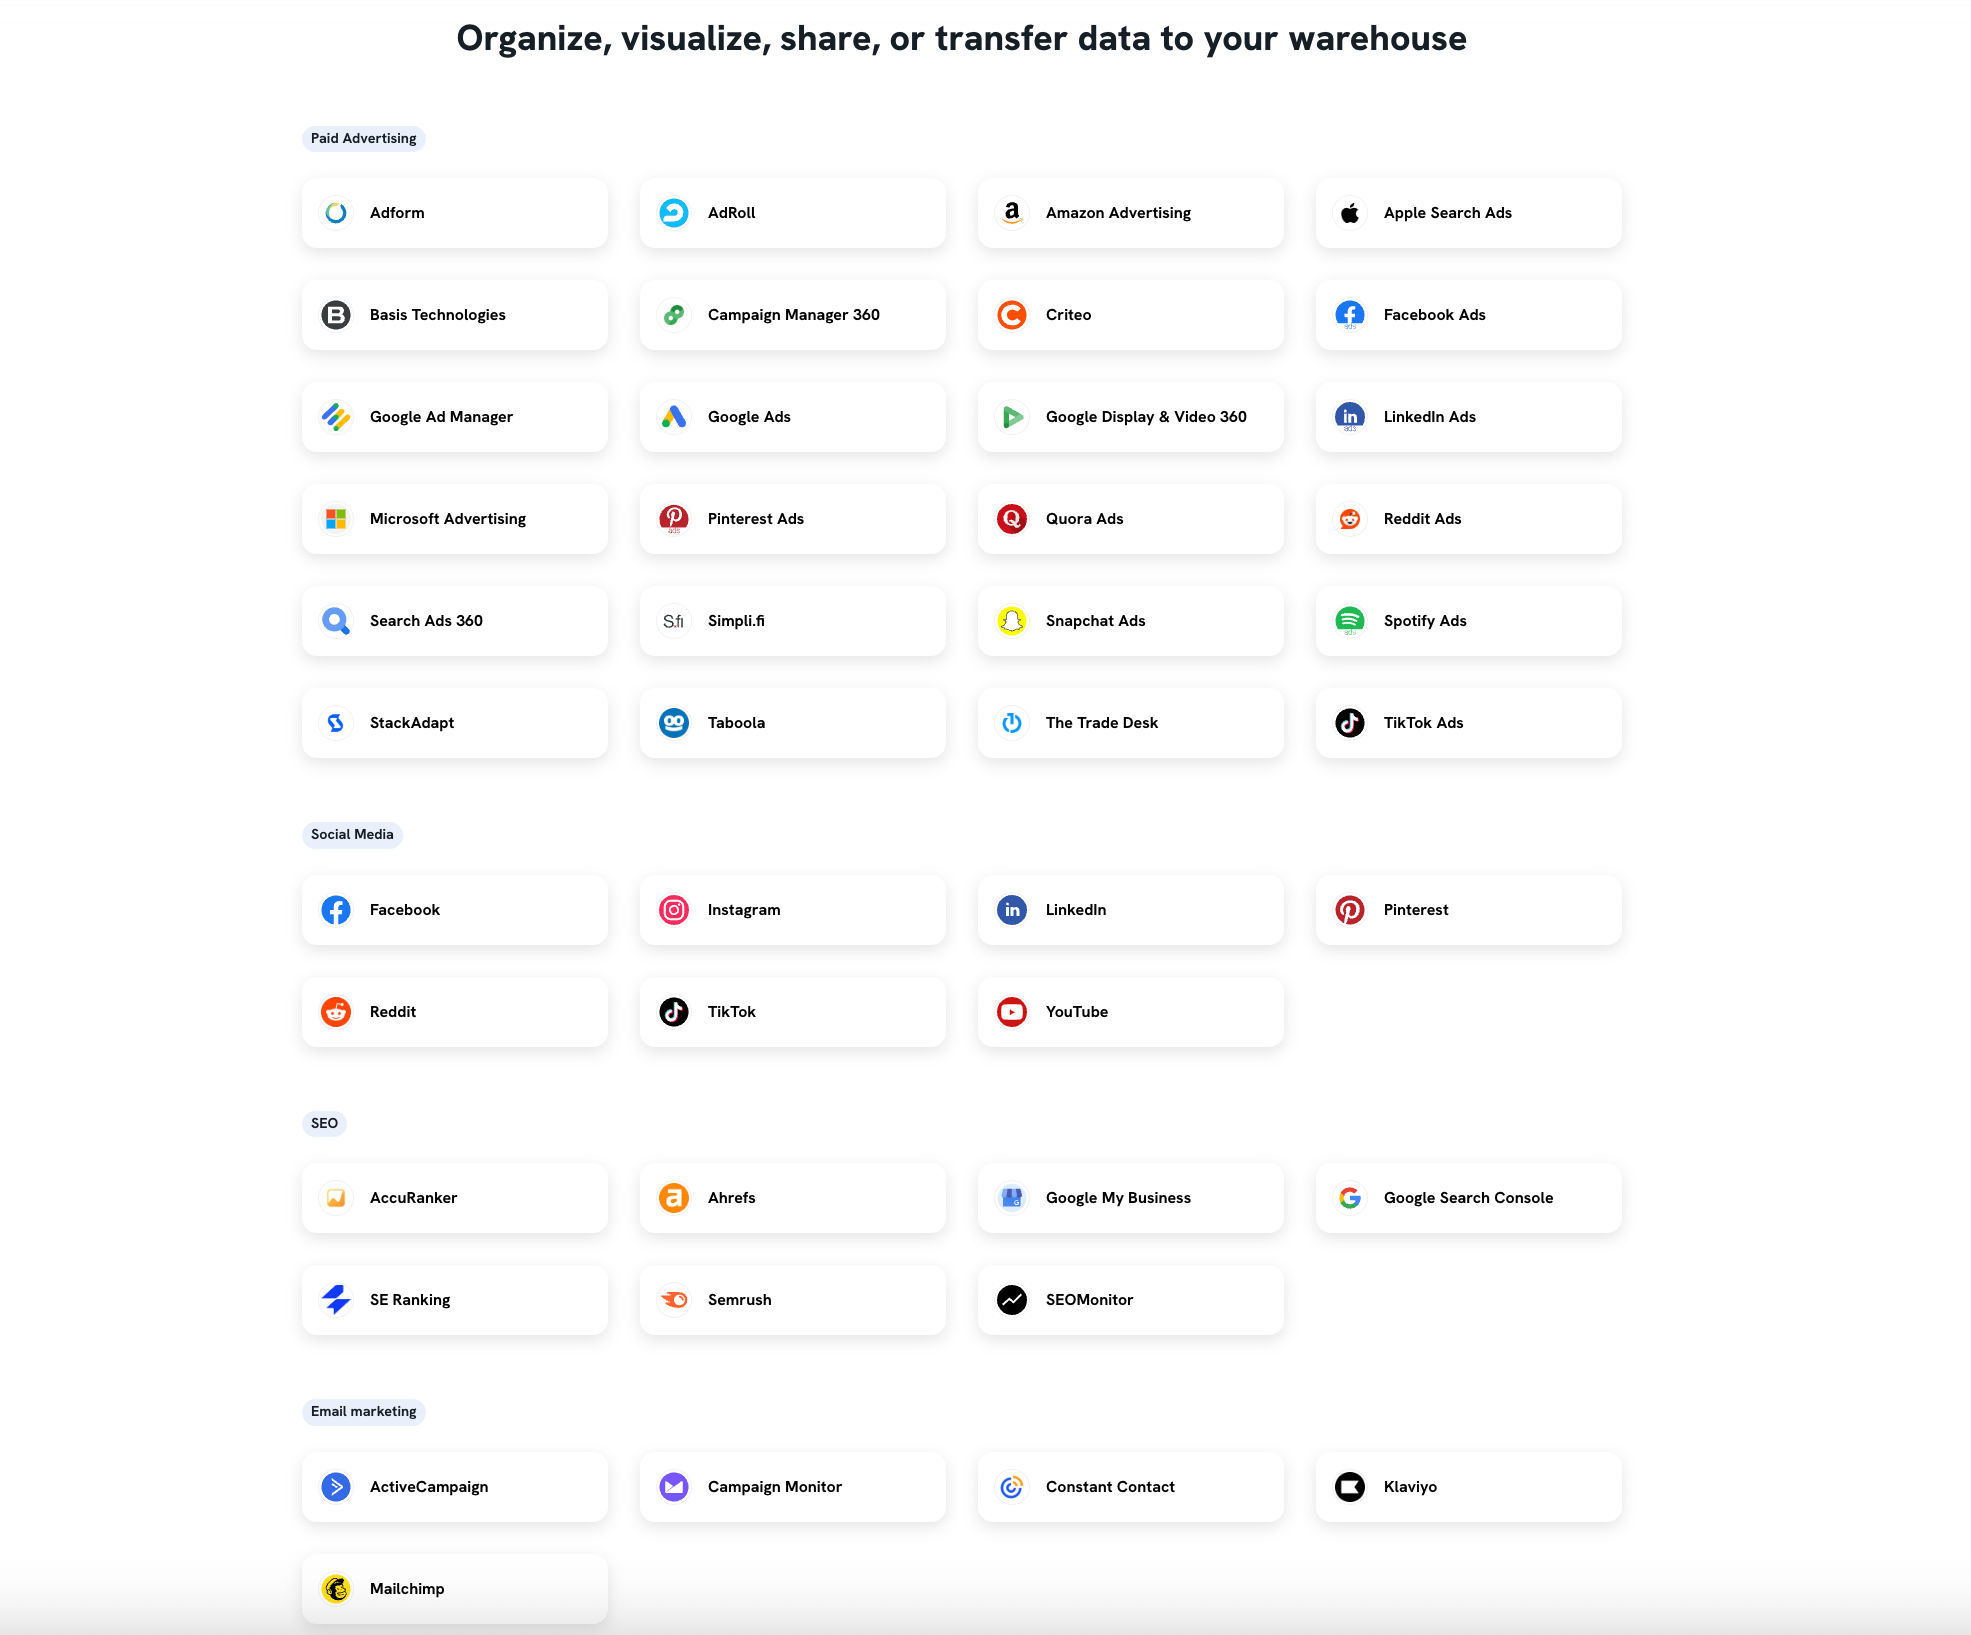
That sounds decent—until you compare it to Whatagraph’s 57+ connectors and quickly realize…
If I can fit all your integrations in one clean, legible screenshot…it’s not enough for most marketing agencies. ✨
And user reviews like Alana F.’s agree:
I wish Swydo integrated with my social media management tool…they do offer an option to input KPIs, which is helpful manually, but it would make it even easier if they offered integration with certain social management tools.
With Swydo, I can fit all integrations into a neat screenshot.
With Whatagraph, I have to scroll. That’s where the money is. (Literally and figuratively.)
And if you’re wondering about less common but widely-used marketing platforms like Amazon Ads, DV360, or Campaign Monitor, Swydo doesn’t support them out of the box.
But Whatagraph does, natively.
How reliable are these connections day-to-day?
Swydo gets points for covering core platforms, but when it comes to data accuracy and stability, the experience can be hit-or-miss.
Multiple users report incomplete or unreliable data pulls, especially for more specialized ad formats and ecommerce platforms:
And these complaints often come from five-star reviewers like Tami W.:
“Missing some of the LI Message ad analytics”
“I purchased swydo for the Klaviyo integration - not many other platforms offer this. However, the revenue is often broken and/or does not pull in so that is a bit frustrating, but I think that is more on Klaviyo's side as their API is so cumbersome and constantly changing.”
Fair enough. Sometimes the issue is upstream.
But for the end user—or the agency delivering the report—it doesn’t really matter whether it’s Swydo’s fault or Klaviyo’s. The data’s still broken, and your team still has to patch the hole.
Can you connect custom APIs or upload offline data?
Swydo technically supports custom data via Google Sheets, which is helpful if you need to plug in third-party metrics not covered by native integrations. That’s the workaround.
But it’s still…a workaround.
There’s no built-in no-code API connector, no CSV upload tool, and no direct support for data warehouses like BigQuery.
Whatagraph, on the other hand, builds in multiple ways to handle non-standard data:
- Google Sheets
- BigQuery
- Custom API
- CSV uploads for one-off reports or offline metrics
And if you ever find an integration’s not working correctly, our lovely customer support team replies in under 4 minutes via live chat, and we resolve issues within 4 hours.
Swydo supports 37 core integrations, but struggles with niche platforms, missing metrics, and fragile data syncs. There’s no CSV upload, no BigQuery support, and custom data often means duct-taping a Google Sheet.
Feature Deep Dive #3: Swydo Data Organization, Filtering, and Blending
Pulling metrics is just the first step. What you really need is control over how that data is grouped, sliced, blended, and packaged for different clients.
So how does Swydo handle that side of things?
Can you blend data easily or create custom metrics and dimensions?
Swydo’s newly-released Combined Data Sources feature lets you merge performance data from up to five ad platforms, like Google Ads, Meta, TikTok, and Microsoft Ads, into a single widget. You can display blended KPIs like cost, clicks, impressions, and conversions in tables, donut charts, or treemaps.
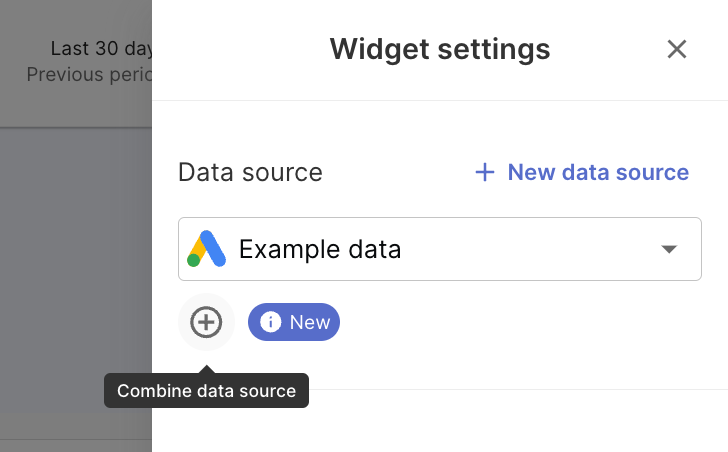
But this is data blending-lite.
Now, here’s what you can’t do:
- Create your own calculated metrics or formulas.
- Blend across non-ad platforms (e.g., GA4 + CRM + ecommerce).
- Mix platform-specific metrics that don’t have exact equivalents.
- Control currency or date normalization across platforms.
For example, if your first data source is set to USD and the second to GBP, the total spend will be converted, but not uniformly explained. And if you try to blend conversions from Google Ads with Meta, Swydo might drop the metric entirely depending on compatibility.
There’s no formula builder, no ability to create custom dimensions, and no logic-based grouping like “campaign name contains X.”
Now compare that to Whatagraph’s functionality:
- Blend data from any platform, including GA4, Shopify, HubSpot, etc.
- Apply custom formulas across sources.
- Normalize currencies and date ranges.
- Build multi-source tables and apply logic at the field level.
See how Whatagraph groups, blends, unifies, and, aggregate your data with Organize:
What kind of filtering can you do in Swydo?
Based on information from their YouTube tutorial, Swydo offers straightforward filtering that works well for basic use cases:
- Filter by time period, like last 30 days, custom date ranges, etc.
- Add dimensions like day, keyword, device, campaign, etc.
- Exclude values manually by tag, keyword, or campaign
- Sort results by metric values (e.g. CPC, conversions)
Each widget automatically picks up your report-level date range unless overridden, and you can add filters per widget for more control.
You can also create custom metrics by applying formulas on existing metrics (e.g., ad spend + 20% markup). These formulae can then be used in widgets.
As far as I can tell, in Swydo, filters are widget-specific. You add them one-by-one while setting up each chart or table.
The Whatagraph advantage: Your entire report is dynamic. Your clients can open the Data Drawer and change dimensions or metrics on the fly—without touching the underlying report.
You also get source-level filters that apply globally. One click, and it updates everything:
How can you manage clients on Swydo?
Swydo organizes your reporting workspace around individual client profiles. Each client gets their own space with connected data sources, assigned team members, and a customizable dashboard.
You can:
- Add client logos and contacts to personalize reports.
- Assign teammates to specific clients for access control.
- Connect data sources like Google Ads, Facebook, etc.
- Set up Monitoring Boards with KPI widgets for real-time tracking.
- Configure alerts if key metrics fall below target thresholds.
- Archive clients without losing data (and without paying for unused accounts).
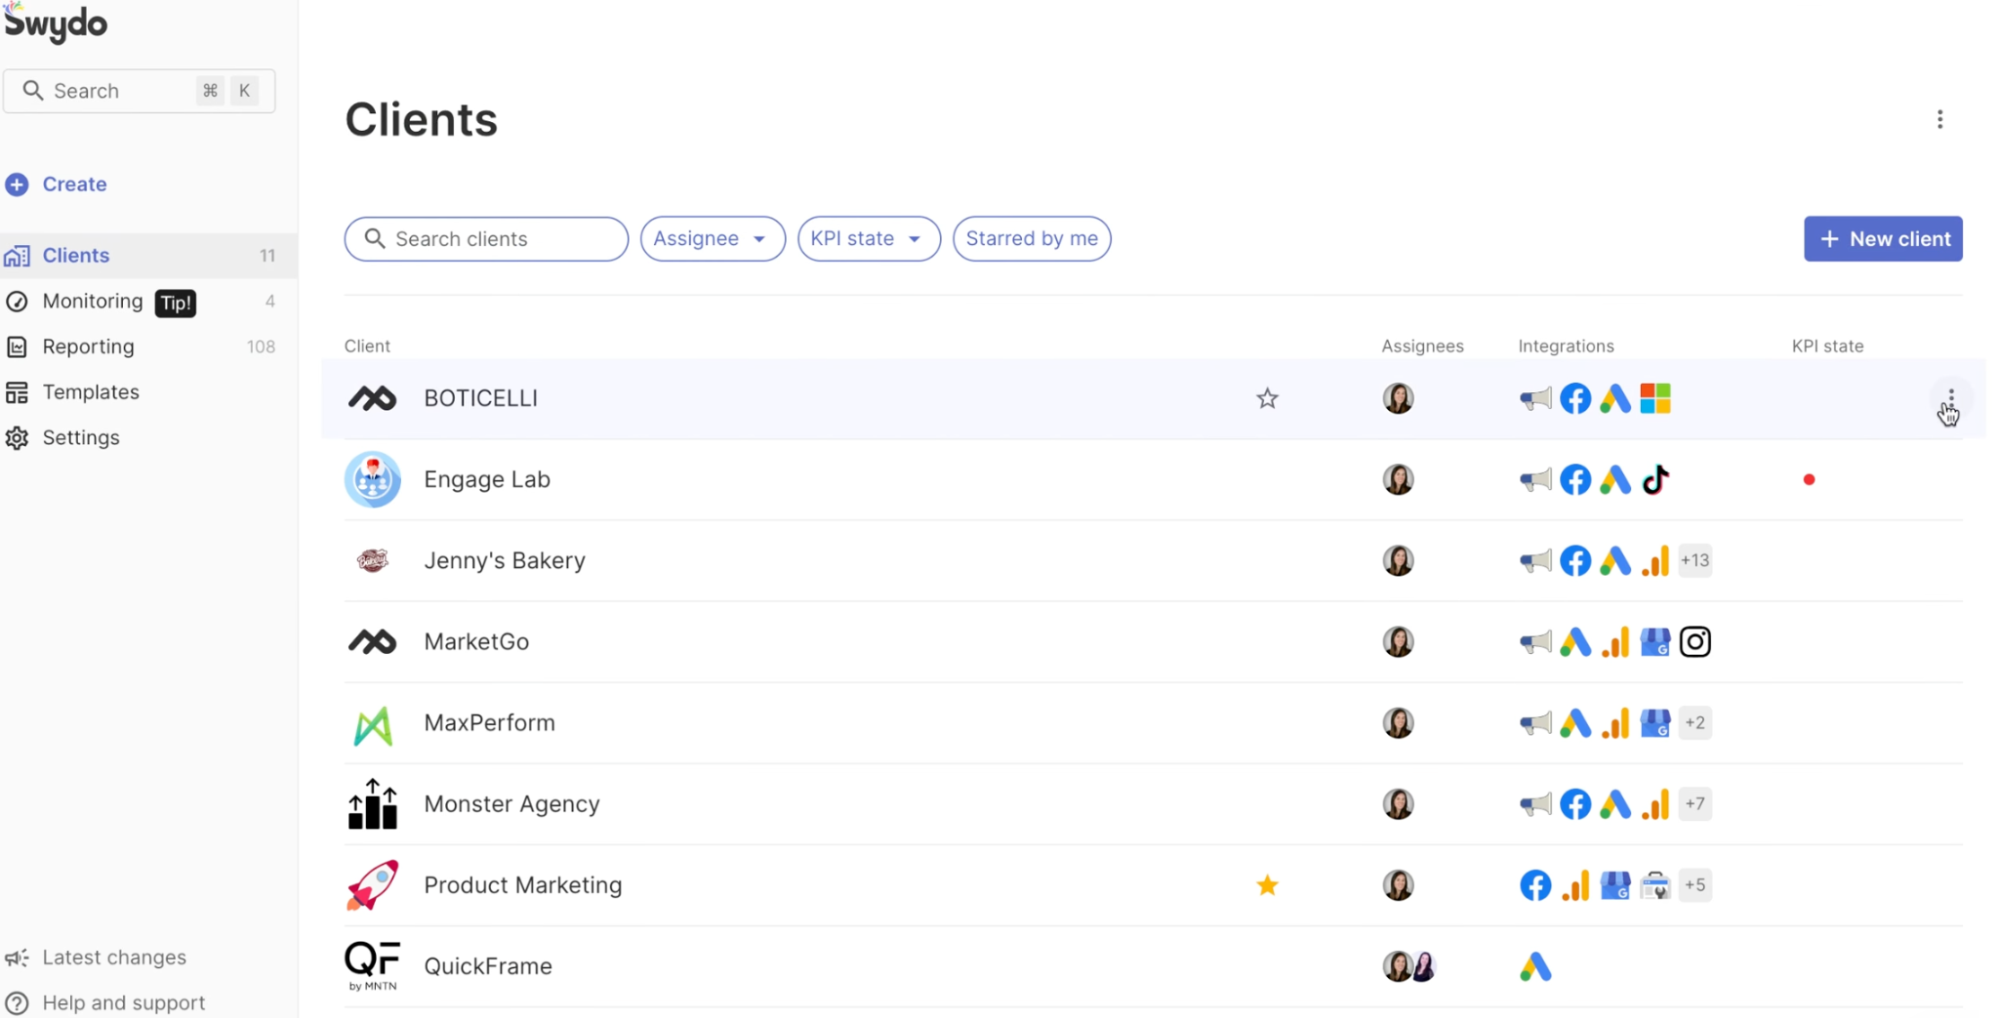
But keep in mind: everything is still fairly siloed. There's no global dashboard for viewing cross-client performance, and automation between client workspaces is limited compared to tools like Whatagraph.
In Whatagraph, you get automation at scale with everything housed in a single reporting environment:
- Folder-based reports: Organize by client, campaign, or any category. No separate accounts needed; all reports live under one agency umbrella.
- Overview and source filters: Use the Overview feature to monitor all clients in one dashboard, and apply filters across every report instantly.
Swydo covers the basics—blending up to 5 ad sources, widget-level filters, and simple client folders. But if you're juggling 10+ clients, it starts to creak. No custom dimensions. No formula builder. No cross-client views.
Feature Deep Dive #4: Swydo Reports and Dashboards
Can Swydo help you build slick, useful, repeatable reports without burning hours?
Let’s break it down.
How are reports built (templates vs. custom)?
Swydo gives you two options:
- Start from a prebuilt template for common platforms (Google Ads, Meta, LinkedIn, etc.)
- Or create a custom report from scratch using widgets and KPIs.
Templates are helpful, but rigid. Once you link a report to a template, customization is heavily limited unless you unlink (which, by the way, you can’t undo).
If you need wiggle room or want to tweak layouts for different clients, you’ll either need to build from scratch or clone and unlink manually.
What can you actually customize?
Swydo gives you decent control over the look of your reports, but less so over the structure.
They themselves admit that there are “limited white-labeling options compared to competitors.”
Here’s what you can customize:
For branding and styling your reports, you can:
- Set brand colors, fonts, and background images.
- Customize chart colors and add borders.
- Create reusable brand templates across all clients.
- White-label reports by removing Swydo’s footer logo.
- Send reports from a custom domain + email (with some setup).
❌ But here’s what you can’t do in Swydo:
- Change layouts freely or design fully responsive sections.
- Embed third-party content (videos, forms, calendars, etc.).
- Apply global design rules (e.g., dark theme for all reports).
- Let clients interactively swap views like in Whatagraph.
If you don’t want to hit a ceiling on customization, Whatagraph gives you full creative control.
Define brand themes, style individual widgets, and apply your exact colors at the global, report, or widget level.
Plus, send reports from your own domain and email—no extra tools, no DNS headaches, no branding gaps.
And now, Whatagraph’s new AI-powered branding assistant takes your visual identity and applies it across the entire report:
- Open a report.
- Upload your brand book (or just type “Use my brand’s colors and Montserrat font”).
- AI detects the styles and rolls them out across every chart, widget, and page.
You can still tweak the final look manually, or hit send and call it done. Either way, you’ve got a professional, on-brand report in seconds.
This is the Whatagraph way.
What are your sharing options (and how automated/efficient are they)?
According to their documentation, here’s what’s available:
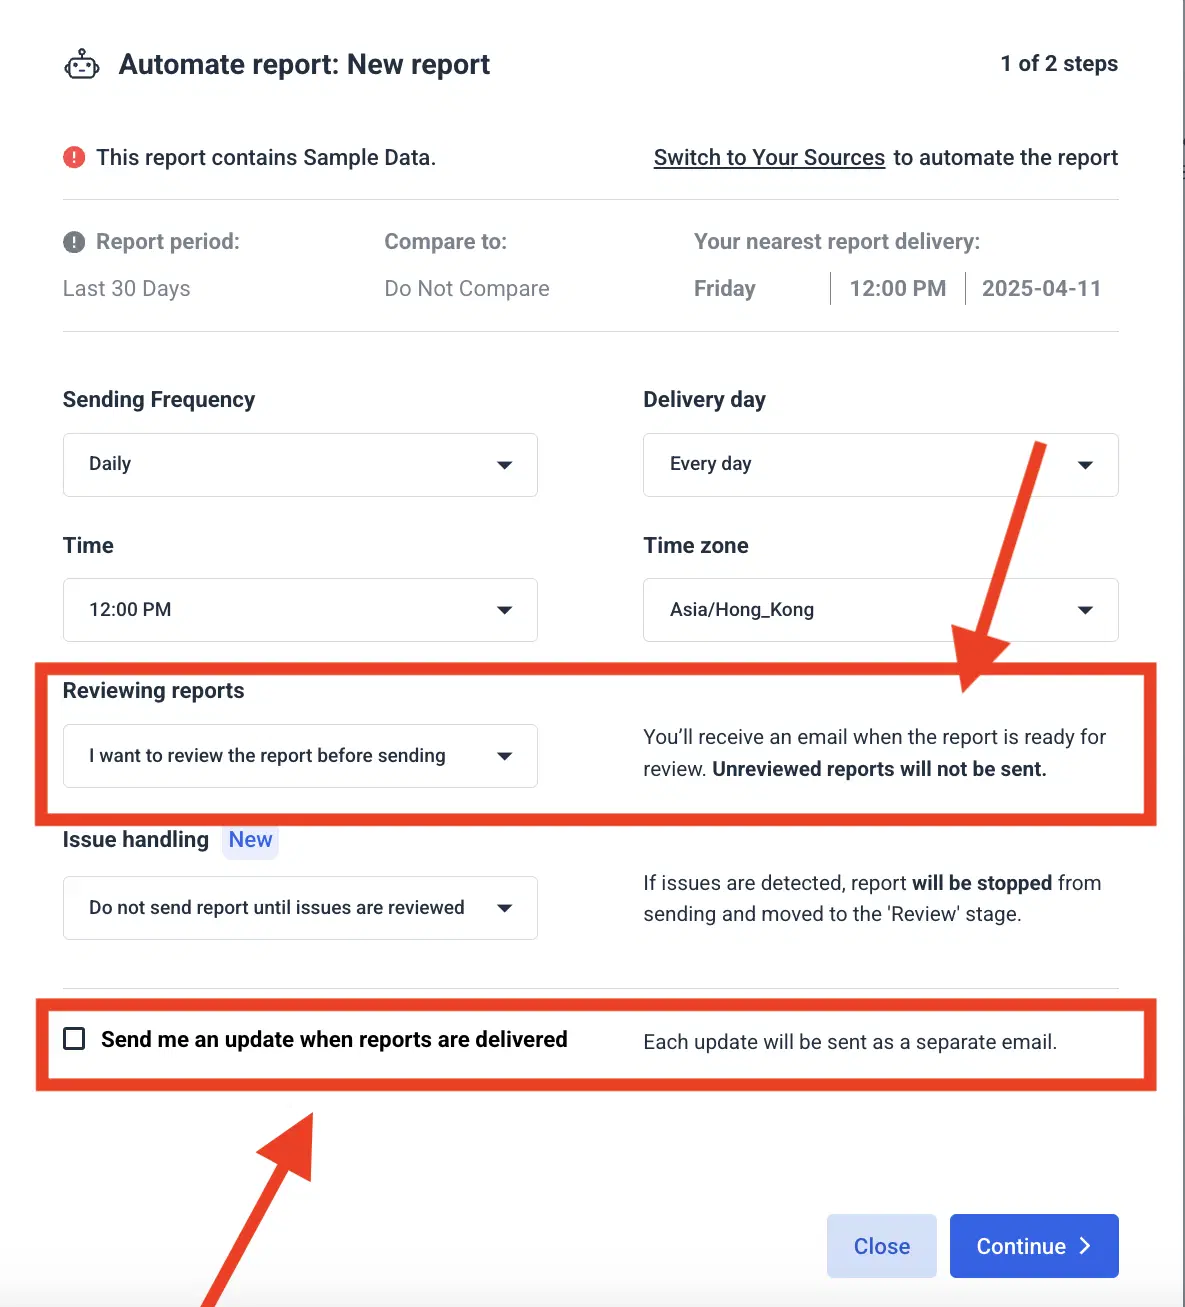
1. Swydo lets you set up recurring scheduled report deliveries (daily, weekly, monthly) with full control over:
- Timezone matching for each client.
- Delivery format, like PDF attachment, inline PDF, or dashboard link.
- Date ranges and comparisons (e.g., MoM, YoY).
- Failure handling where you choose to skip sending if data targets aren’t met. (This is a pretty nifty feature).
2. You can also send ad hoc reports with a custom note, which is great for urgent updates or QBRs. But this is manual. There’s no option to templatize or batch-send across multiple clients.
3. Generate a unique link for any dashboard. Clients can explore updated data anytime. You can:
- Allow or restrict date range changes.
- Bookmark the view for quick client access.
4. Use Swydo’s built-in presentation mode to walk clients through a report in real-time, with:
- Highlight tools (laser pointer).
- Direct dashboard integration.
But as far as I have researched, everything is static.
The Whatagraph advantage: A full-stack automation suite with fail-safes and approvals baked in. Here’s what that actually looks like:
- Pre-send review: You’re in control. Nothing goes out until you say so. Perfect for sensitive clients or end-of-month recaps that need a second pair of eyes.
- Error detection + send pausing: If Whatagraph spots incomplete or corrupted data—say, a connector fails or a metric doesn’t load—it automatically pauses delivery.
- Delivery confirmations: Enable real-time “report sent” notifications so you’re never left wondering if something slipped through the cracks.
- Dynamic reports, not static snapshots: And since Whatagraph reports are live links, not PDFs frozen in time, clients can adjust date ranges, toggle filters, and explore data on their own, without breaking anything.
 More importantly. Whatagraph makes data transfers to data warehouses like BigQuery and visualization tools like Swydo easier, reducing manual data handling.
What about AI features for insights?
From my research as of June 2025 across Swydo’s YouTube tutorials and their help center articles, the reporting software offers no AI features.
If you’re hoping for AI to speed up post-report storytelling or surface outliers, you’ll need another tool…
…or a powerful all-in-one data visualization and reporting tool like Whatagraph.
We know innovation isn’t optional in your marketing efforts, which is why Whatagraph’s AI is a meaningful add-on in every workspace, and on every plan.
Here’s what you get:
- AI-generated summaries in text widgets for quick, digestible commentary.
- An AI chatbot that can actually talk to your data—pulling performance highlights, trends, and answers without opening 10 reports.
Swydo offers decent templates and automated email scheduling, but customization is rigid and interactivity is limited. There’s no AI, no bulk automation, and no support for advanced layouts or embedded content.
Feature Deep Dive #5: Swydo Customer Support
We read all Swydo reviews and complaints from 2025.
Read on to see what the word on the ground is.
Is there a dedicated Customer Success Manager (CSM)?No.
According to their site and help center, support comes via:
- 24/5 email & live chat, with human responses within minutes. (I couldn’t personally time the help desk because I don’t have a Swydo workspace, but the 24/5 custom support button opens my email app.)
- A Help Center with DIY resources and how-to videos.
- Free onboarding and account migration services.
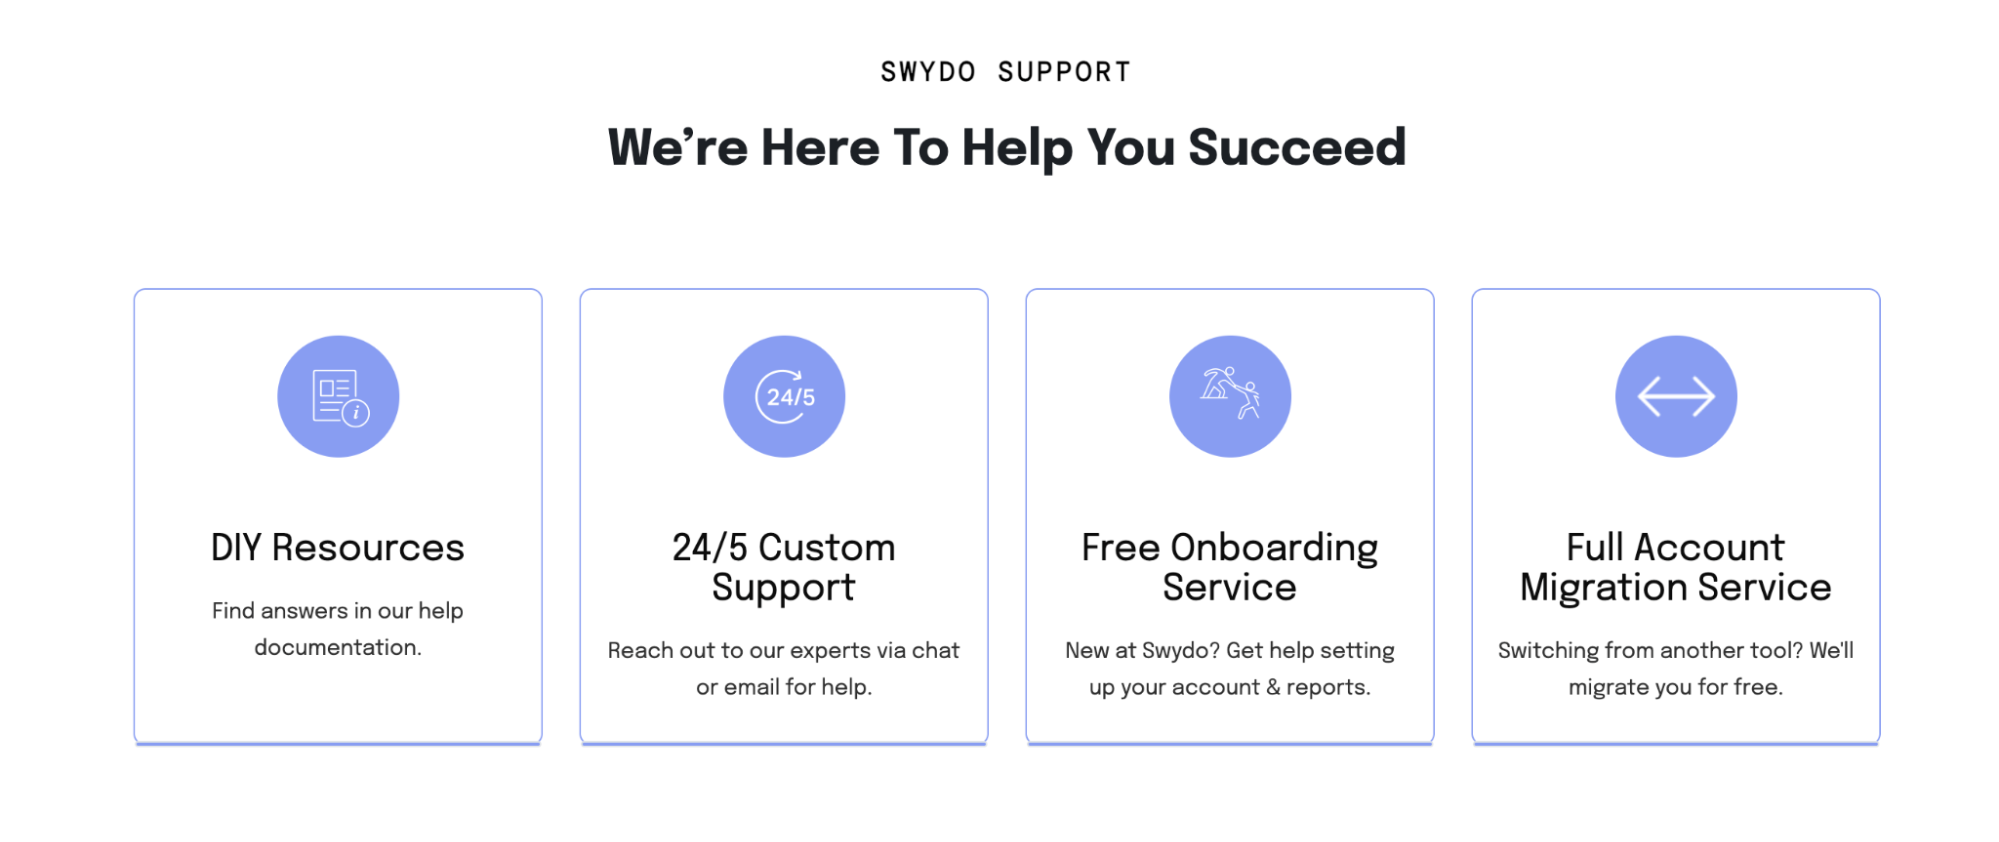
So while their reactive support is strong, there’s no proactive CSM role guiding adoption and strategy.
It's more “on-demand help” than “built-in partnership.”
The Whatagraph advantage: Every plan comes with a dedicated Customer Success Manager because for us, customer service is more than an add-on—it’s a promise of what we can do for you.
And our dedication to top-notch customer success is what clients like Stef Oosterik, Quality Manager at Dtch. Digitals, LOVE about us. We fix things quickly, and follow up daily on the more complicated ones.
And if you want us to bring in a new feature, just TELL US. We implement approximately 90% of our clients’ feedback.
Whatagraph's support team is very responsive…9 out of 10 cases, the issue gets resolved, and most are fixed within a day. I’d also say 80 to 90% of the necessary features we’ve requested have been implemented.
What are real users saying about their experience about Swydo?
Let’s start with the good news: support seems to be one of Swydo’s strong suits.
I pulled user reviews only from 2025, across G2 and Capterra:
- On G2, 8 out of 27 users went out of their way to praise the support team—calling them friendly and genuinely helpful.
- On Capterra, 6 out of 11 said the same.
But dig a little deeper, and you’ll notice a pattern that hasn’t entirely gone away.
A recent Capterra review from just 3 months ago drops this warning:
Be very careful with your credit card when dealing with this company [Swydo].
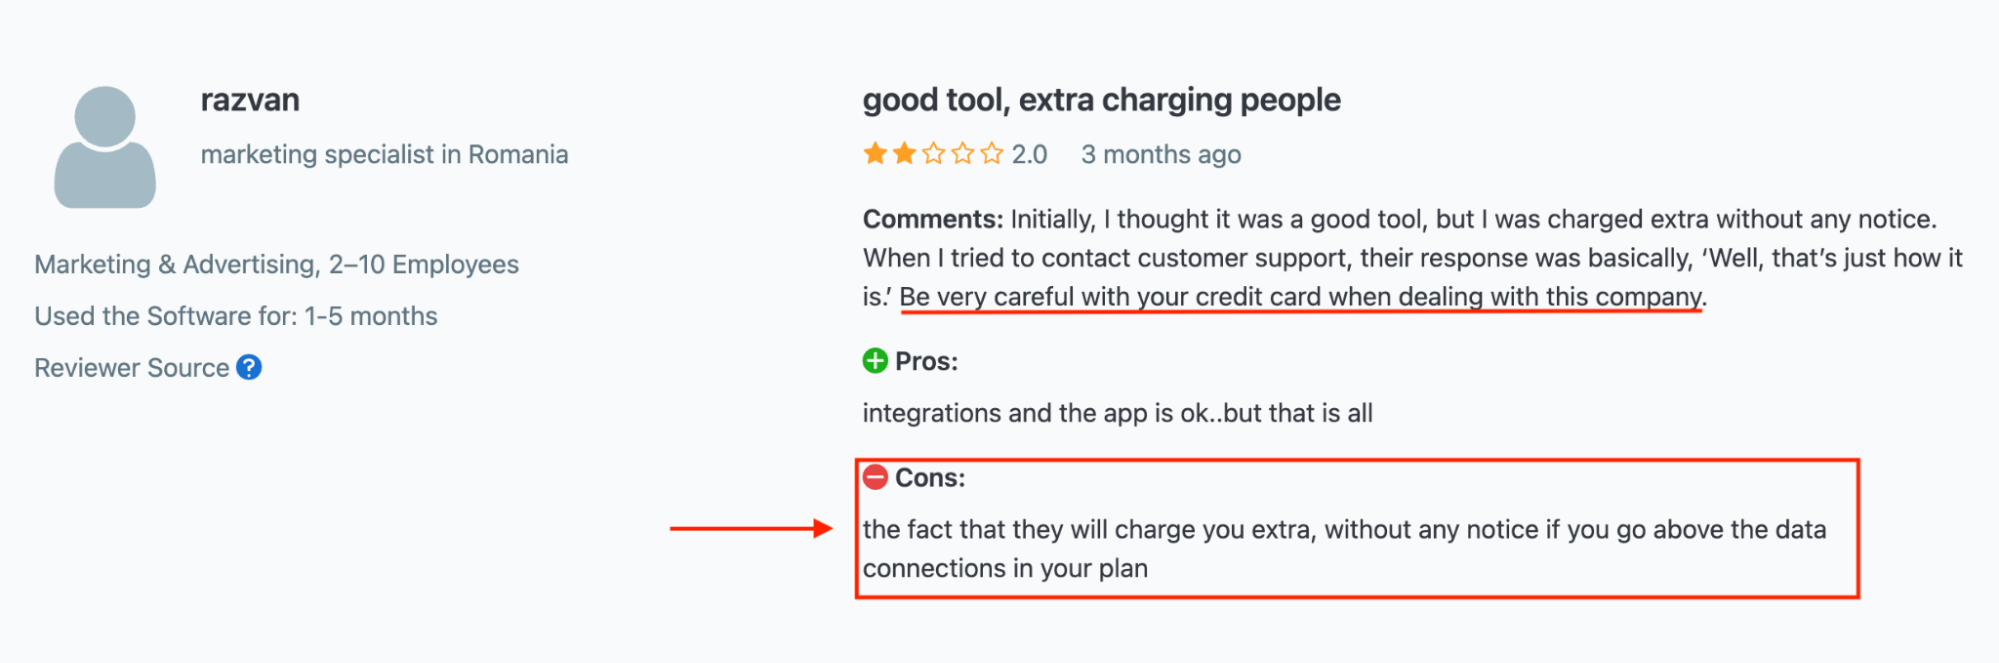
They were charged extra without warning for going over data limits—and when they asked why, the answer was basically “Well, that’s just how it is.”
We’ve seen this theme show up in reviews from the past year or two, and we’ve covered it above too: sticker shock, unclear pricing, and sales conversations that feel more aggressive than transparent.
This latest review feels like an echo of those earlier complaints. Especially when sales takes the driver’s seat.
They seem to have improved in 2025, but when it comes to money, a little caution never hurts.
If you want to steer clear of tools that bury the fine print or quietly charge extra for exceeding data limits, Whatagraph keeps it clean.
You scale intentionally, not accidentally.
No CSMs, no strategic onboarding. Just live chat, email, and a DIY Help Center—it’s solid reactive support, but don’t expect a partner in your corner.
Final Verdict: When to Use Swydo and When to Switch
Choose Swydo if…
- You’re a lean team focused on ad reporting only: Swydo is built for paid media teams running performance dashboards on Google, Meta, LinkedIn, and co.
- You want fast setup and PDF-based delivery: The templates are ready, the interface is mostly clean, and scheduled emails make monthly updates easy.
- You’re okay with some limits on blending, branding, and AI: If basic charts, siloed filters, and no CSMs work for you, Swydo might check the boxes.
Choose Whatagraph if…
- You manage multiple clients or cross-channel data: Blend CRM, ecommerce, web, and ad data—no compatibility issues, no extra connector fees.
- You care about full brand control and dynamic delivery: Style every widget, use custom domains, and send live dashboards instead of static snapshots.
- You want AI, automation, and real support baked in: Every plan includes a CSM, AI summaries, error detection, and pre-send approvals.
See how effortless client reporting can be. Book a Whatagraph demo and get unlimited connectors, live dashboards, and human support that actually shows up.