13 Best Swydo Alternatives to Add to Your Shortlist in 2026
Swydo is a great reporting tool for freelancers and small agencies, but it can become limiting as your business grows.
To help you find the best Swydo alternative, we talked to marketers and scoured online community forums, and came up with this list of 13 tools.
In this article, you’ll read:
- The shortcomings of Swydo
- 13 best Swydo alternatives
- Reviews, features, and pricing of each tool

Mar 31 2026●10 min read


The biggest complaint we heard about Swydo is that it’s very limited. Here are a few ways how:
❌ Limited integrations: Swydo only offers 34 native integrations, which doesn’t include common channels like Amazon Advertising, Google DV360, and Campaign Monitor. You can upload your own data via Google Sheets, but this creates more work and takes longer time to implement.
❌ Limited data transformations: Swydo's data blending is narrow; you can combine metrics from up to 5 ad platforms into a single widget, but you still can't create custom dimensions or blend across non-ad data sources.
❌ Limited customization options: Users say Swydo is “aesthetically simple” with little control over how widgets look on reports. You can’t add icons to widgets, adjust the column widths, or change the currencies on widgets.
❌ Basic AI: Swydo launched an Swydo AI in late 2025, but it's fairly surface-level. You can generate a summary, flag wins and issues, or ask questions about a specific report. But you can’t query across multiple clients or reports at once, get proactive anomaly detection, or have AI that works across your entire data stack.
❌ No data transfers: Swydo is purely a reporting tool—you can't ship your data to data warehouses or business intelligence platforms.
❌ Unstable: A lot of the ex-Swydo users who came to Whatagraph say the platform is unstable with data connections breaking often.
---
If you’ve outgrown Swydo, we’ve got your back.
In this article, we’ll take you through 13 best Swydo alternatives which come with more integrations, data transformations, and customization options.
13 Best Swydo Alternatives and Competitors in 2025
In a nutshell, here are the 13 best Swydo alternatives we’ll review in this article:
- Whatagraph
- Tableau
- Geckoboard
- Looker Studio
- AgencyAnalytics
- TapClicks
- Databox
- DashThis
- Grow.com
- Funnel.io
- Supermetrics
- Improvado
- NinjaCat
Let’s dive into each of these tools.
1. Whatagraph
Best for: Marketing agencies and in-house marketing teams that want AI-powered reporting with flexible prices
If you're looking for a stable reporting platform that connects, organizes, and analyzes your marketing data without needing a data team behind you, Whatagraph is built for you.
Here's how it works:
- Connect: Plug into 55+ marketing platforms via native, fully managed connectors that stay stable.
- Organize: Build custom metrics, dimensions, and data blends through no-code workflows, or describe what you need and let Whatagraph IQ create them automatically.
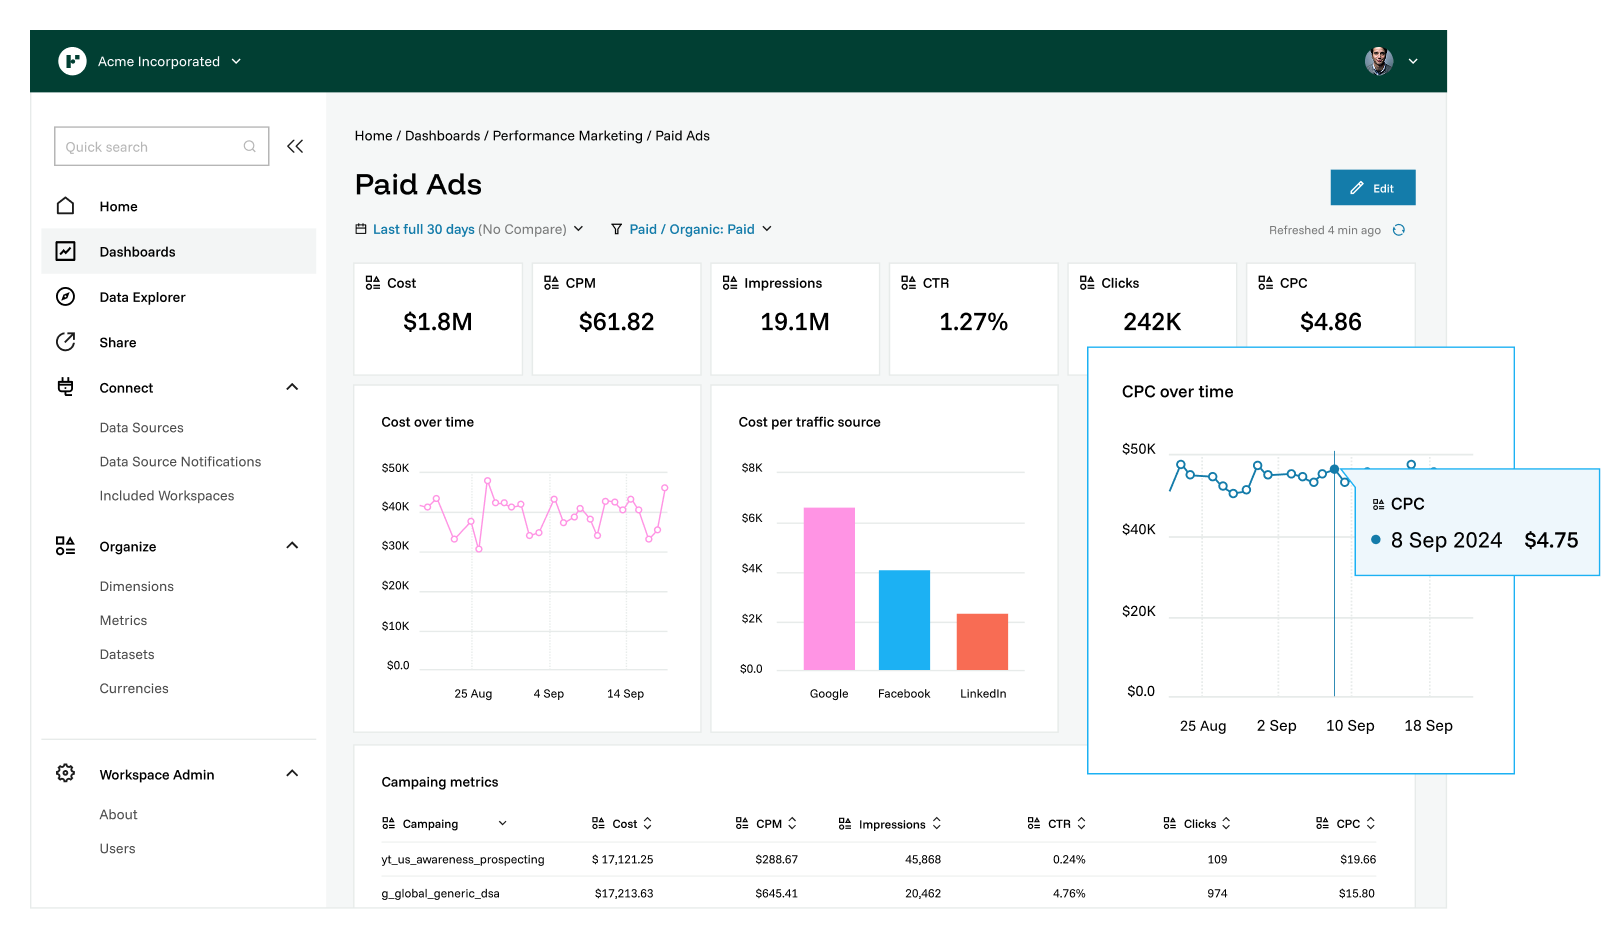
- Report with AI: Tell IQ what kind of report you want and it builds the full structure in seconds. Or go manual with drag-and-drop widgets and 80+ pre-made templates.
- Brand with AI: Upload an image or type a prompt, and IQ Themes applies matching colors, fonts, and logos to your report instantly. Reports can live on your own custom domain.
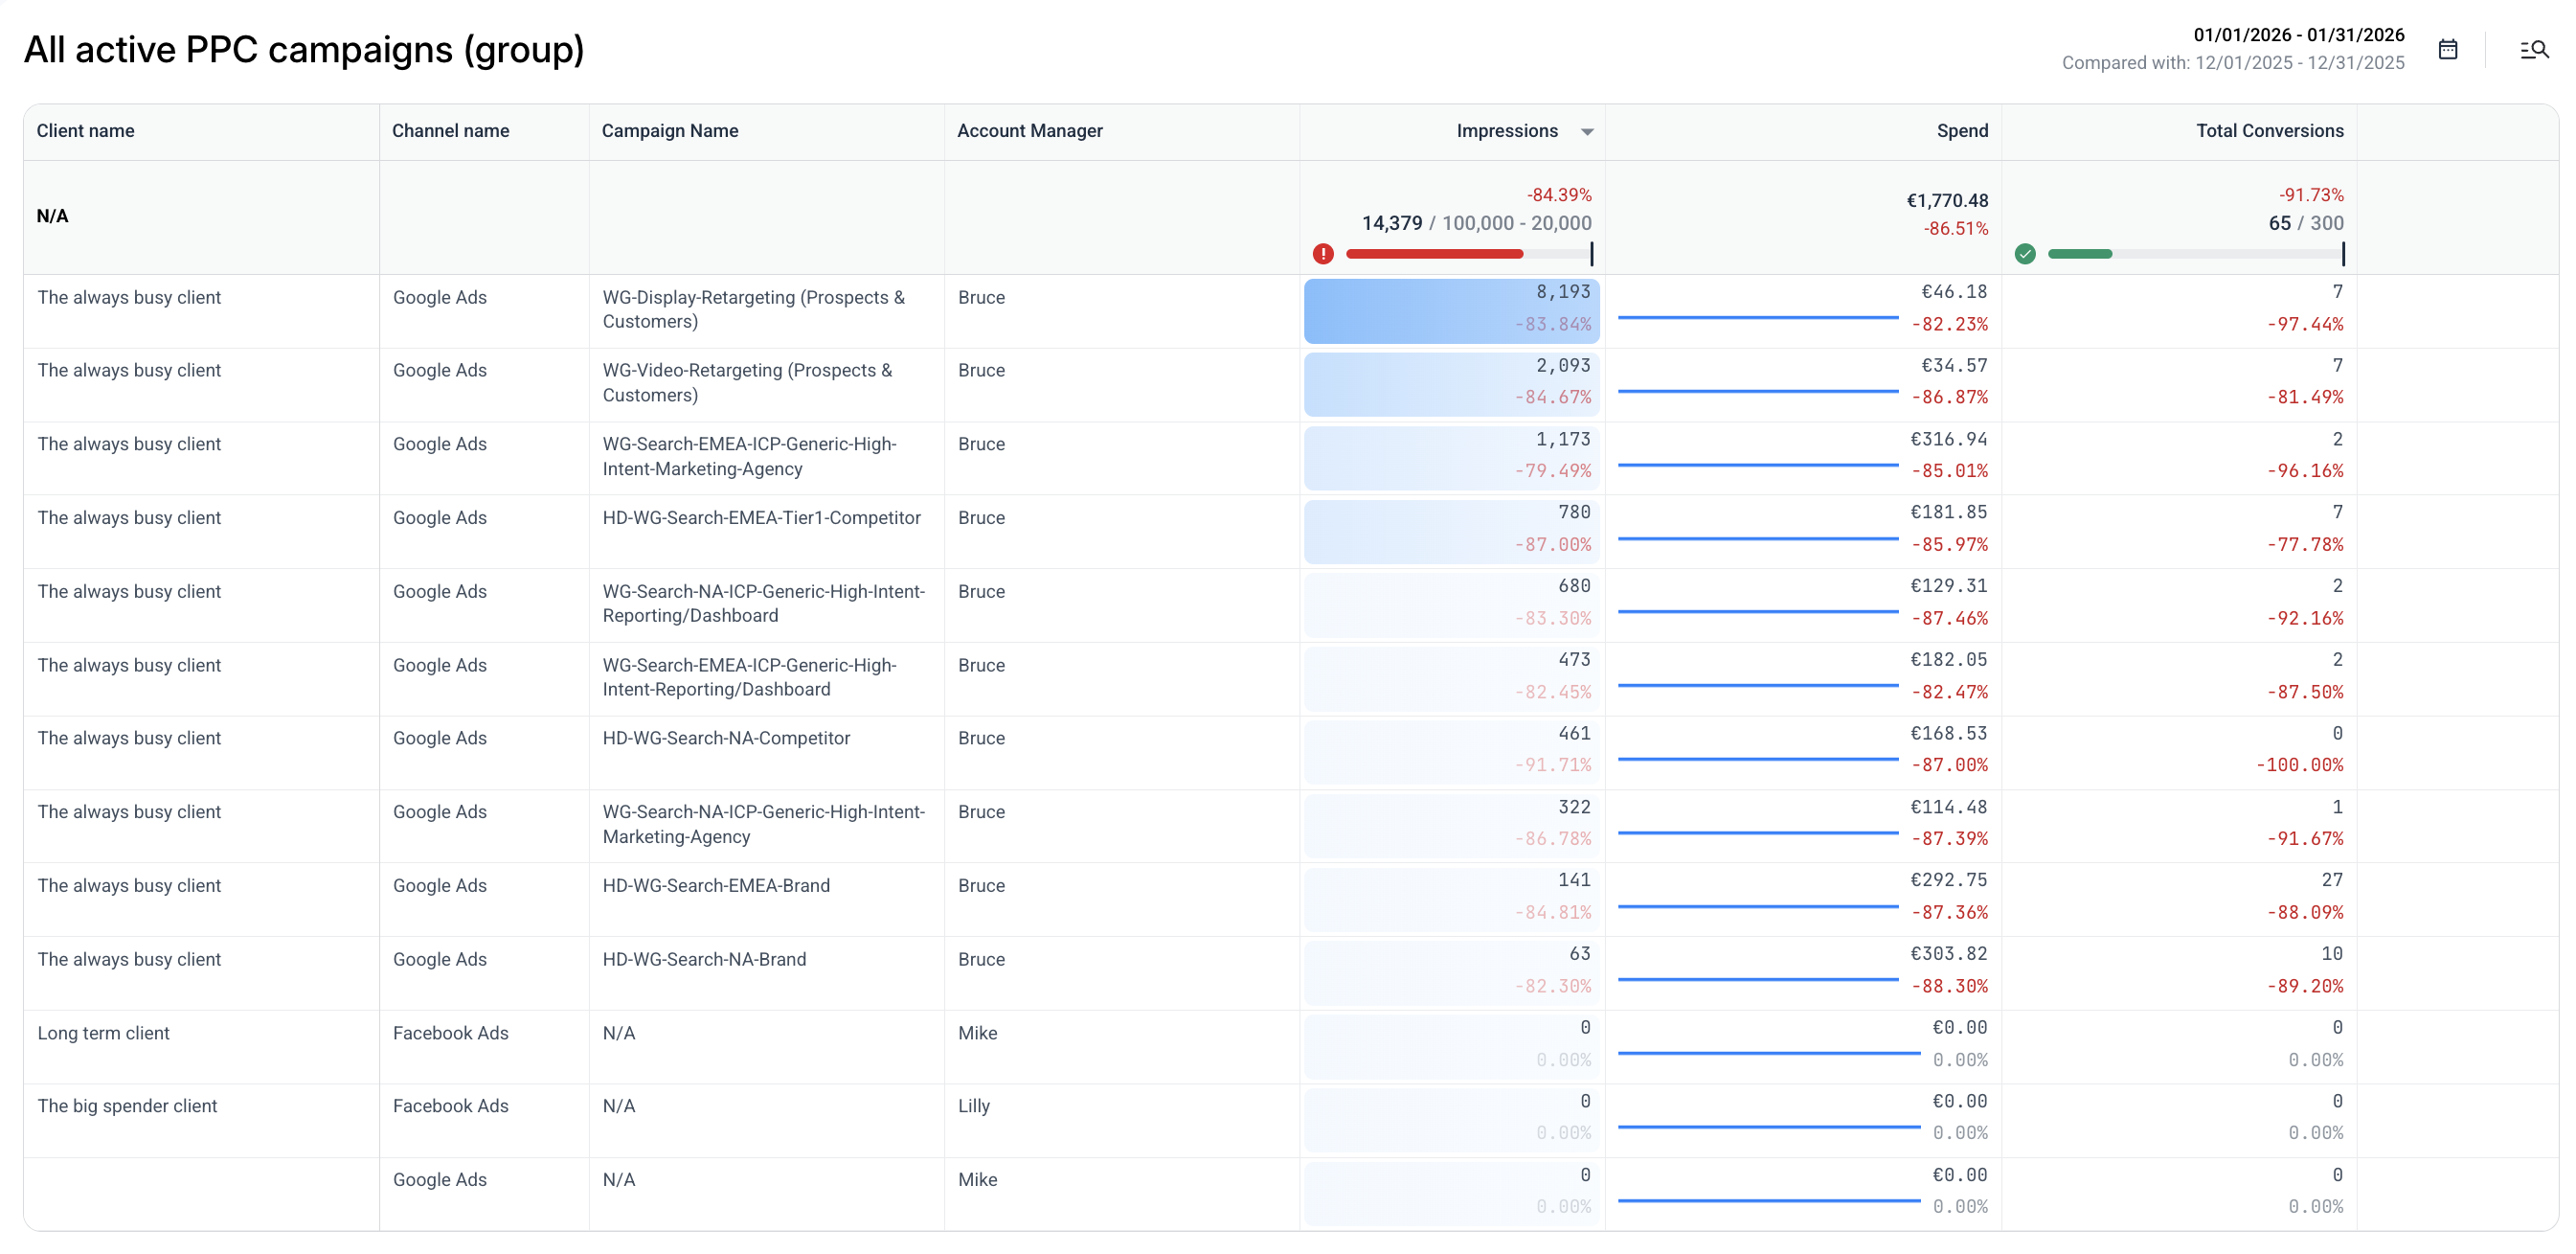
- Spot issues early: The Overview tab tracks performance across clients, countries, and brands in one place, with goals and alerts to flag what needs attention.
- Ask questions, get answers: With IQ Chat, you can ask plain-English questions directly inside any report and get instant answers from your live data. On IQ+, your clients can do the same from their shared report link.
- Share on autopilot: Send live links, PDFs, or scheduled emails, and export to Excel/CSV—or push data directly to BigQuery and Looker Studio.
- Scale: Manage dozens of clients with linked templates and client-facing filters; one update ripples across every report instantly.
Thanks to these powerful AI features and an easy-to-use interface, agencies like Maatwerk Online are saving 100 hours a month on reporting. Here’s what Lars Maat, Co-Founder, says:
Whatagraph’s AI saves time and energy for our marketing specialists. And the hours we’re saving is just pure profit. We now have the time to focus on more strategic things that help both our agency and our clients grow.
But how does Whatagraph compare against Swydo exactly? Let’s take a look:
Swydo vs. Whatagraph: Head-to-Head Comparison
Our Product team did extensive research on how Whatagraph compares against Swydo and you can find the full breakdown here.
In a nutshell, here are six key ways Whatagraph outperforms Swydo:
1. Stable and reliable platform with more integrations
Swydo currently offers 34 integrations, but these don't include popular channels like:
- Google Display & Video 360
- Ahrefs
- Amazon Advertising
- Magento
- Campaign Monitor
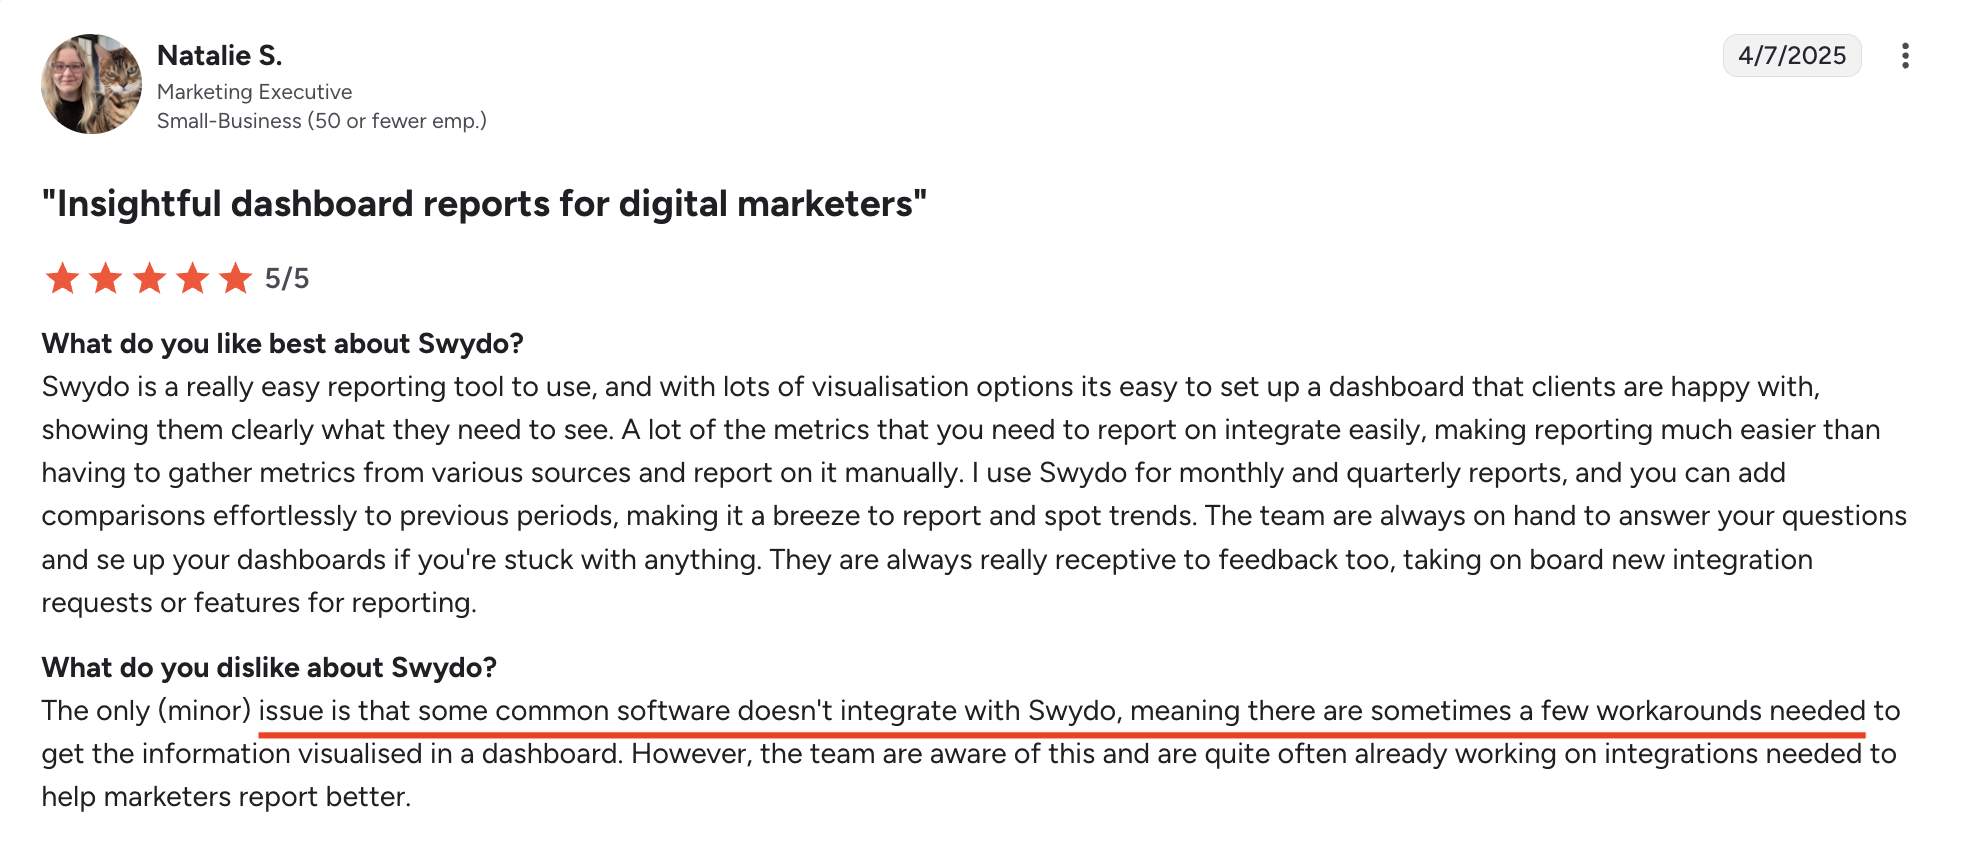
You can connect to these platforms via Google Sheets, but the set-up process can be challenging and you might need to hire a developer or use other workarounds, like this user:
In contrast, Whatagraph offers 62 out-of-the-box integrations with both popular and niche platforms. These include:
- Analytics: Google Analytics 4, Matomo, Piwik Pro
- Paid Advertising: Google Display & Video 360, Amazon Advertising, Google Ads
- Social Media: Facebook, Instagram, LinkedIn
- SEO: Ahrefs, Semrush, AccuRanker
- Ecommerce: Shopify, Magento, BigCommerce, WooCommerce
- Email Marketing: Campaign Monitor, Klaviyo, Mailchimp
Explore all integrations here.
We’re also constantly adding new integrations—please reach out to us to see if we have one you need. You can also bring in your own data via Custom API, Google Sheets, or BigQuery.
But it’s not just about how many integrations there are, but also how stable they are.
Whatagraph’s integrations are fully-managed, meaning they’re more seamless, stable, and accurate. Our product team regularly maintains them so you don't have to.
In terms of speed, you can work with 10 sources and 100 widgets at the same time on Whatagraph without slowing down the platform.
And thanks to a recent update to Google Kubernetes Engine, even reports with heavy widgets, tabs, and charts take less than 10 seconds to load on Whatagraph.
Plus, according to data from the past 6 months, Whatagraph has an average uptime of 99.95%.
All of this means:
✅ Your reports load fast.
✅ There are very few data inconsistencies or system outages.
✅ Bugs get resolved faster without having to get a third-party company involved.
Our current users love how seamless, stable, and simple the data connection process is. Here’s what one of them recently said on G2:
2. Safe and secure
Swydo's security policies are fairly sparse: they confirm GDPR compliance, HTTPS/SSL encryption, and role-based access controls, but stop there. There's no mention of ISO certification, no published uptime commitments, and very little detail on incident response or infrastructure.
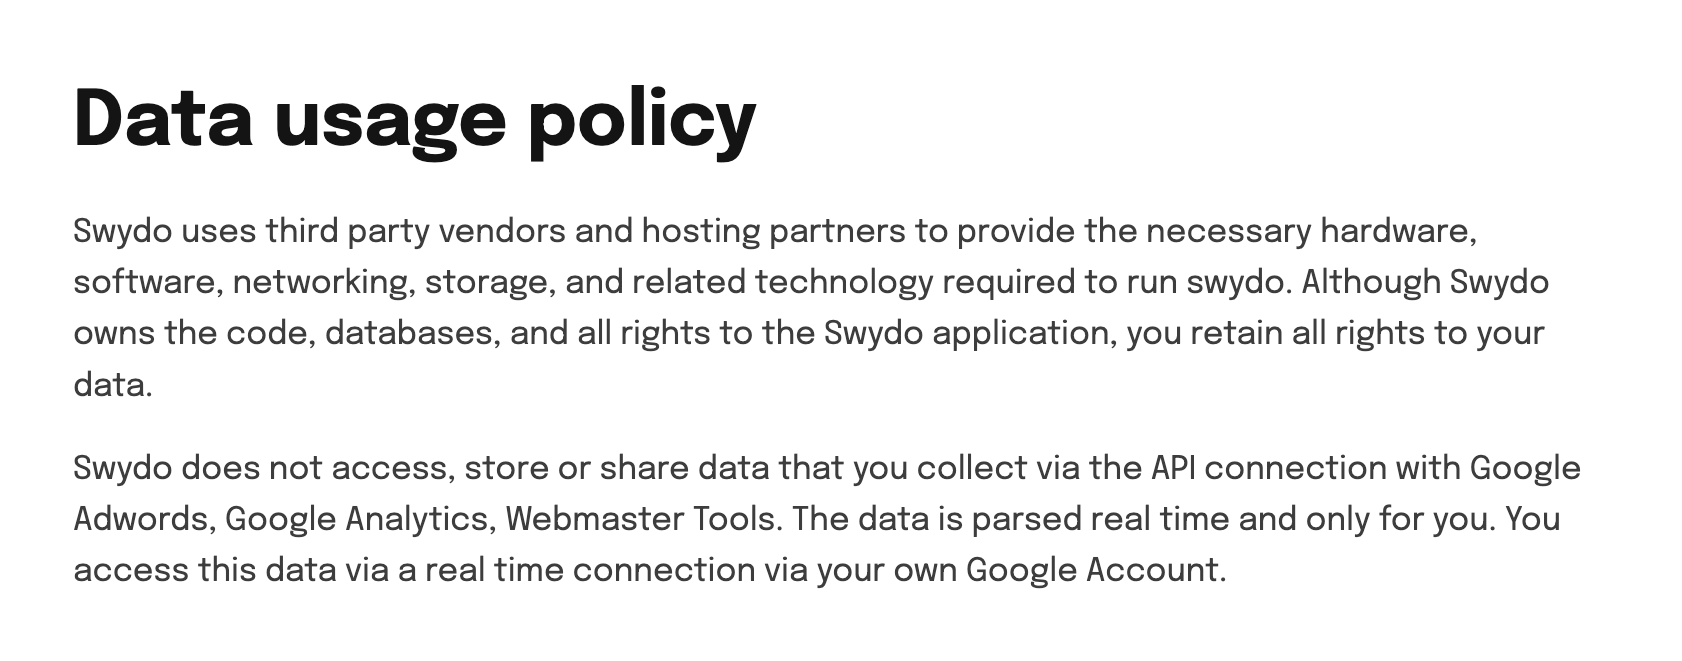
For agencies handling sensitive client data, that lack of transparency is worth noting.
At Whatagraph, data security is at the heart of everything we do. We are ISO 27001 certified and GDPR compliant.
At all times, you have control over the data Whatagraph has access to and the transactions that occur, and you can request us to delete all your personal data any time.
We've also built our systems from the ground up, adhering to the best practices in security and data protection:
- ISO 27001 certified and GDPR compliant: Your data is processed within the European Union, and any transfer to a third country is covered under GDPR rules.
- You stay in control: You can request deletion of all your personal data at any time, and Whatagraph only ever requests the minimum permissions needed to read your data, nothing more.
- Role-based access: Each employee uses a unique password with 2-step verification, and access to data is granted based on individual role and data classification. Passwords are rotated every six months.
- AES-256 encryption: All data is encrypted at rest using industry-standard AES-256.
- Backup copies: These are retained for a specified period and deleted once no longer relevant.
- Cloud infrastructure powered by GCP and AWS: Both of which hold SOC 1/2-3, PCI-DSS, and ISO 27001 certifications. Whatagraph doesn't run its own physical servers, routers, or DNS.
- TLS 1.2+ for all connections: Any HTTP attempt is automatically redirected to HTTPS. Payment processing is handled by Braintree, a PCI Level 1 certified provider. Whatagraph never touches your payment data directly.
- Network protection: This includes a VPC, firewall, IDS/IPS monitoring, a Web Application Firewall, IP filtering, and DDoS mitigation.
3. Powerful (but easy) data organization
If you have 100s of scattered data across different sources, marketing campaigns, channels, and accounts, you need a way to organize them all into unified metrics and dimensions before you visualize the data.
This helps you get a clearer view of performance and keeps your reports neat, tidy, and easy to read.
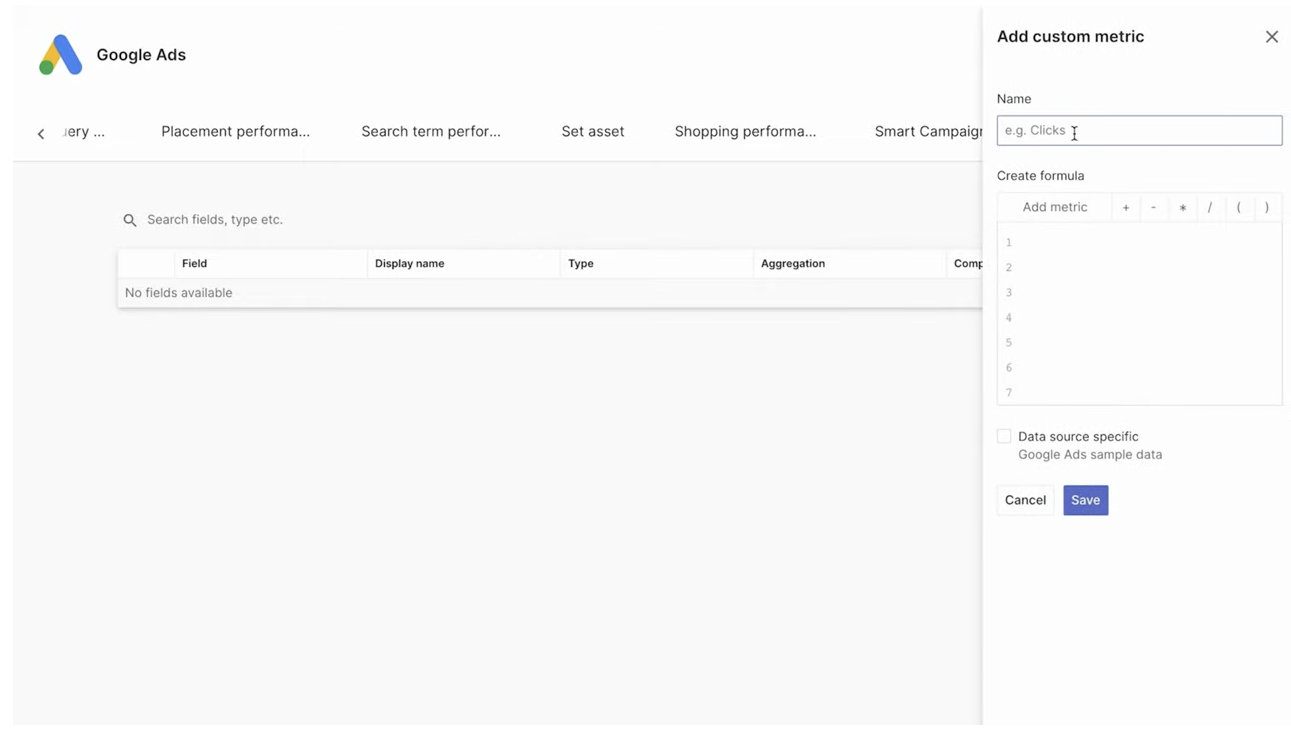
On Swydo, your options are limited. You can create custom metrics using basic formulas, and a recently added feature lets you blend data from up to five ad platforms into a single widget.
But you still can't create custom dimensions, blend across non-ad sources, or standardize naming across channels. So if you're managing complex, multi-platform client accounts, you'll hit a ceiling fast.
But what if you wanted to standardize campaign names and group similar campaigns together?
Or analyze data by specific parameters like location or client business type?
Or blend data from completely different channels like Google Analytics and Facebook Ads?
That’s where Whatagraph comes in.
On Whatagraph, you can easily create custom data blends, widgets, and dimensions through simple workflows that only take seconds to set up.
- Data blends combine data from different sources into one unified data source, so your reports stay clean and cross-channel comparisons are actually meaningful.
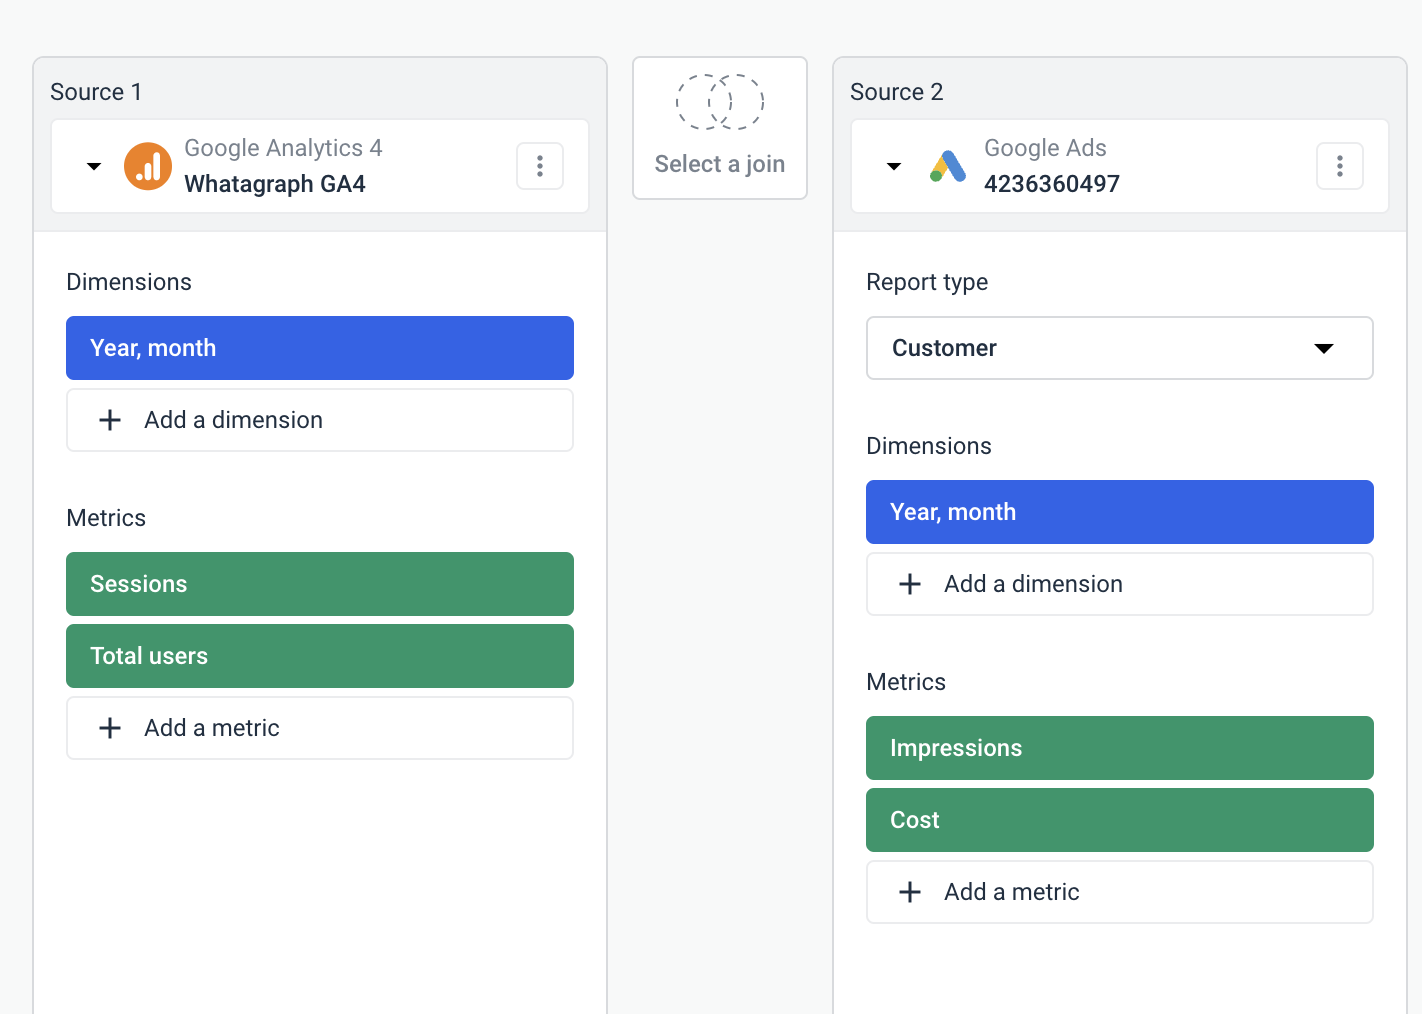
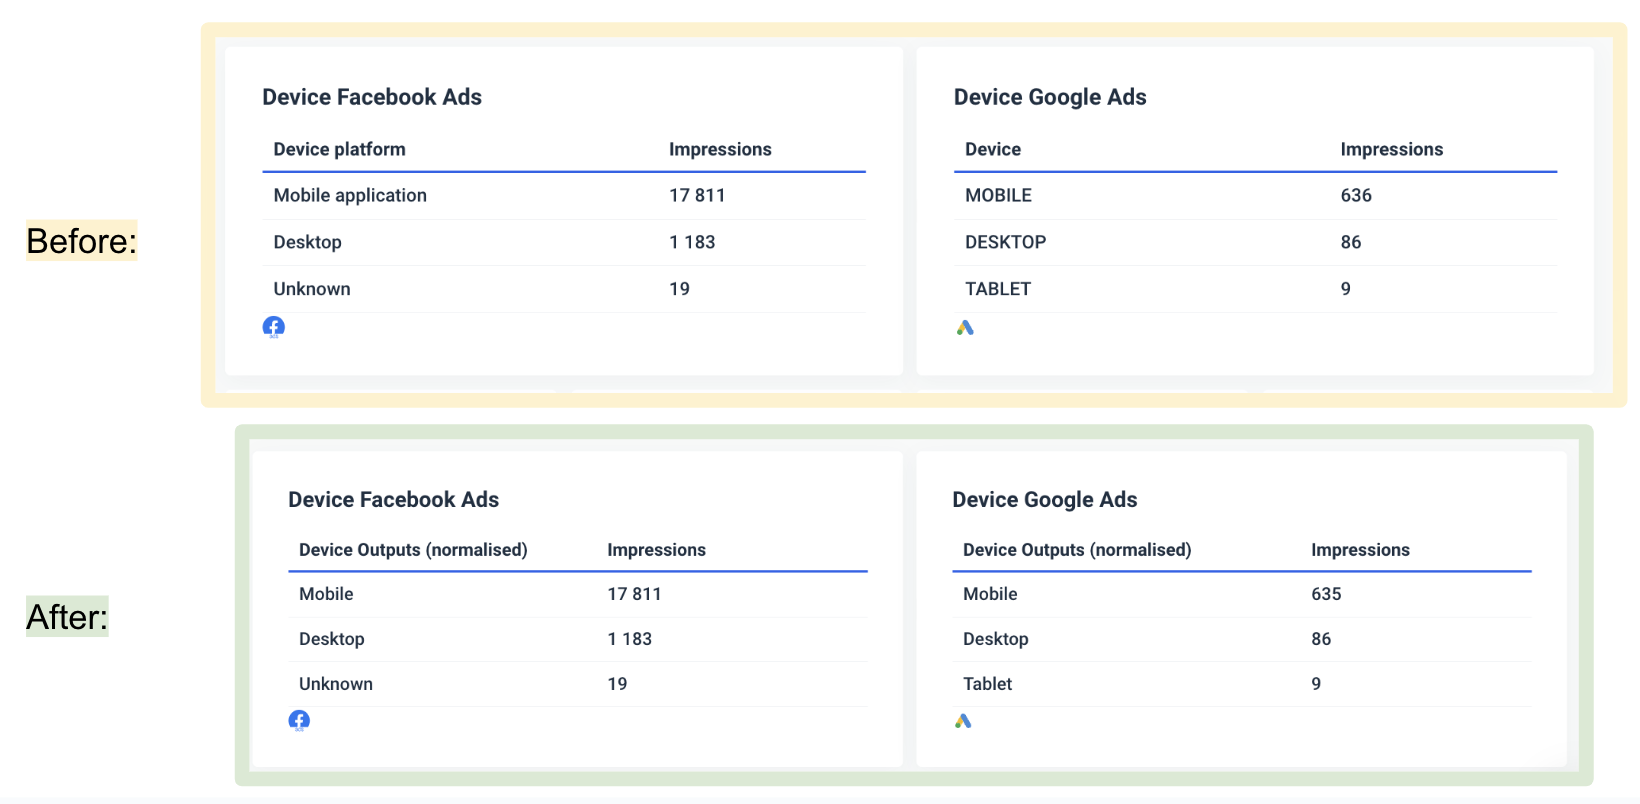
- Custom dimensions standardize naming across integrations and group data points from different platforms, so "Brand Campaign" means the same thing whether it came from Google or Meta.
- Custom metrics unify similar metrics across channels using custom formulas, without writing a line of code.
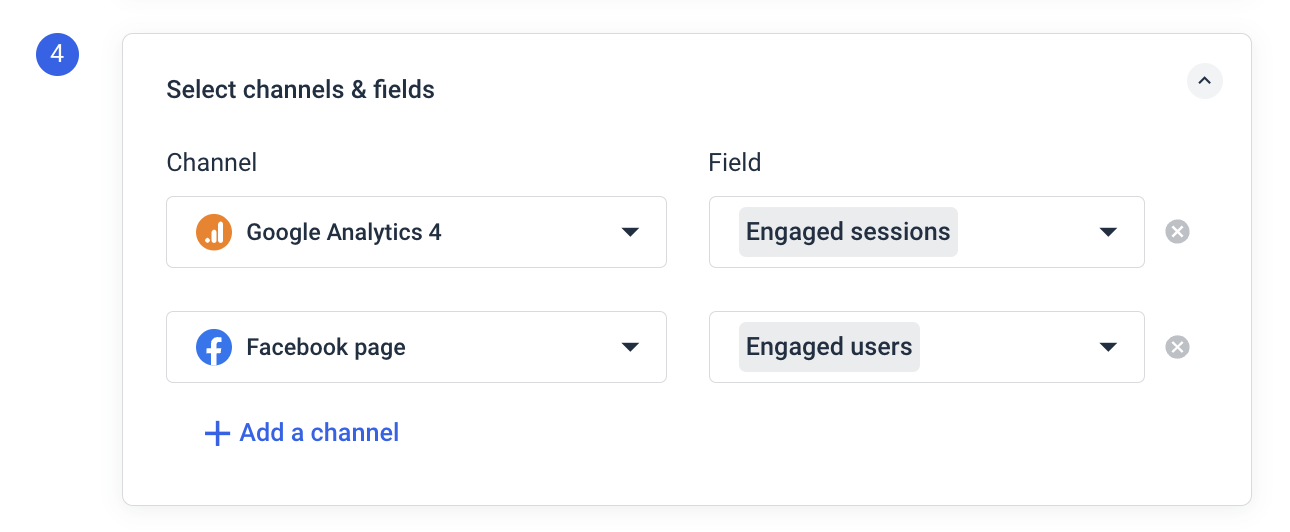
The best part is you can create all these natively inside of your report. You don’t need to waste time going back and forth from one workspace to another.
Pro tip: Whatagraph’s IQ+ can create the custom dimension for you automatically. Describe how you want to group a dimension, for example, "group these campaign names by category," and it builds it for you in real time.
Beyond individual reports, Whatagraph also gives you three tools for organizing data at scale:
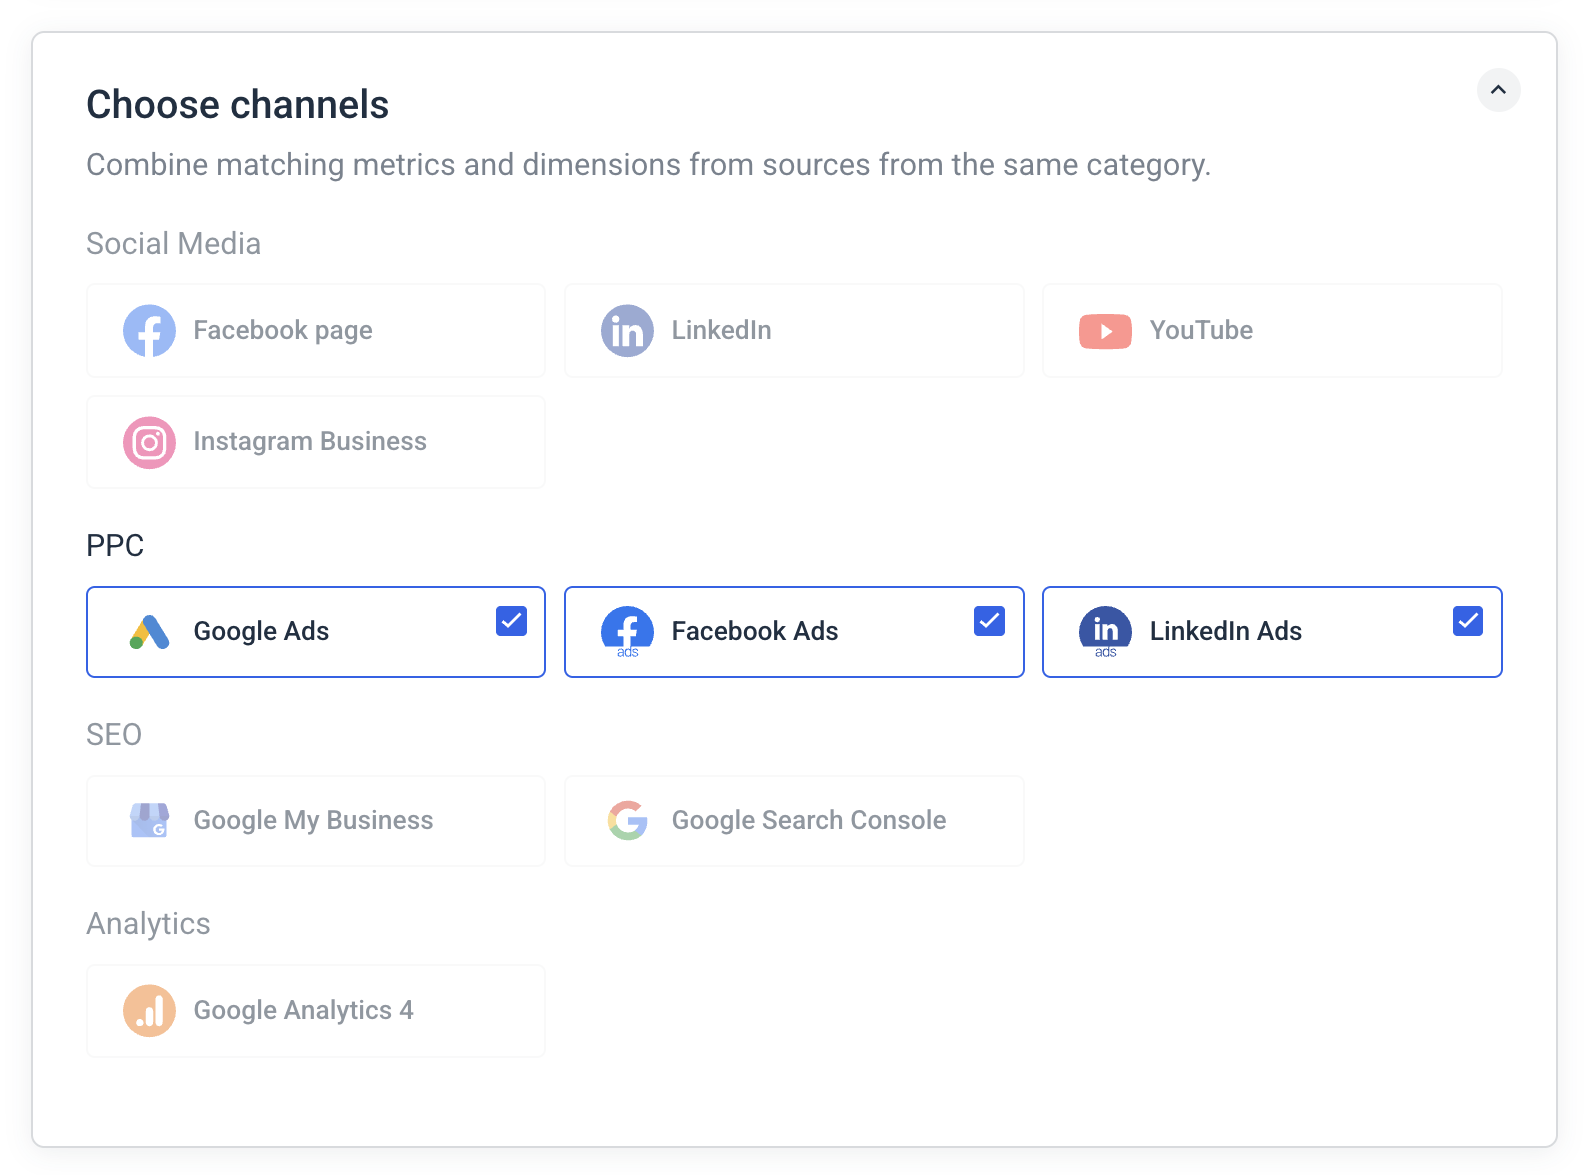
- Source Groups combine metrics from multiple sources, even across different channels into a single unified view in seconds. Need to see SEO performance across Google Search Console and Ahrefs together? One workflow, done.
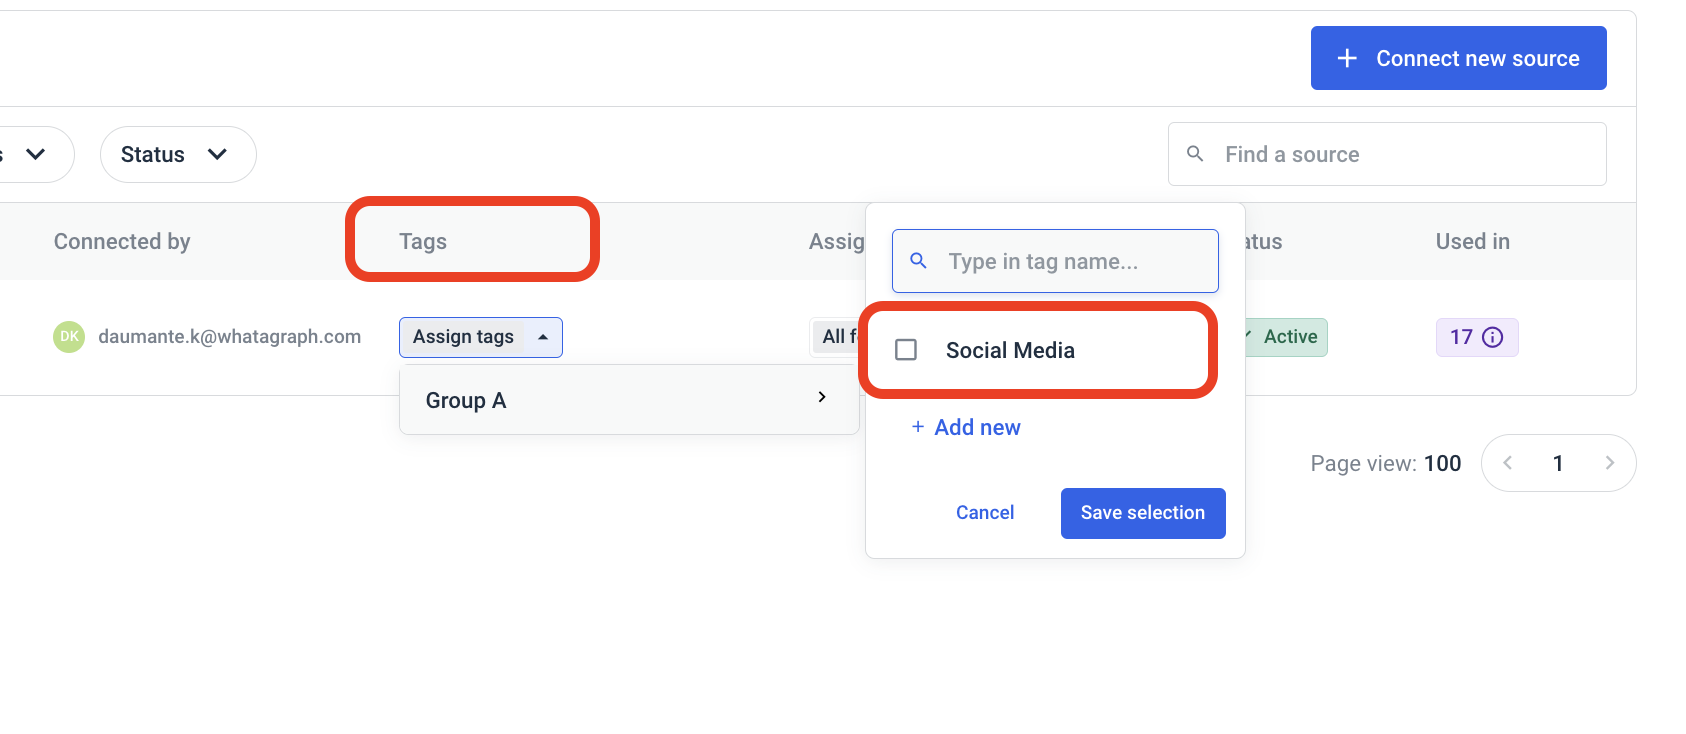
- Custom Tags add custom attributes to your data sources and filter by client industry, region, account manager, or whatever else your team tracks. Assign a new account manager's tag and instantly see only their clients' performance.
- Overview visualizes all your key metrics in one place. Set goals and alerts so you know exactly when something needs attention.
Powerful and easy data organization on Whatagraph means:
✅ Your reports are easier to read, neat, and tidy.
✅ Your clients clearly see the value you’re delivering rather than being stuck interpreting data.
✅ You can analyze and compare performance any way you want, and use these insights to deliver better results for clients.
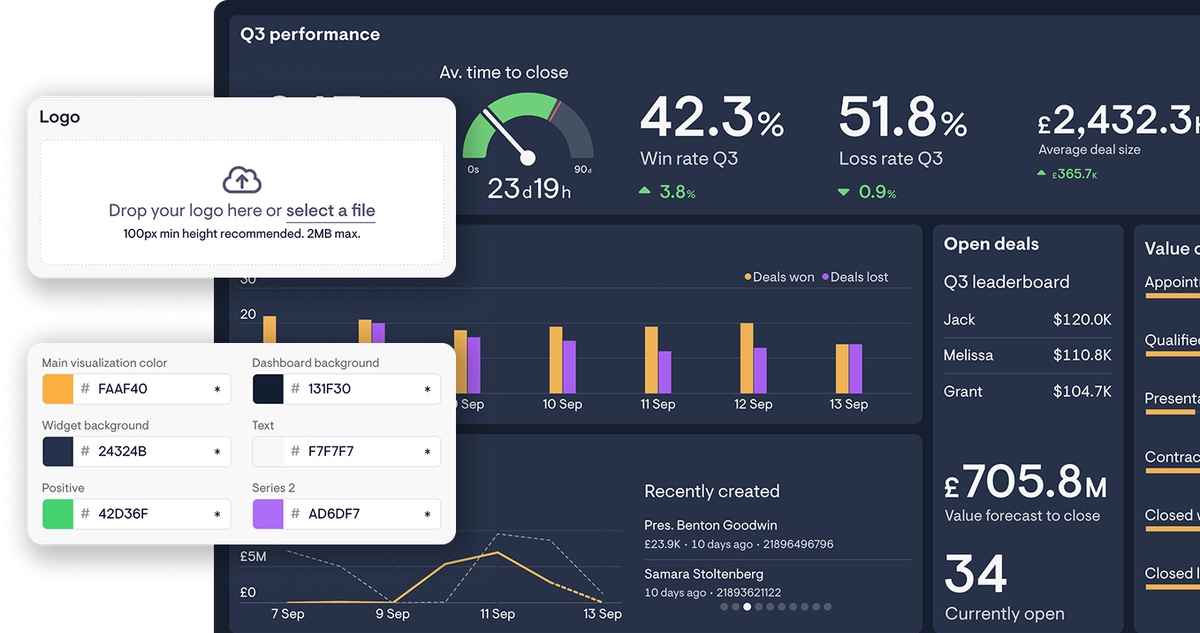
4. More customization options for reports
While Swydo's reports are clean and easy to read, widget-level customization is limited. Users consistently describe the interface as "aesthetically simple": and that shows up in a few specific places:
❌ You can't add icons to widgets.
❌ Table formatting controls are limited; adjusting individual column widths inside data tables isn't supported.
❌ Customization options for chart display and widget appearance are narrow compared to more design-forward platforms.
In fact, this is what one user said:
 In comparison, Whatagraph’s reports are highly dynamic and customizable.
You have three ways to build:
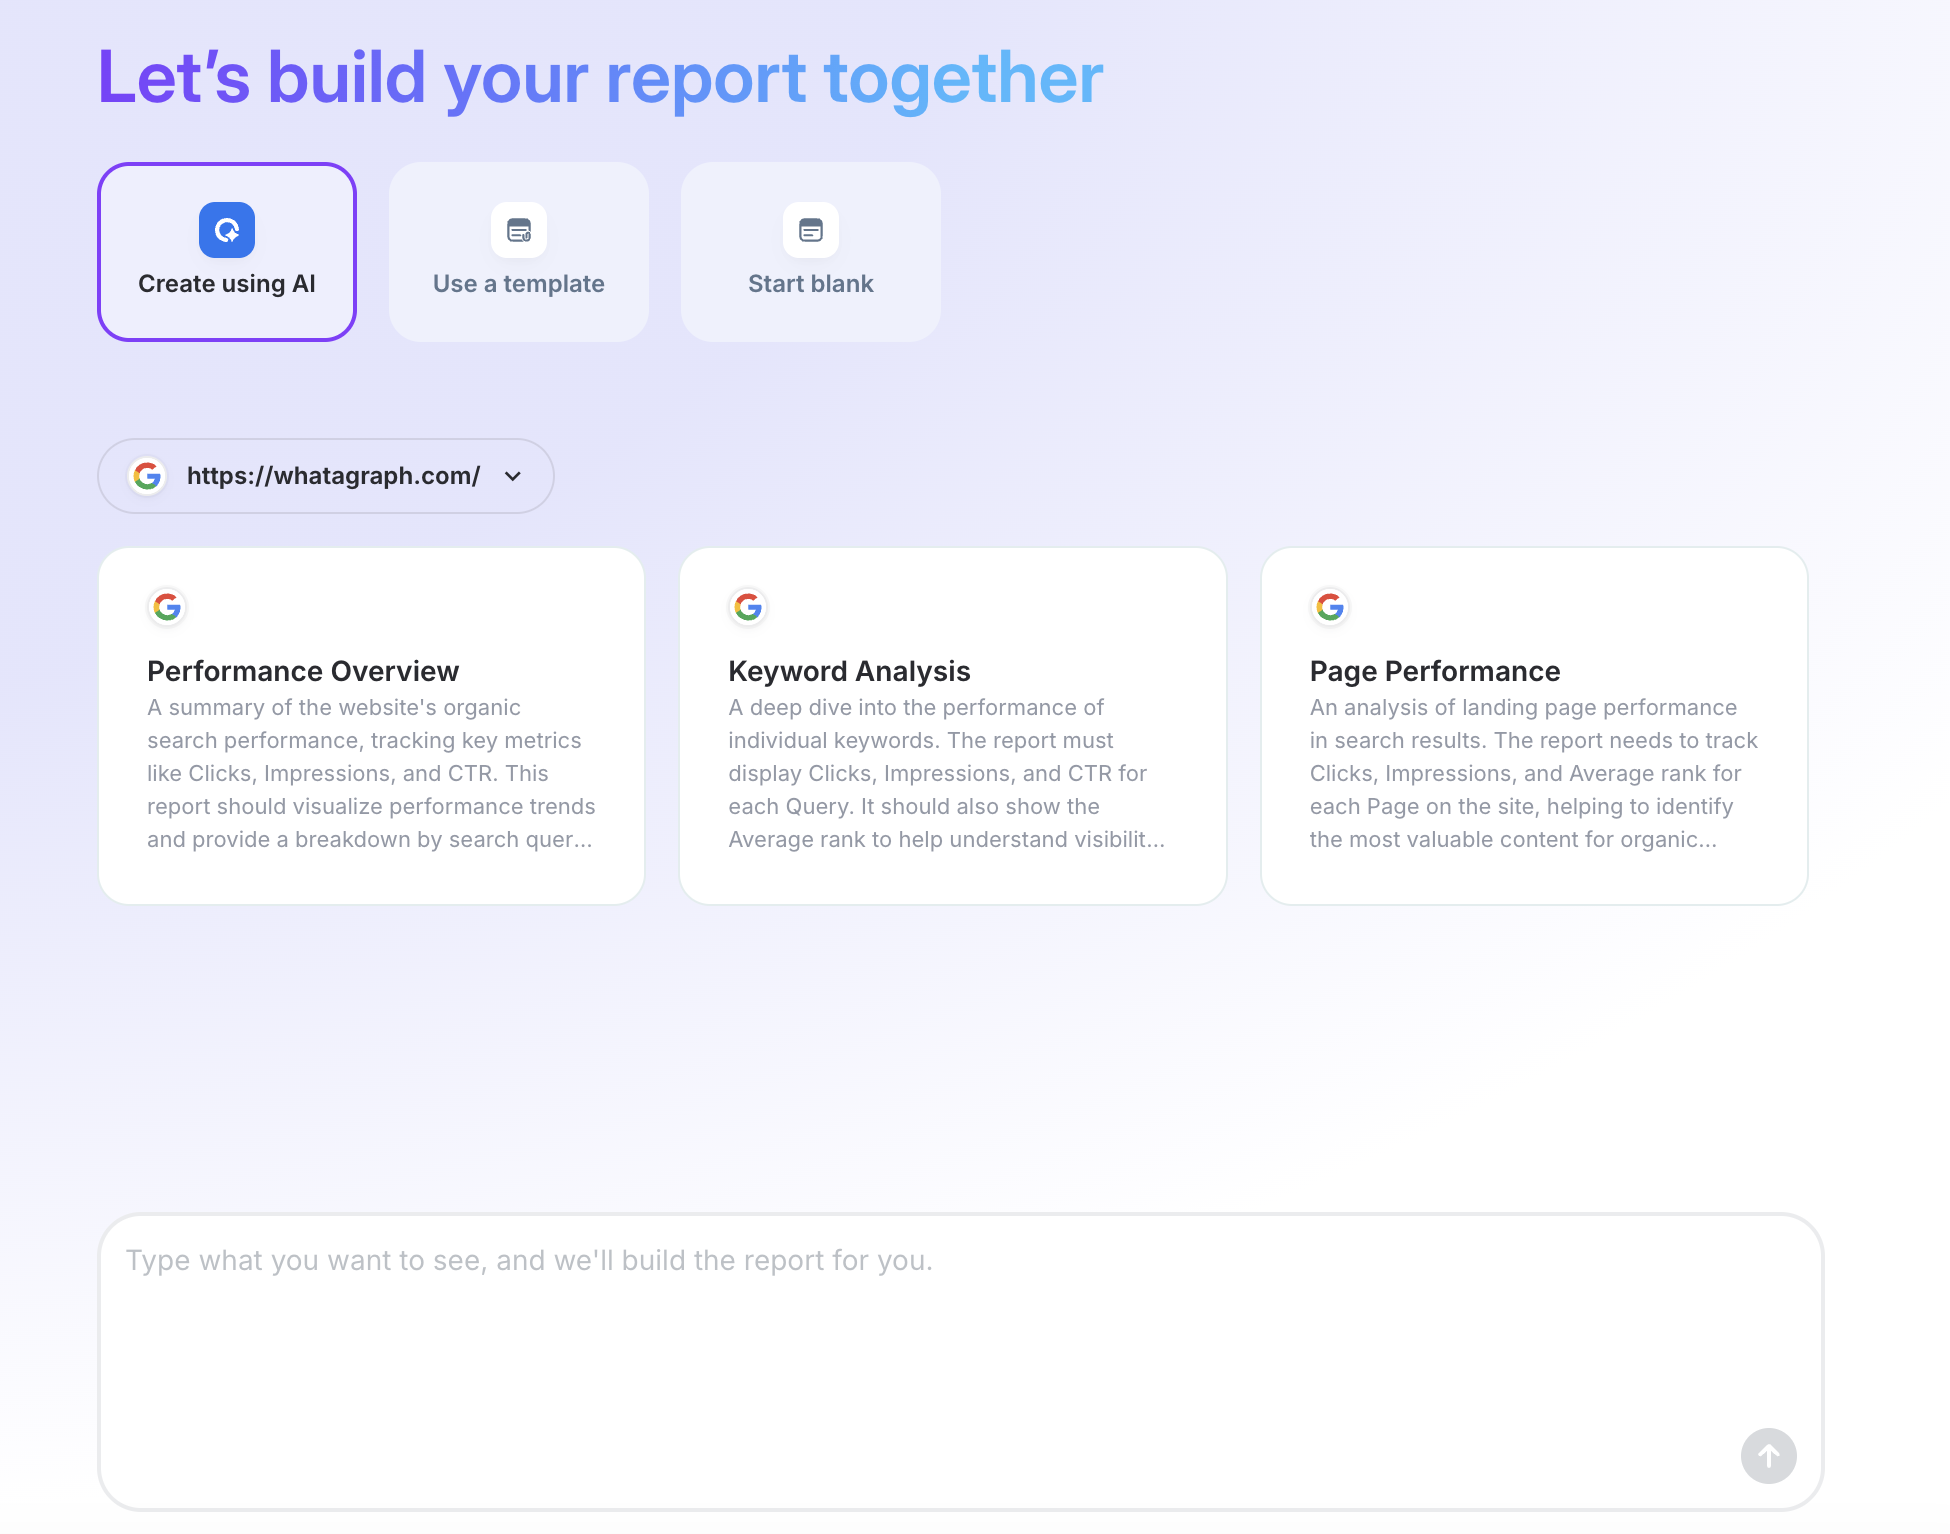
1. Build a report using AI: Hit Create using AI, select your data source, type a prompt or pick from the smart suggestions, and IQ generates a fully visualized, multi-widget report in under 30 seconds. You can then click into any widget and edit it in plain language without rebuilding from scratch. Need a new widget? Draw a box on the grid and describe what you want—IQ builds it on the spot.
2. Choose from 80+ templates: Pick a pre-built template for your channel or campaign type, plug in your accounts, and you're reporting in minutes.
3. Start blank and drag-and-drop: Build from scratch with full control over widget size, position, layout, and design. Resize, reorder, and arrange everything exactly how you want it.
Whichever path you take, the branding layer is the same: add your logo, brand colors, custom fonts, and set up a branded subdomain so reports live at “reports.youragency.com” rather than “app.whatagraph.com.”
IQ Themes takes this further: upload your logo or type a prompt, and IQ generates a matching color palette and visual theme for the entire report automatically.
When it comes to adding metrics, you can do so in five different ways:
- Start with AI: Type a prompt describing what you want to see, pick from the smart suggestions, and Whatagraph IQ builds the full widget for you. You can then click into any widget and refine it in natural language without rebuilding from scratch.
- Drag-and-drop pre-made widgets: The fastest manual option for new users. Just pick a widget from the library and drop it onto your dashboard. Pre-made widgets are fully customizable after the fact, so you're not locked into defaults.
- Build custom widgets from scratch: If you need something the pre-made library doesn't cover, build your own using the available widget elements and apply custom formulas, data blends, and your own metric names.
- Use widget templates: Start from a pre-built template for your channel or use case, then adjust the metrics to fit your client's needs.
- Add offline data: Manually enter data from sources that don't have a native integration using Whatagraph's offline data widgets; useful for things like offline conversions or custom KPIs.
You can also easily change currency displays, add or hide footers, and customize the colors of each widget—right from your dashboard. No need to jump back and forth from one workspace to another.
Whatagraph also comes with thoughtful design features that make your user experience smooth as butter. You can:
✅ Link reports together and edit in bulk, instead of one by one.
✅ Add different “tabs” to one report to show performance for each channel or campaign.
✅ Change the size and position of your widgets any way you want.
✅ Insert or delete rows anywhere on your report.
✅ Change your report orientation as Portrait or Landscape.
✨ We covered a lot of customization options but these are just the tip of the iceberg of what you can do with Whatagraph. If you’d like to learn more, book a call with us and we’ll show you exactly how we can help.
5. AI chatbot and summaries
Swydo now has Swydo AI, launched in late 2025, and it covers the core use case well enough. You can generate a report summary, ask questions about your data, check performance against goals, and do all of this in multiple languages.
For a lean paid media team, that may be enough.
But look out for these gaps if you’re an agency managing multiple clients at scale:
- Swydo AI works within a single open report and runs on a monthly credit allowance—your team gets 4,000 credits per month, with an average summary consuming around 95. Once you're through them, you're paying extra or waiting for the reset.
- There's also no AI available on client-facing shared report links, which means clients still can't self-serve answers from their own data.
Whatagraph IQ is built differently to save you up to 100+ hours per month:
- IQ Chat works across your entire data stack: Ask a cross-client or cross-channel question and IQ pulls from wherever the answer lives, without you having to navigate to it first.
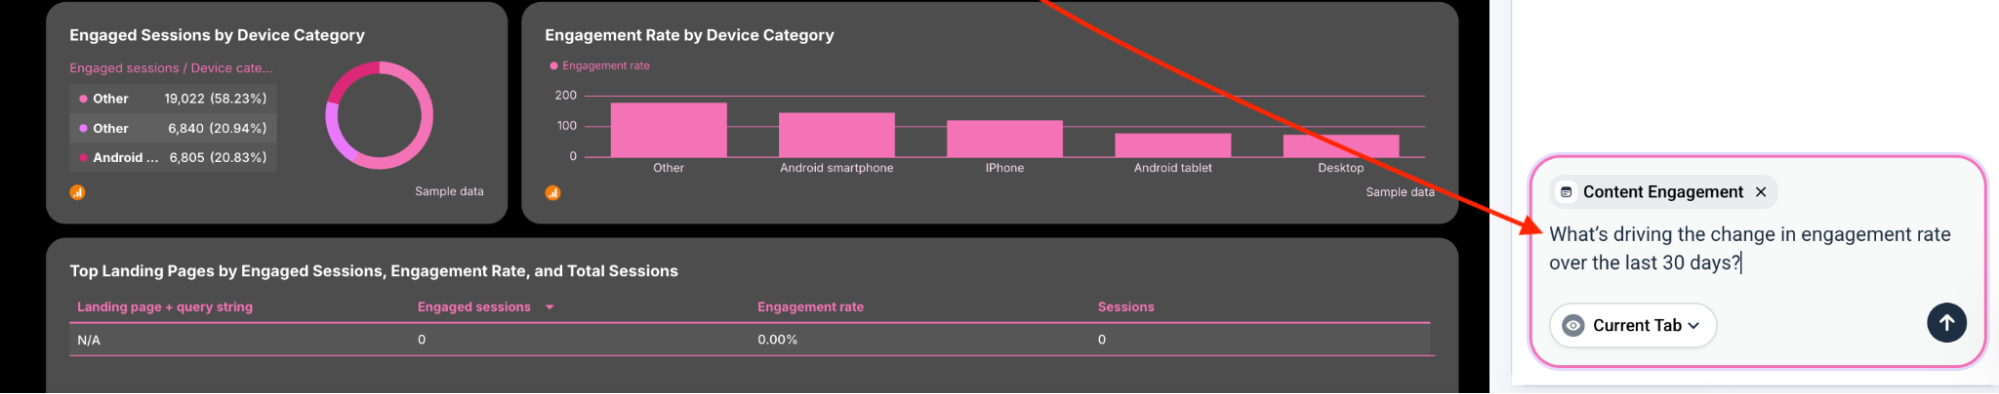
- IQ+ summaries stay current automatically: Change the date range on a report and the written commentary rewrites itself to match. Swydo has no equivalent; summaries are static once generated.
- Clients can chat with their own data: When you share a Whatagraph report via live link, you can enable IQ Chat for the recipient. Clients get a branded AI chat interface directly inside the report to ask their own questions without pinging you. Swydo AI is not available on shared links.
- No credit limits: Whatagraph IQ is included on every plan without a usage meter ticking down in the background.
Power users like Ben Goodey, Founder of Spicy Margarita, use IQ Chat live in client meetings — asking things like "give me a performance report on traffic and leads coming from ChatGPT over time" and getting accurate answers straight from his GA4 data, on the spot, without having to prep anything in advance.
Take a look at how Ben is using Whatagraph for ChatGPT traffic reporting:
6. Share your data and reports anyway you want
Swydo covers the reporting delivery basics: you can share a live report link, send automated scheduled emails, and download PDF reports. That's the full scope, there are no data export options and no way to push your data into a warehouse or BI tool.
For agencies whose workflow lives entirely inside reports and PDFs, that may be fine. But if anyone on your team or your client's side needs the raw data elsewhere, you're stuck.
Whatagraph gives you considerably more flexibility on where your data goes:
- For client-facing delivery: Share reports as live links (password-protectable), send automated emails on whatever schedule you set, or export to PDF or Excel/CSV for stakeholders who want a file.
- For internal teams: Push insights directly into Slack or Notion so your team gets performance updates where they already work.
- For data and BI teams: Transfer your marketing data directly to BigQuery for warehouse storage and complex analytics, or pipe it into Looker Studio for visualization. Pick metrics and dimensions you want to transfer, preview your future table, and start an automated transfer.
7. Straightforward pricing
Swydo runs on a single all-inclusive plan, and to its credit, it genuinely does include everything: unlimited users, unlimited reports, AI summaries, white-labeling, onboarding, and email/chat support, all from day one.
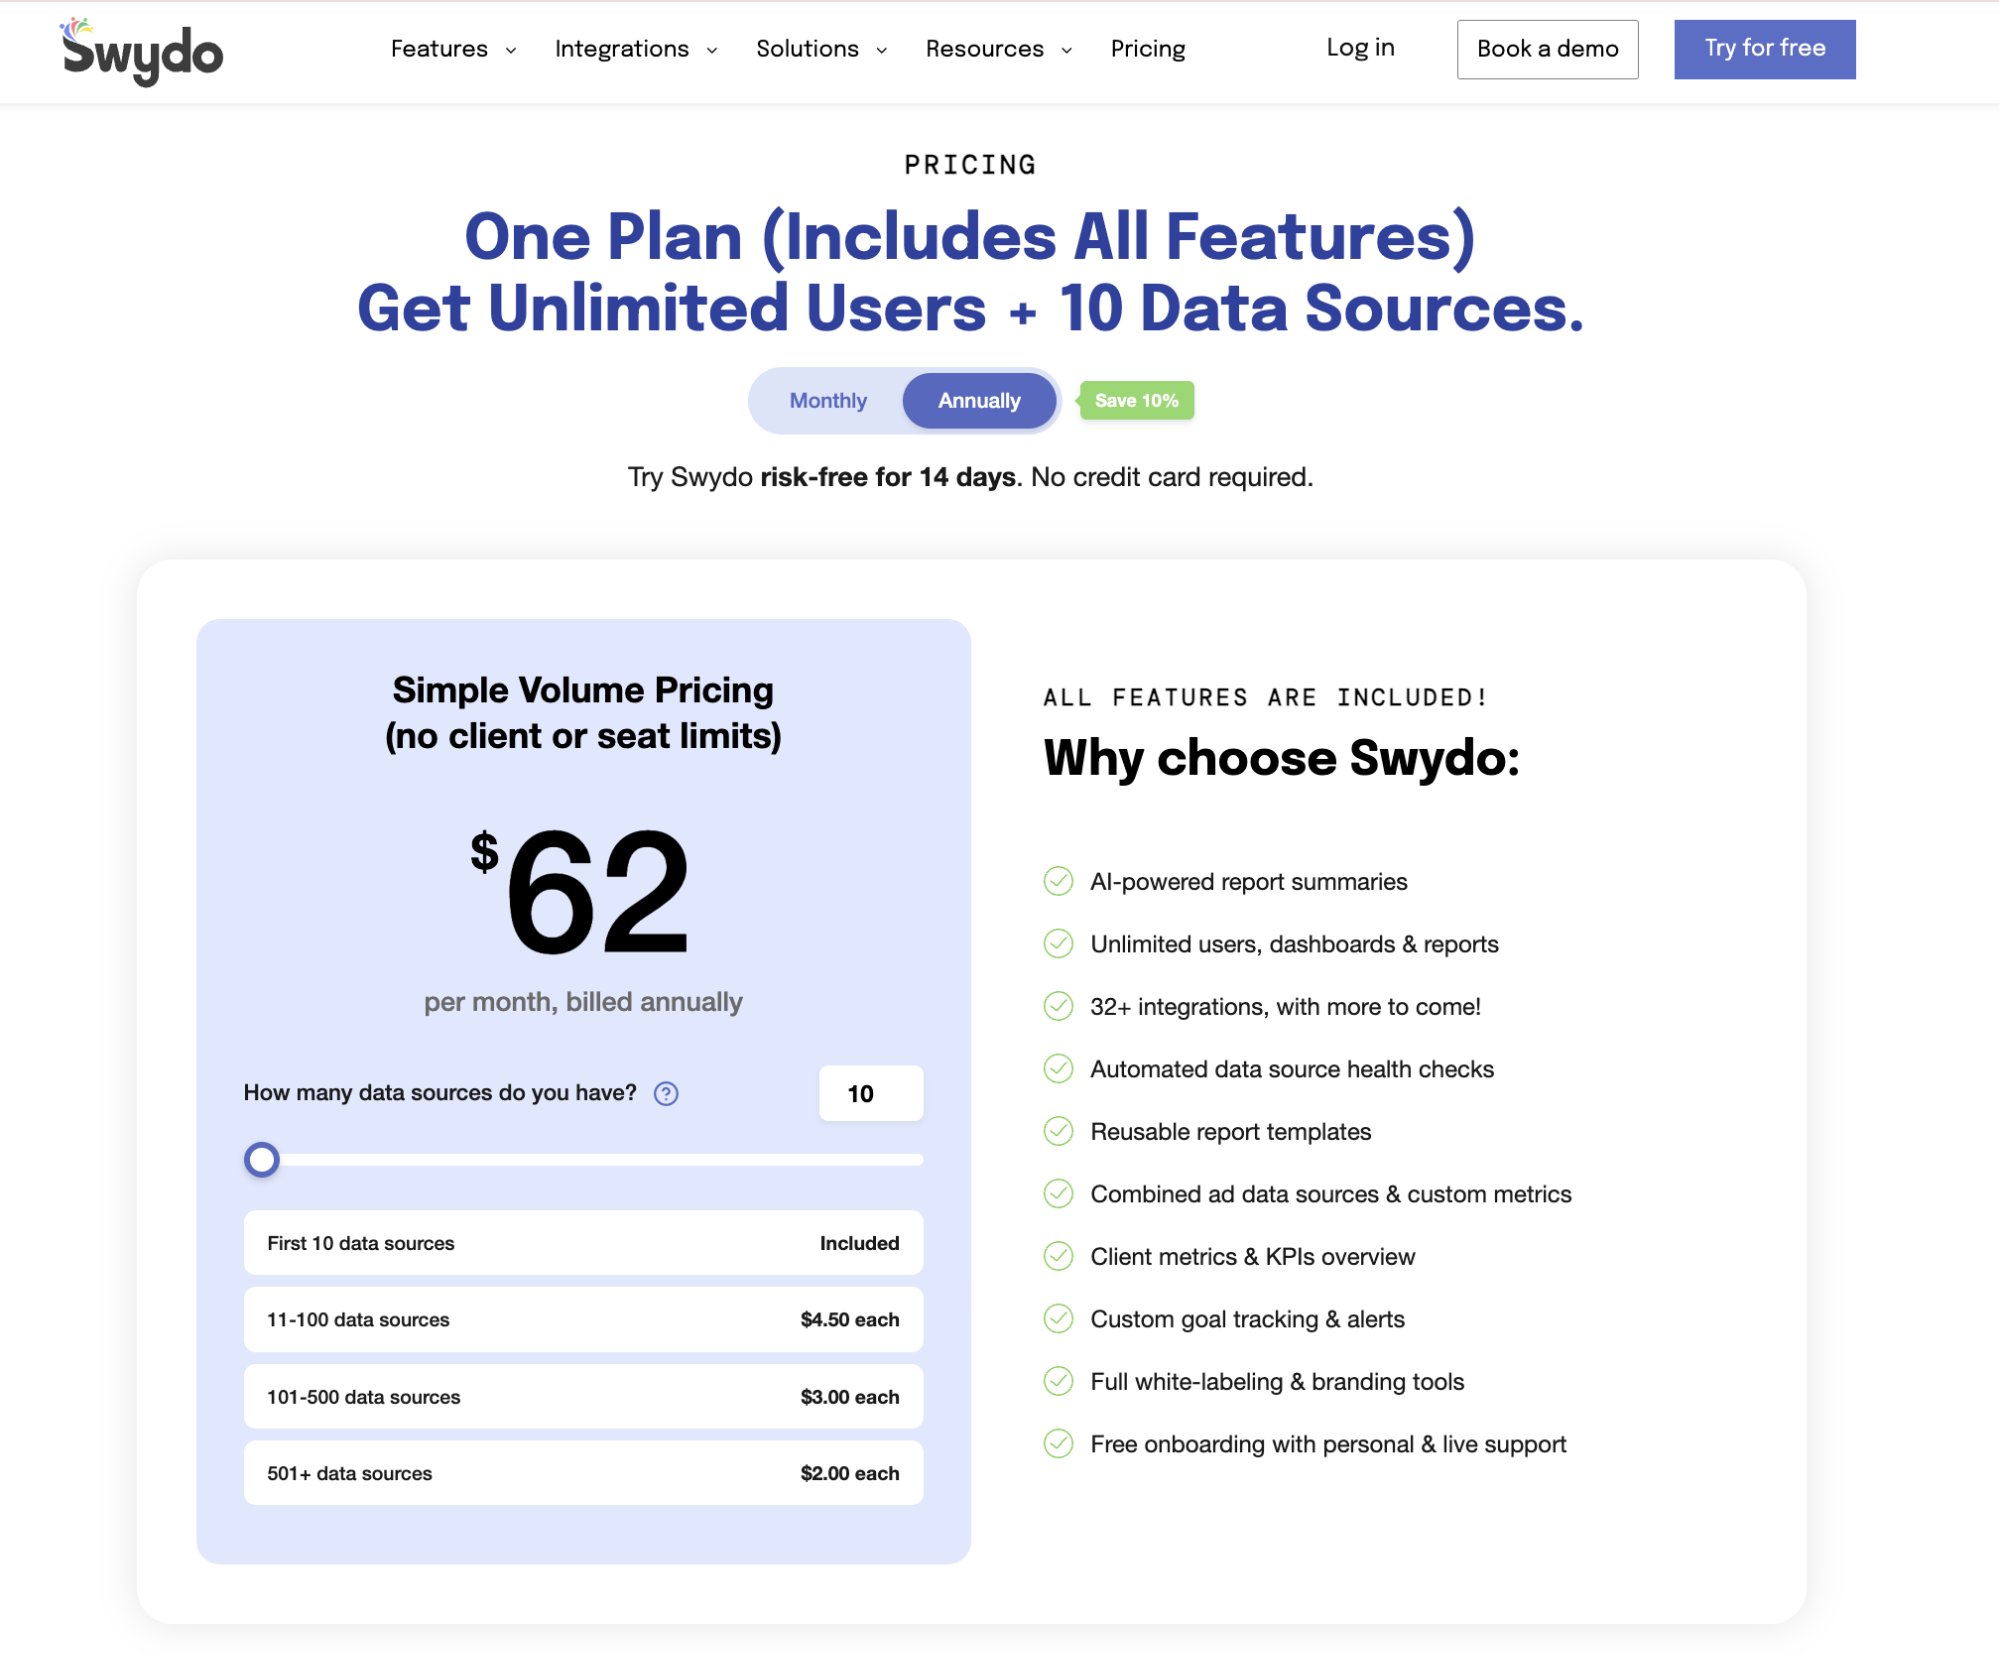
The variable is data sources:
- The base plan starts at $62/month (billed annually) and covers 10 data sources.
- Beyond that, you pay per source on a sliding scale: $4.50 each for sources 11-100, $3.00 each for 101-500, and $2.00 each for 501 and above.
For a lean team reporting on a handful of clients, this is fine. For agencies managing dozens of clients across multiple channels, the bill climbs fast—and you'll need to actively monitor and deactivate unused sources to avoid paying for connections you're not using.
There's also no dedicated Customer Success Manager. Support comes via email, chat, and a Customer Success Specialist who can review your account, but there's no ongoing strategic partner built into any plan.
Read our in-depth, honest review of whether or not Swydo is worth it in 2026.
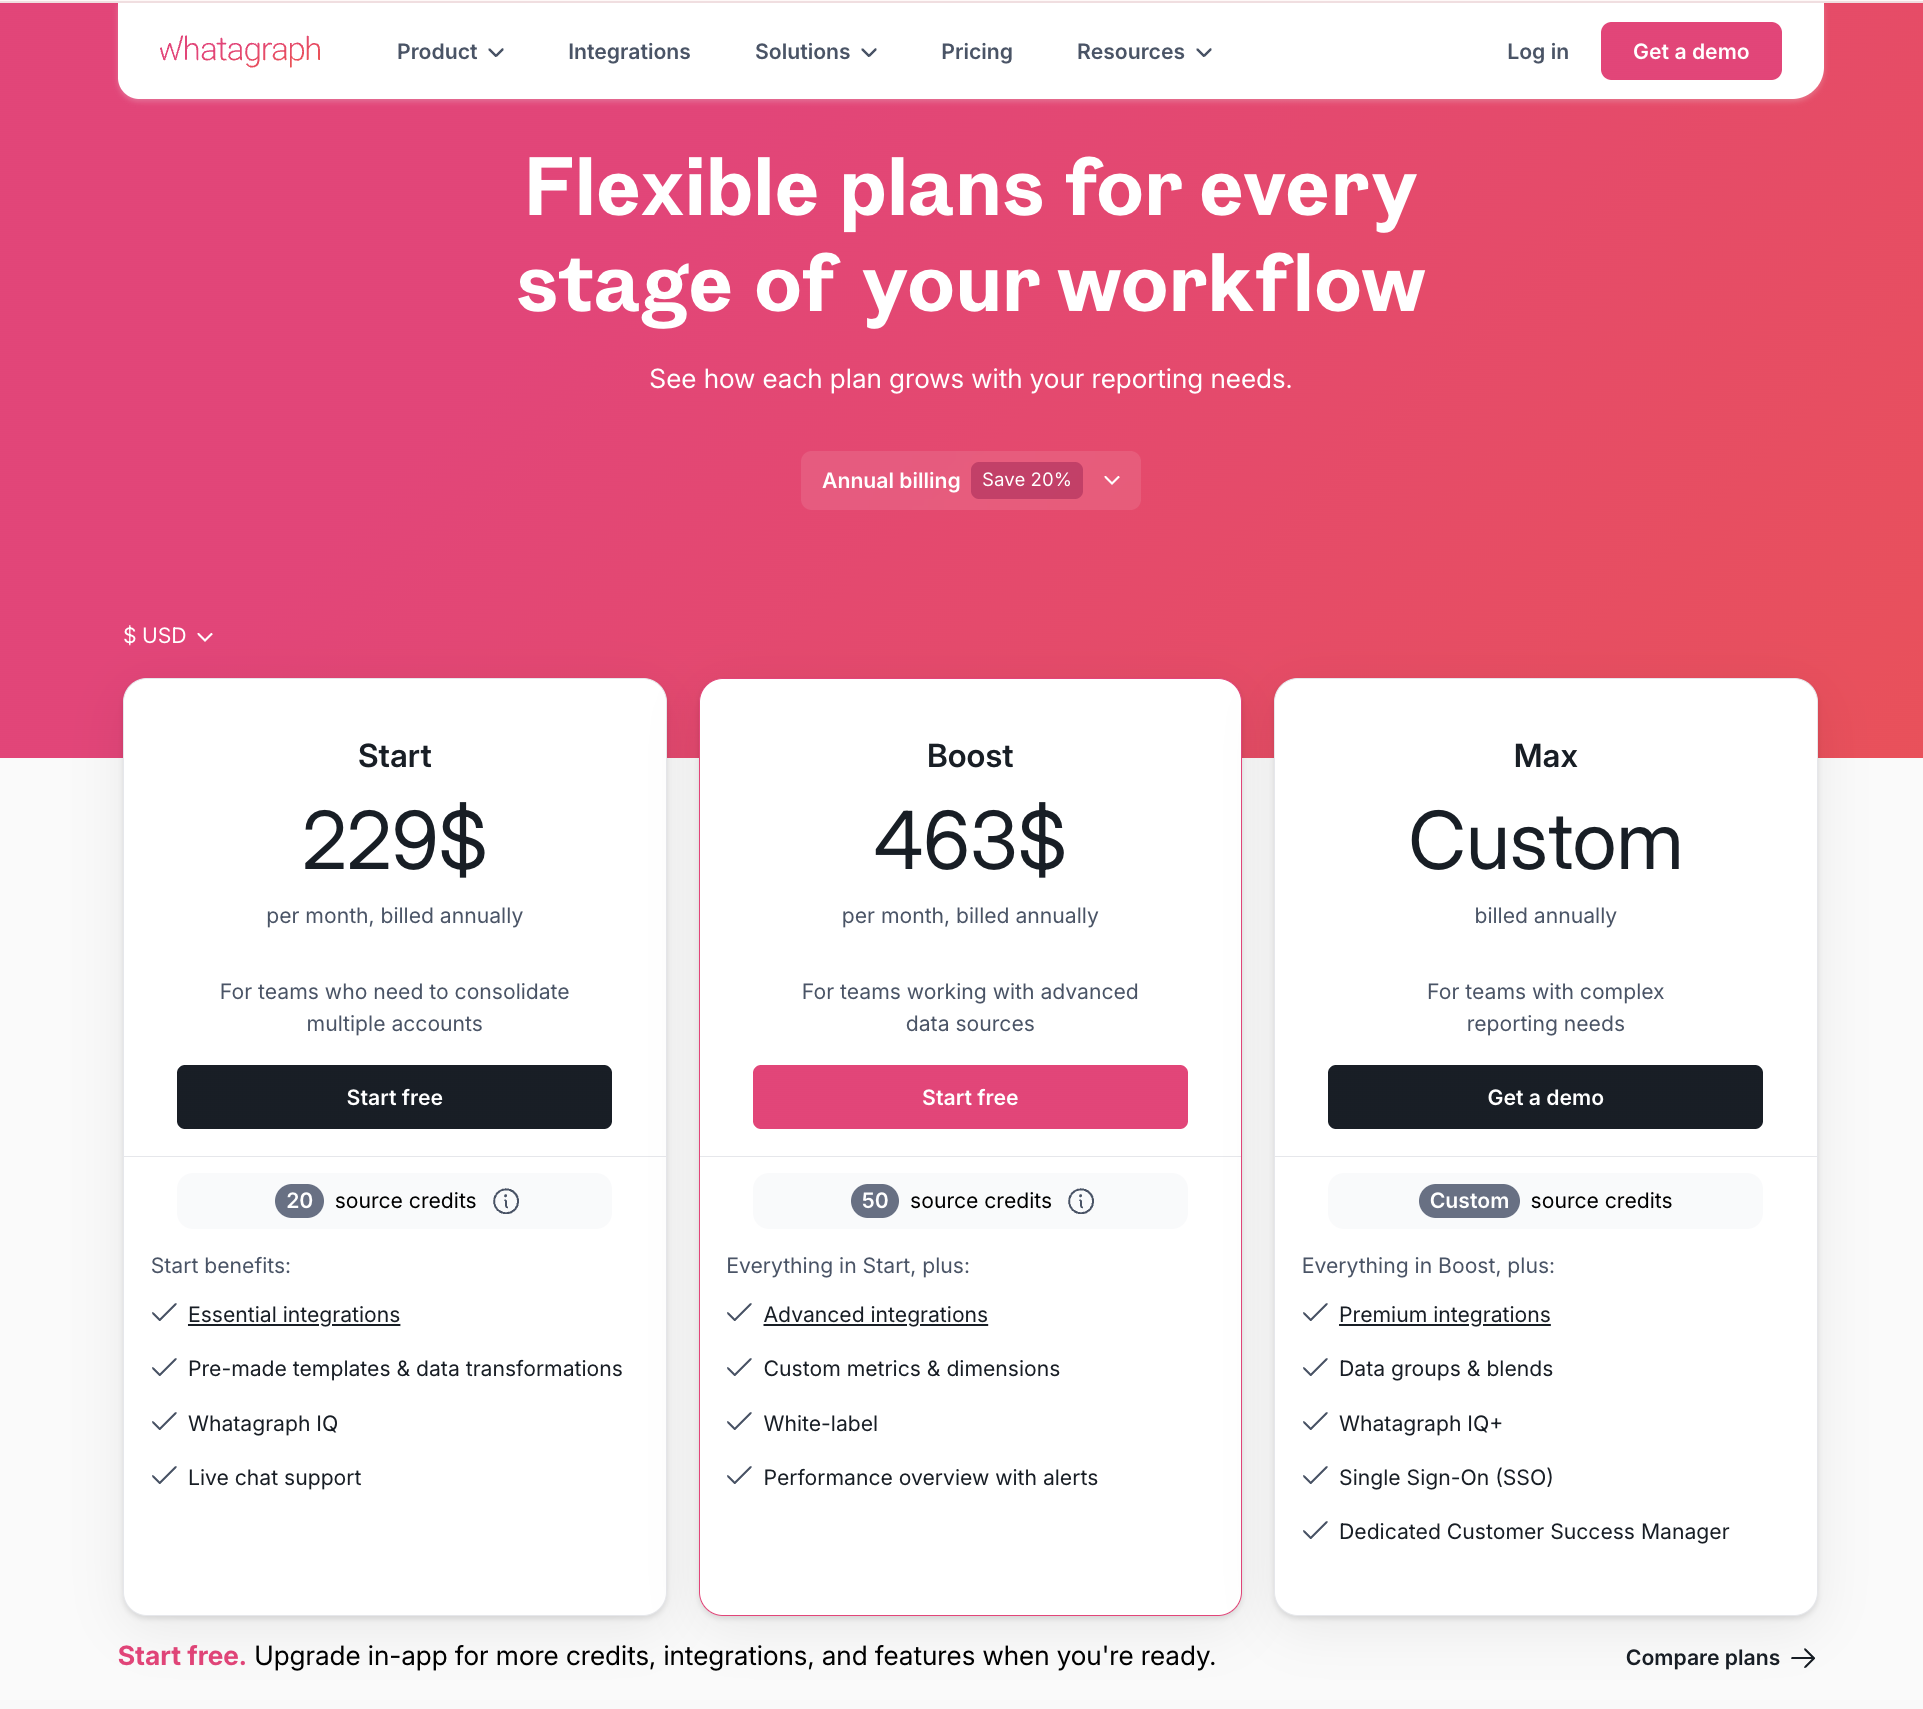
Whatagraph's pricing scales in tiers based on source credits, one credit per connected data account, so you always know exactly what you're paying for and why.
- Free (forever): 5 source credits, unlimited users, unlimited reports, Whatagraph IQ basics, live chat support.
- Start ($229/month, billed annually): 20 source credits, unlimited users, unlimited reports, essential integrations, Whatagraph IQ, live chat support.
- Boost ($463/month, billed annually): 50 source credits, unlimited users, unlimited reports, advanced integrations, custom metrics and dimensions, white-label, performance overview with alerts.
- Max (custom pricing): custom source credits, premium integrations, data groups and blends, Whatagraph IQ+, SSO, dedicated Customer Success Manager.
Start free with Whatagraph today: the leading Swydo alternative that won’t break when you grow.
Convinced Whatagraph is the right Swydo alternative for you? Book a call and tell us exactly how we can help.
Key Features
- 55+ native integrations
- Custom integrations through Custom API, Google Sheets, or BigQuery
- Versatile drag-and-drop widgets for reports and dashboards
- Custom metrics, dimensions, and data blends
- Currency conversions
- Library of pre-made dashboard and report templates
- Export to Excel and CSV
- Custom branding and white-label features
- Automated report sharing via email
- Links to live dashboards
- No-code data transfer to BigQuery and Looker Studio
Whatagraph Reviews from Real Users
“To me, Whatagraph is like the Tesla or Mercedes of digital analytics tools, their clean and simple way to present complex marketing data. I highly recommend it to anyone working with marketing analytics who values efficiency and clarity in their reporting.” (Source)
“Whatagraph has a simple user interface that is easy to navigate even for those who don't have analytical skills.” (Source)
“What I like best about Whatagraph is having the ability to create reports fast and easy. No more spreadsheets to do reports, they have a great variety of templates.” (Source)
Pros and Cons
Pros:
- All-in-one marketing performance monitoring and reporting solution
- Easy to use by anyone on your team
- Fast campaign performance and insights
- Stunning visual reports
- Makes results easy to interpret
- Excellent live chat customer support
Cons:
- No freemium plan
- Can be expensive for small agencies (under 10 employees) and freelancers
2. Tableau
Most suitable for: Data teams at large enterprises
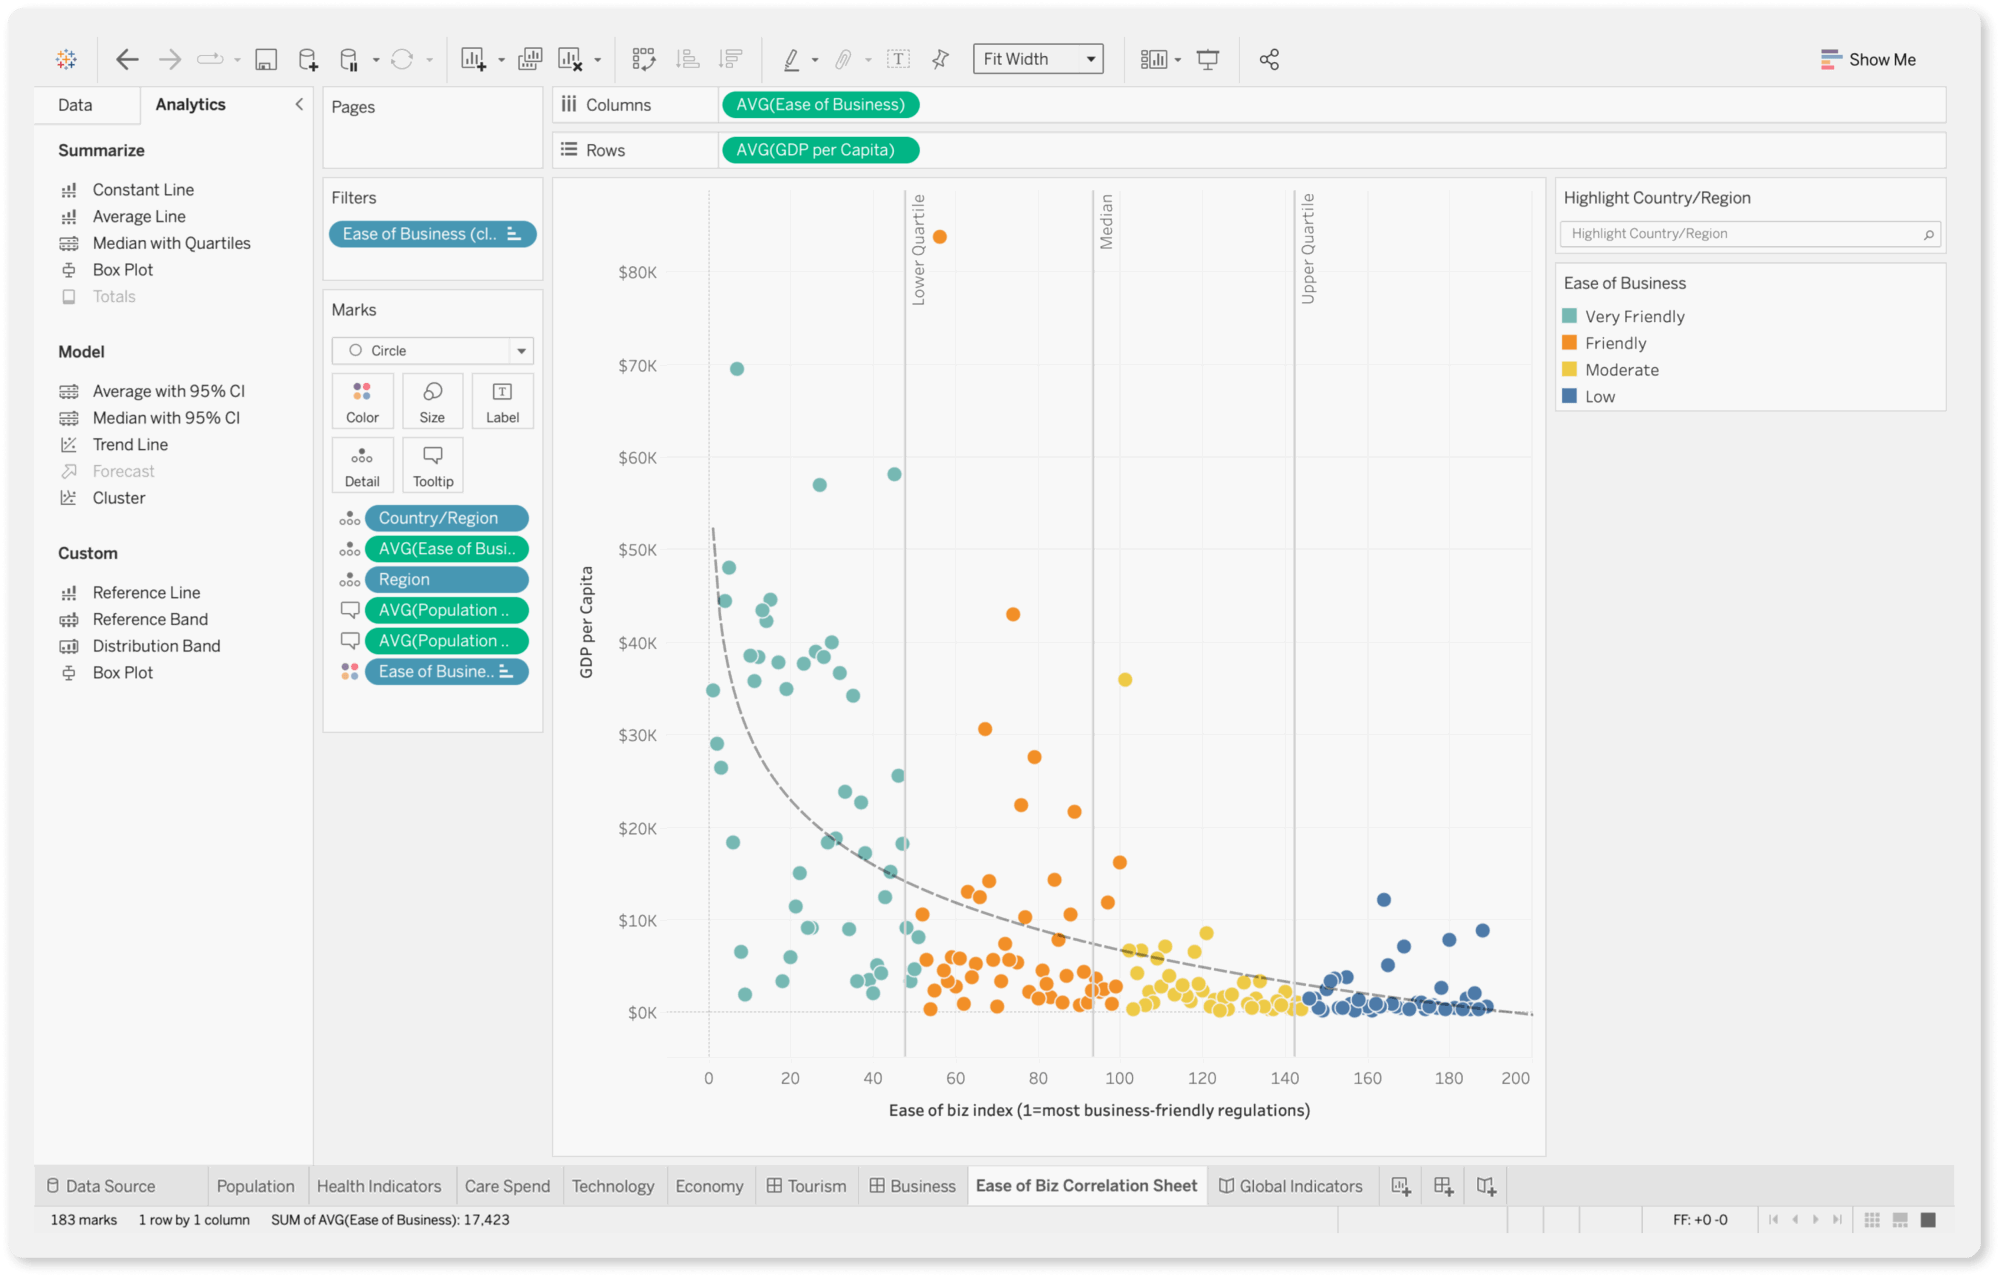
If you’re ready to invest in an enterprise-level business intelligence solution, Tableau is a great choice.
For a powerful data analysis tool, Tableau is easy to use with a drag-and-drop interface and visual query builder. You can generate insights quickly and share them with stakeholders through reports.
Tableau also has one of the larger BI communities around, the Tableau Community Forums, with active discussion boards, training materials, and peer support. For more structured help, Success Plans are available as a paid add-on and include personalized training and expedited support.
Tableau Next, their agentic analytics layer, is now available, and it includes Tableau Agent (an AI assistant), Tableau Semantics (a unified semantic layer for trusted, context-aware answers), and native Slack integration so insights surface in the flow of work.
That said, Tableau Next is only accessible via the Tableau+ Bundle or as a standalone product, both requiring a sales conversation.
Key Features
- Custom metrics and dimensions
- Data blending
- Drag-and-drop dashboard interface
- AI-powered insights
Tableau Reviews from Real Users
“Tableau can be expensive, especially for small teams and individual users.” (Source)
“A great tool for handling big datasets, with clear visuals that make the work more time-effective.” (Source)
“I find there is some licensing cost with Tableau that is more compared to other tools. Some of the companies prefer less licensing cost.” (Source)
Pros and Cons
Pros:
- Powerful data analytics and visualization
- Easy to use and implement
- Seamless data integrations
Cons:
- Can be expensive if you need advanced features
- Takes a lot of time to load for large datasets
- All the preprocessing of the data (data cleaning) has to be done beforehand. Data cleaning cannot be done in Tableau
Tableau pricing
Per-seat pricing means your bill is tied directly to headcount, not just how many data sources you're connecting. Also worth noting: most reporting tools don't charge separately for people who only consume reports—Tableau does.
Here's how the license tiers break down:
- Creator ($75/user/month, Standard/$115 on Enterprise): Every Tableau deployment requires at least one Creator license to get started.
- Explorer ($42/user/month Standard/$70 Enterprise): Business users who need to dig into existing dashboards and edit workbooks, but aren't building from scratch.
- Viewer ($15/user/month Standard/$35 Enterprise): Stakeholders who just need to view and filter.
- Tableau+ Bundle (custom pricing via sales): The premium enterprise package that bundles Tableau Cloud with Tableau Next.
3. Geckoboard
Best for: Customer service, sales, and ecommerce teams that want live KPI dashboards on office TVs and screens without heavy setup.
Geckoboard is built around one core idea: put the numbers your team needs in front of them, in real time, without anyone having to log in or go looking. The dashboard software connects to 90+ data sources and turns that data into clean dashboards you can display on office TVs, share via link, or push as scheduled snapshots.
Then, you can send snapshots of these dashboards via Slack and email to stakeholders on a regular basis. With Swydo, you can only send emails.
However, unlike Whatagraph, you won’t be able to create custom data blends, metrics, and dimensions on Geckoboard. This can be a deal breaker if you’re a large company and you need to organize your scattered data to create easy to read and impactful reports.
Plus, Geckoboard explicitly doesn't support white-labeling or embedding as a white-label solution, which rules it out for agencies wanting to present dashboards under their own brand.
Key features
- Drag-and-drop dashboard builder
- KPI notifications
- Scheduled snapshots to Slack, Teams, and email (Core plan and above)
- Automated email reports
- Live TV and office wallboard dashboards
- Mobile-friendly dashboards
Geckoboard Reviews from Real Users
“Really positive and helped the business considerably with realtime live tracking.” (Source)
“I wish there more visualization options like pie charts or thermometer goal graphs. I also wish you could fit more data on one dashboard without it getting cut off.” (Source)
“After using the platform for an extended period, I had to reconfigure or completely rebuild several integrations because some of them were no longer supported.” (Source)
Pros and Cons
Pros:
- Easy to use and set up
- A wide variety of integrations
- Great customer service
Cons:
- Can be pricey if you want to add more dashboards
- Limited customization options for dashboards
- No advanced calculations, blends, and custom metrics and dimensions supported
Geckoboard Pricing
Geckoboard's pricing is based on the number of dashboards and users, with each tier bundling both together. There's no free plan—as of 2025, Geckoboard moved to a 14-day free trial model.
These are the current plans (billed annually):
- Essential ($60/month): 1 dashboard, 1 editor, 10 viewers, 1 TV display. Sharing via link only.
- Core ($175/month): 20 dashboards, Slack/Teams/email snapshot delivery, custom logo and theming.
- Pro ($319/month): 50 dashboards, interactive view, custom field metrics, audit log.
- Enterprise (custom): SSO, user management API, dedicated support rep.
4. Looker Studio (a.k.a. Google Data Studio)
Best for: Freelancers, boutique agencies, and Google-centric marketing teams.
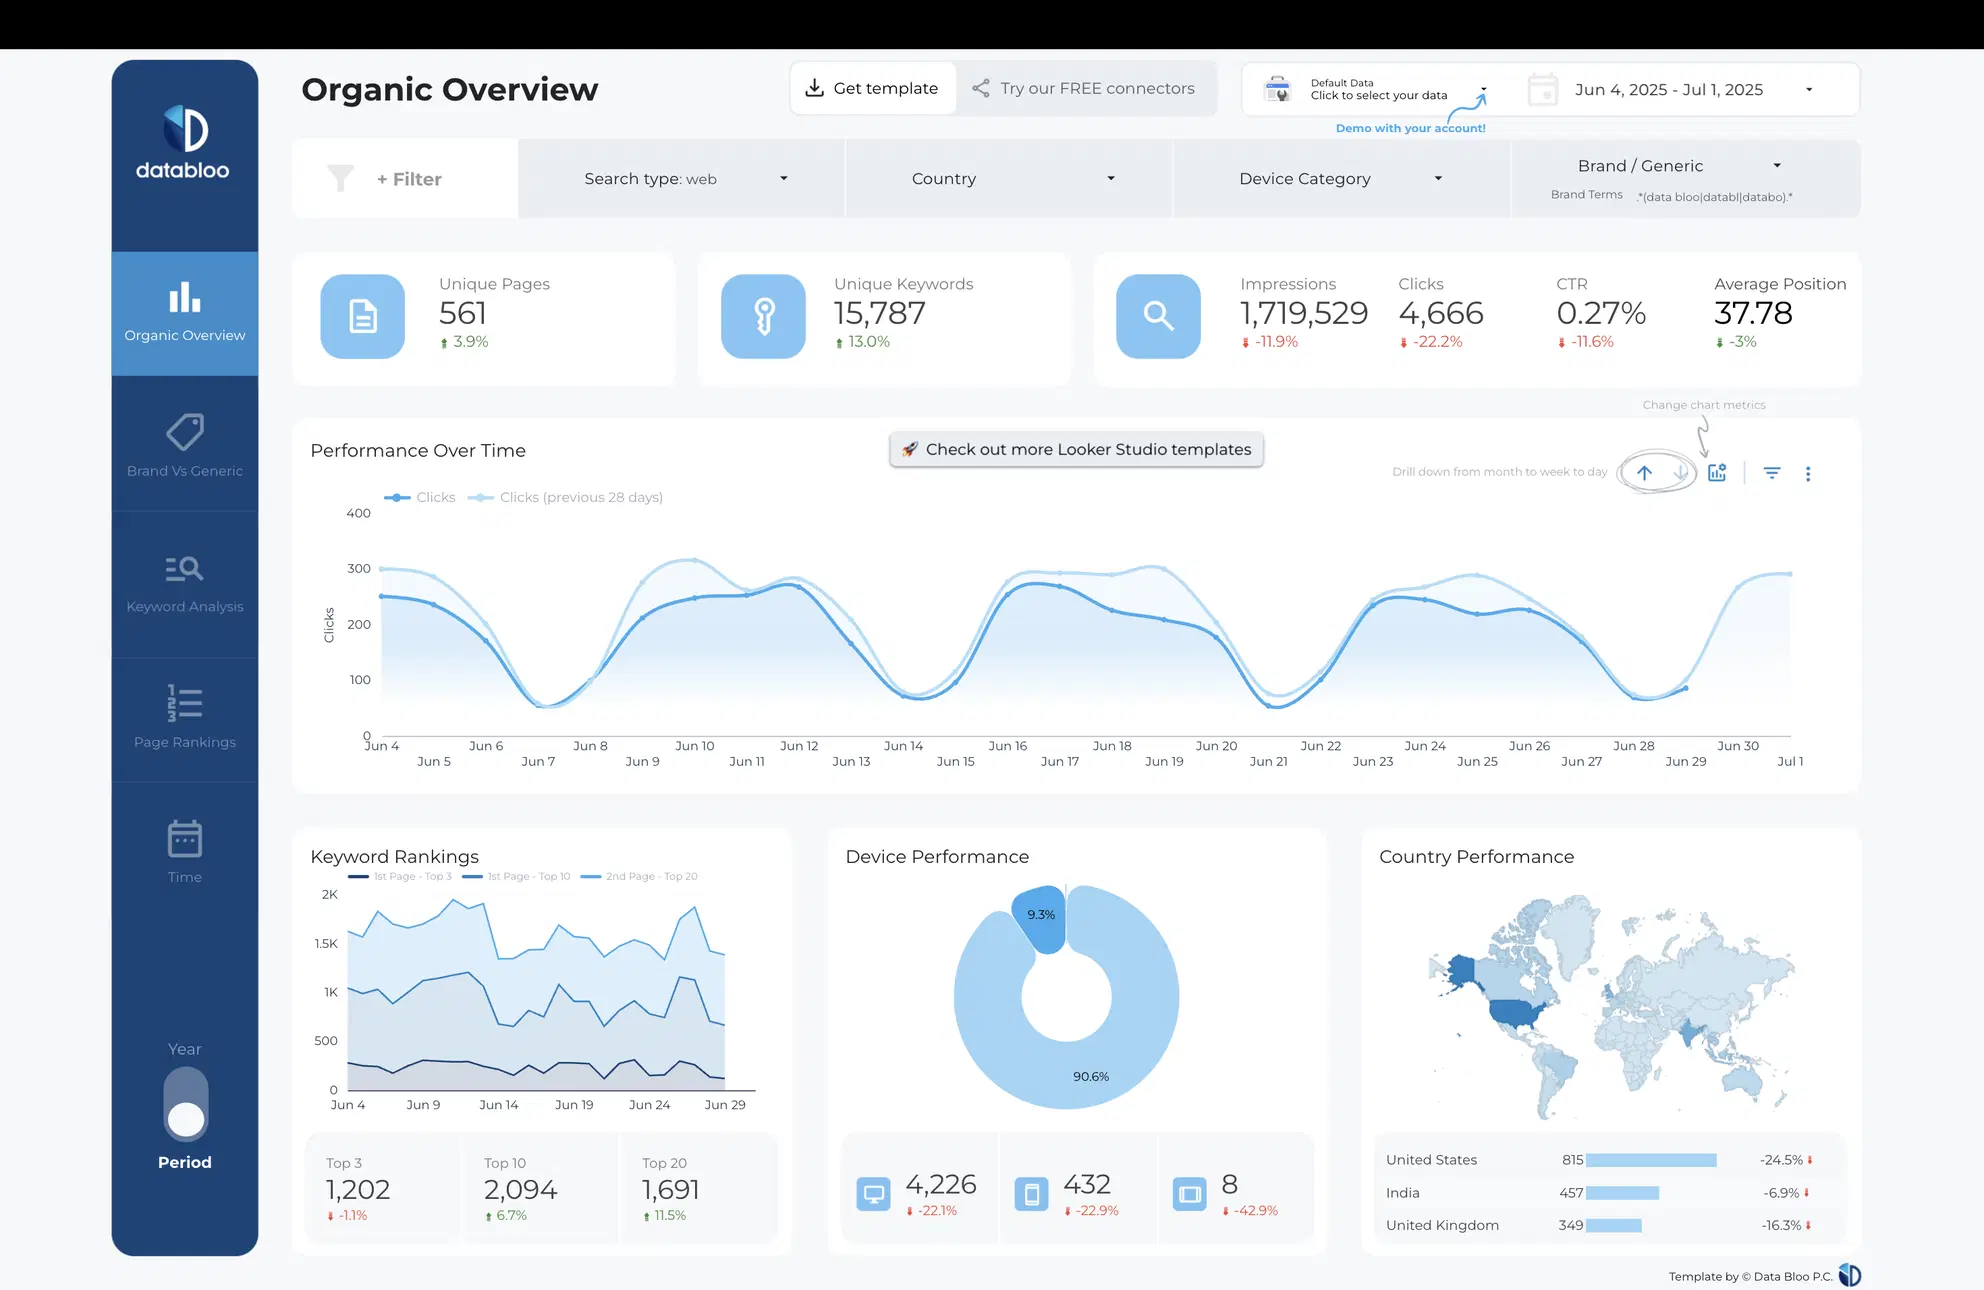
Google's free reporting tool, Looker Studio, connects natively to Google Ads, Display & Video 360, Google Sheets, Google Analytics, BigQuery, MySQL, and more, and extends to 800+ partner connectors for non-Google platforms.
Compared to Swydo, you’ll be able to connect to 800+ platforms via third-party integrations on Looker Studio.
But note that third-party connectors can introduce slow load times and occasional data breakages.
There are three major upgrades to Looker Studio in 2026:
- The biggest recent addition is Gemini integration. Pro users can now use conversational analytics to ask questions in plain English, and Gemini can help build calculated field formulas from natural language prompts.
- There's also now a dedicated Looker Studio mobile app for iOS and Android.
- A newer Pro feature lets you export live dashboard widgets directly into a Google Slides presentation with Gemini assistance.
Key Features
- 21 native connectors (free)
- 1000+ “partner” connectors (paid)
- Drag-and-drop report builder
- Data blends
- Custom images and text
- Custom styles and color schemes
- Mobile app
Looker Studio Reviews from Real Users
“free and easy to use data visualisation and also connect with Google sheet make the chart and columns chart.” (Source)
“I wish Gemini was better integrated to build the dashboards.” (Source)
“Looker Studio is weak when it comes to integrating data from third-party tools outside the Google ecosystem, such as Bing or Yandex.” (Source)
Pros and Cons
Pros:
- Free (to an extent)
- A huge range of data visualization formats and options
- Easy to use for basic reports
Cons:
- Slow loading
- Connection breakages and inaccurate data
- Limited report sharing options (no Word, Sheets, or PDFs)
Looker Studio Pricing
- Looker Studio (Free): Core reporting and dashboard builder, native Google connectors.
- Looker Studio Pro at $9 per user, per project, per month: Up to 200 scheduled PDF reports (vs. 1 on the free version), access to the native Looker Studio app for iOS and Android.
But even if you use the free version, you’ll likely encounter these two costs:
- Partner connectors: If you need to pull data from Meta Ads, TikTok, or LinkedIn, you’ll need a third-party connector (e.g., Supermetrics or Power My Analytics).
- BigQuery usage: If you store your data in BigQuery to speed up slow reports, you pay for data storage and "query costs."
Here’s how you know you’ve outgrown Looker Studio.
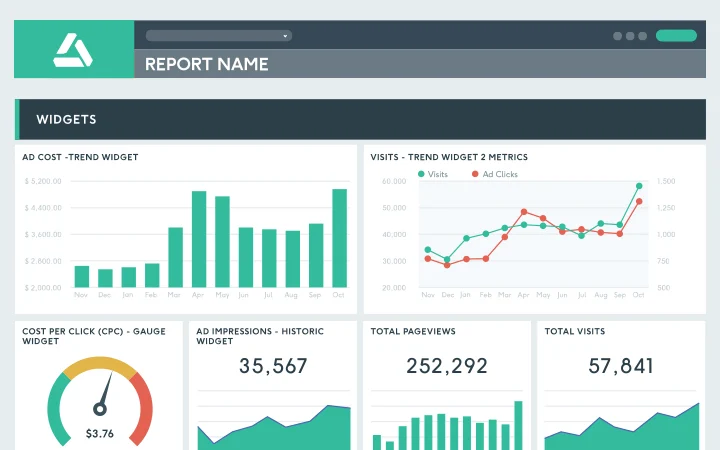
5. AgencyAnalytics
Best for: SEO and content marketing agencies that need built-in rank tracking, site auditing, and backlink monitoring
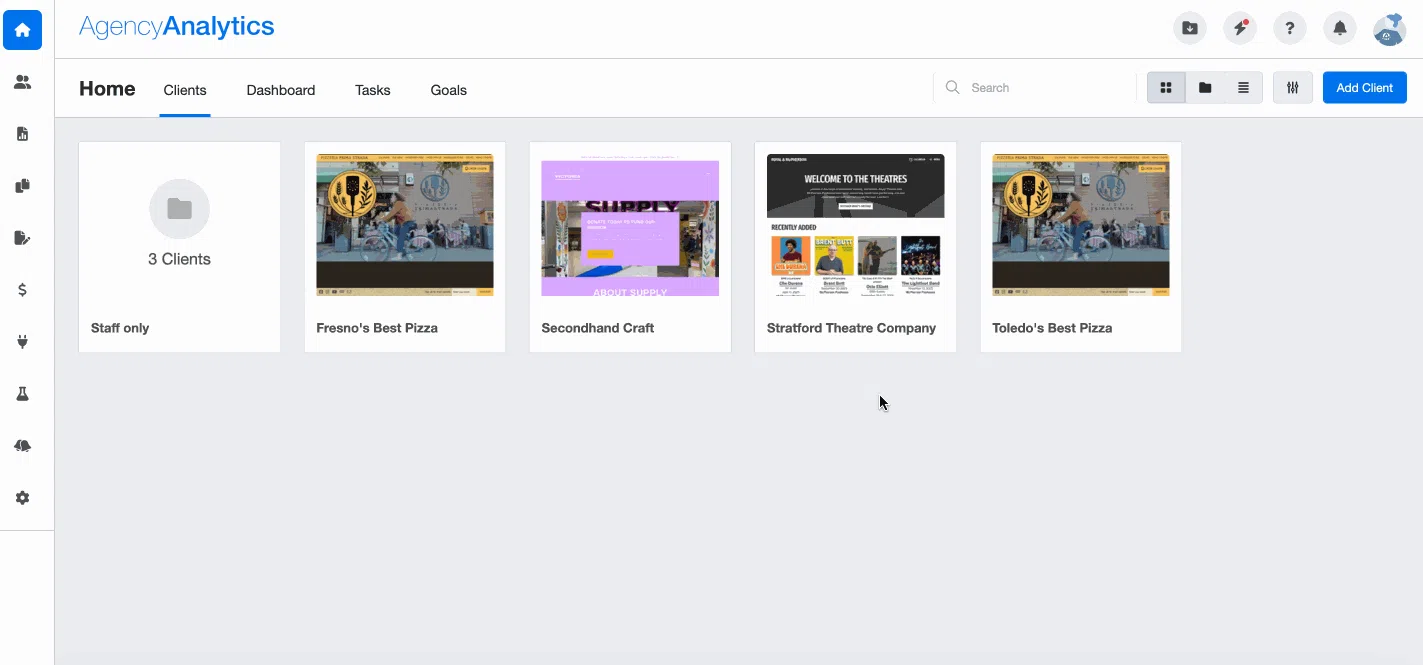
AgencyAnalytics is a very close Swydo alternative, but for SEO and content marketing agencies.
You can connect to 80+ data sources, including major SEO platforms like Ahrefs, Backlink Monitor, and Semrush, as well as social channels like Facebook, Instagram, and LinkedIn.
Where it stands apart from Swydo is its built-in SEO toolset: Rank Tracker, Site Auditor, and Backlink Manager let you monitor rankings, audit client sites, and track backlinks without leaving the platform. These aren't available on Swydo.
Note that Rank Tracker is now a paid add-on at $41.67/month per 500 keywords (billed annually), rather than bundled into the base plan.
AgencyAnalytics has also expanded its AI capabilities. Ask AI is a chat-based co-pilot powered by OpenAI that answers questions directly from your live client data, and AI Summary auto-generates performance summaries you can drop into any report or dashboard. Beyond AI, the platform launched Benchmarks, Forecasting, and Anomaly Detection.
However, users say the platform can be unstable with sources disconnecting frequently due to “service bandwidth” issues. AgencyAnalytics also doesn’t come with advanced data calculations and their dashboards are rigid and limited.
Key Features
- 80+ integrations
- Ready-made report templates
- White-labeling
- Client and staff management
- SEO tools
- AI insights
AgencyAnalytics Reviews from Real Users
“My favorite part of AgencyAnalytics is how the efficiency of using this tool to centralizes all our data into one clean dashboard.” (Source)
“The basic filtering available for charts and tables is lacking, as I can't filter by conversion names, keywords, etc.” (Source)
“I would like if AgencyAnalytics had a safer HIPAA compliant connection to CTM.” (Source)
Pros and Cons
Pros:
- Easy to set up and use
- A wide library of ready-made report templates
- Cost-effective
Cons:
- Buggy
- Lack of advanced data calculations and organization features
- Limited integrations
AgencyAnalytics Pricing
AgencyAnalytics uses client-based pricing, so your monthly cost scales with the number of clients you're managing, calculated via their on-site pricing calculator.
Rank Tracker is a paid add-on, not bundled into the base plan—it runs $41.67/month per 500 keywords (billed annually).
Database connectors (MySQL, BigQuery, Amazon Redshift) and a Concierge Implementation service are also available at custom pricing via their sales team.
Read our full guide to AgencyAnalytics pricing.
6. TapClicks
Best for: Large media companies, enterprise brands, and agencies that need a full marketing operations stack.
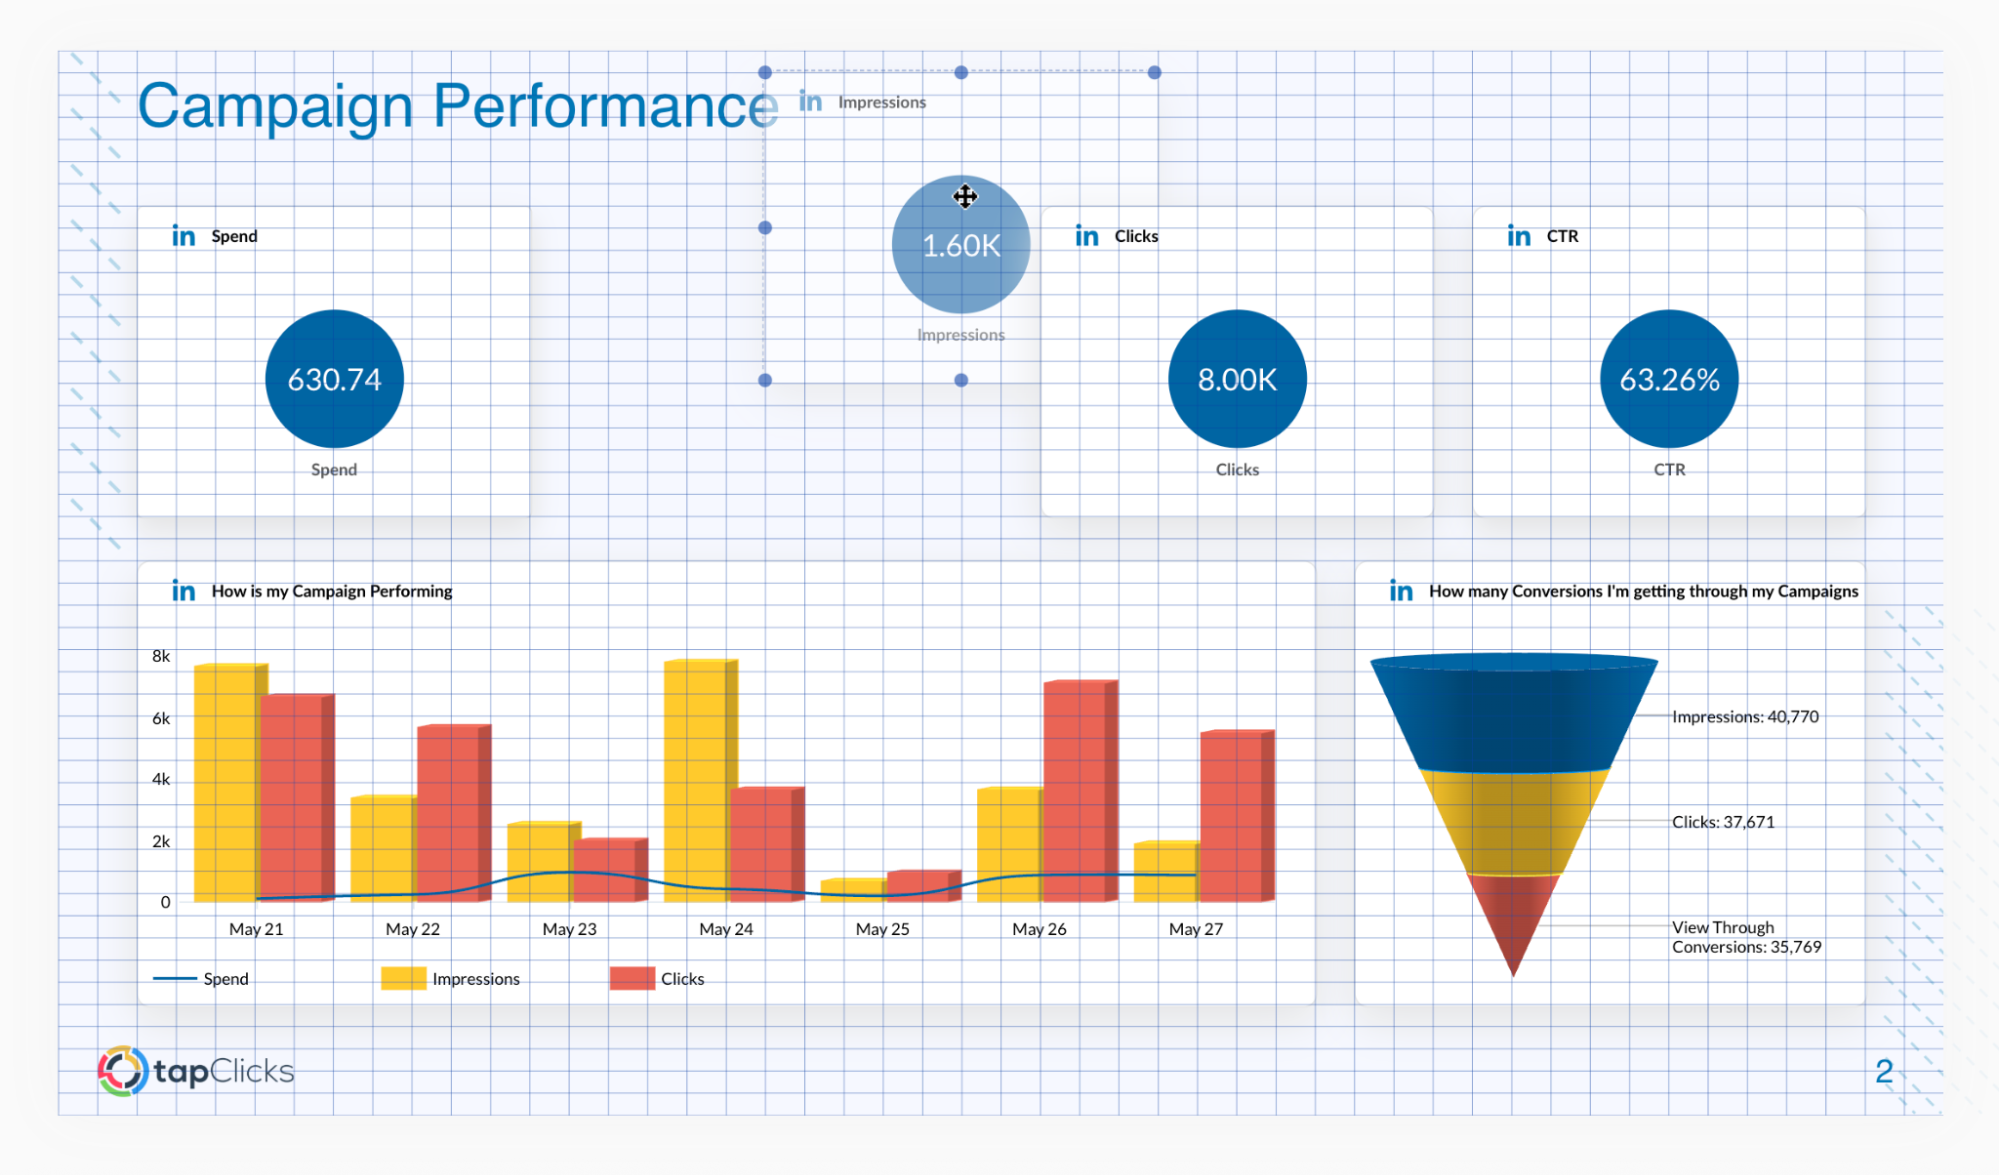
TapClicks is less a reporting tool and more an enterprise resource planning system for marketing teams. The platform bundles eight distinct products into a single Smart Marketing Cloud, which means the scope is genuinely impressive, but so is the complexity.
Here’s a breakdown of each of them:
- TapData (ETL/ELT): Handles automated warehousing, advanced data mapping, and exports to destinations like BigQuery, Snowflake, and Tableau.
- SmartReports: TapClicks' AI Reporting Suite, launched October 2025; combines SmartSlides, SmartEmail, AI Agents inside Report Studio, and mobile apps for on-the-go access.
- SmartAnalytics (formerly TapAnalytics): Real-time dashboards with margin and markup rules built in for financial reporting.
- TapInsights: Machine learning-powered prescriptive analytics; compares performance against industry benchmarks and automates goal pacing.
- TapOrders: Automates the point of sale; captures campaign goals and booking information, connecting directly to your CRM.
- TapWorkflow: Project management that routes tasks to ad ops or fulfillment teams based on order data from TapOrders.
- TapSEO (formerly Raven Tools): An all-in-one SEO platform covering site audits, rank tracking, and link-building.
- TapSpy (formerly iSpionage): Competitive intelligence for SEM; shows what competitors are bidding on in real time.
You can already see that TapClicks offers a lot more features than Swydo.
But the platform itself is not ideal. Based on online reviews, their connections break constantly, the data on reports is inaccurate, and the platform is difficult to use (even with 6 months of support from a CSM).
Key Features
- Wide variety of integrations (their website doesn’t say exactly how many)
- Advanced data calculations
- Data Exporter to load data into data warehouses, databases, and data visualization tools
- Interactive dashboards
- AI-powered insights
- Report automation
TapClicks Reviews from Real Users
“We have been using TapClicks for long now and it has streamlined our marketing operations. It helps us save time and get deeper insights into our business data.” (Source)
“I dislike TapClicks because the initial setup can be a bit overwhelming, and sometimes the data syncing isn't as smooth as I'd like.” (Source)
“After months of calls and time invested, we still had inaccuracies in the data.” (Source)
Pros and Cons
Pros:
- Powerful data analytics
- Customizable and interactive dashboards
- Responsive customer support
Cons:
- Steep learning curve
- Data inaccuracies
- Connection issues and lags
TapClicks Pricing
As of April 2026, TapClicks doesn't publish fixed pricing. Plans are custom-quoted based on your use case, data volume, and which products in the suite you need.
7. Databox
Best for: Boutique agencies and small businesses that want an accessible BI-style dashboard tool.
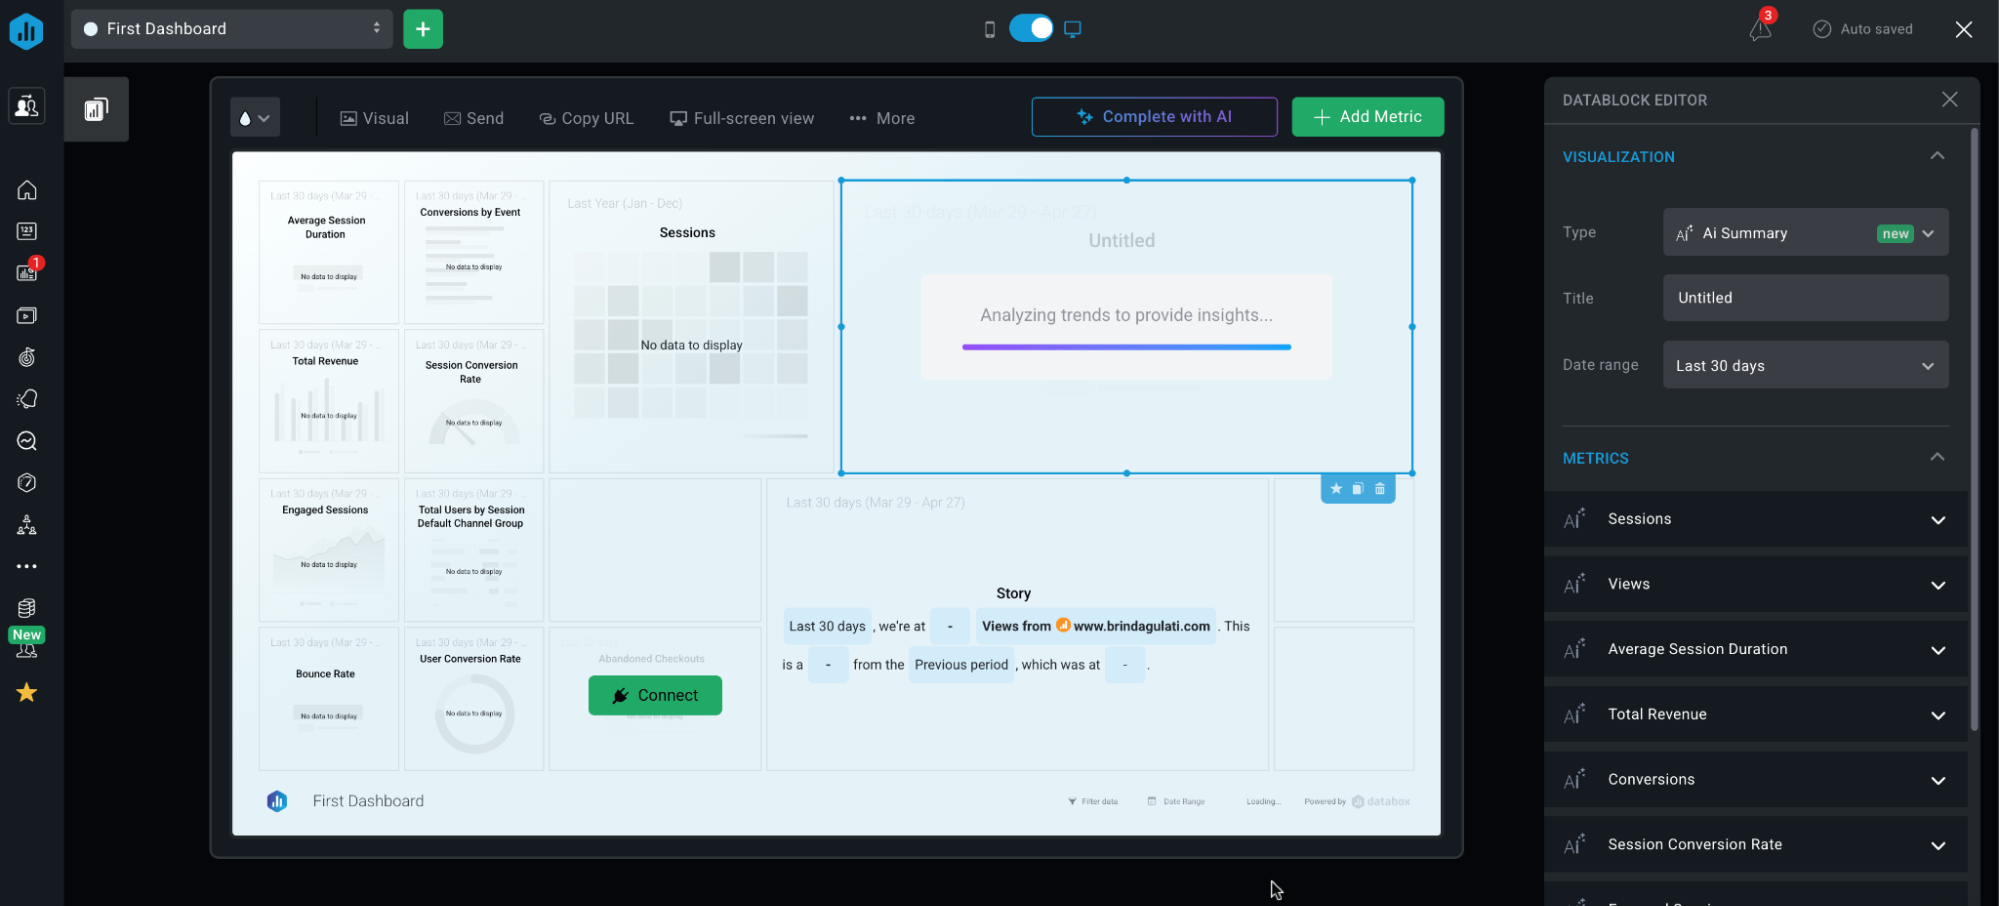
Databox sits in the middle ground between a simple reporting tool and a full BI platform. It connects to 130+ data sources including Google, Meta, HubSpot, Shopify, and custom databases, and its drag-and-drop dashboard designer is one of the more intuitive on this list.
Databox recently launched an MCP connector that lets users access their Databox metrics directly inside tools like ChatGPT and Claude without leaving those workflows.
They’ve also launched Merged Datasets wherein you can now combine multiple datasets from different sources into a single unified table and use formulas to create new calculated columns.
Databox also sends alerts through Slack, email, or app updates when performance trends up or down on your tracked metrics. On Swydo, this is only possible through emails.
However, Databox users say the platform is clunky and difficult to use.
Databox’s reports are also not linked, which means you’ll need to edit them one by one rather than in batch. This can be very time-consuming if you need to tweak dozens of similar reports for clients. On Whatagraph, you can edit them in one go, saving you massive time.
Key features
- 100+ integrations
- Native visualization dashboards and reports
- Dashboard and report templates
- Slack, email, or in-app alerts
- KPI benchmark groups
Databox Reviews from Real Users
“Pretty easy to follow your nose without prior experience with data.” (Source)
“While it has the major business integrations and connections, it needs more connections to work in certain industries.” (Source)
"After 2 years of trying, we were never able to fully launch Databox with our clients because there is always another issue with Databox." (Source)
Pros and Cons
Pros:
- Easy to use
- Wide variety of integrations
- Interactive data
Cons:
- Slow customer support
- Bugs and lag issues
- Broken metrics and templates
Databox pricing
As of July 1, 2025, Databox no longer offers a free tier for new accounts.
Pricing is based on data sources, while users are unlimited across all plans. Additional data sources beyond what's included cost $5.60/month each.
- Pro at $159/month (billed annually): 3 data sources included, unlimited dashboards, unlimited users, hourly sync, automated reports, and goal tracking.
- Growth at $399/month (billed annually): Everything in Pro, plus Datasets and Merged Datasets, AI performance summaries, anomaly detection, row-level data drilldown, and database/warehouse connections.
- Premium at $799/month (billed annually): Everything in Growth, plus 100 data sources included, forecast modeling, OKRs, a dedicated reporting specialist, priority support, and advanced security management.
8. DashThis
Best for: Freelancers and small teams who need clean, shareable client reports, and don't need data blending or custom APIs.
DashThis is very similar to Swydo in scope: it connects to 30+ marketing platforms and is built around the same premise: connect your data, pick your KPIs, and let the tool handle the reporting automatically.
For anything outside the native integrations, you can bring in custom data via CSV file upload or Google Sheets. DashThis's CSV tool updates automatically once configured, so you're not re-importing manually each month.
The platform's reporting library includes 50+ preset dashboard templates and 1,000+ preset widgets, so you're rarely starting from scratch.
On the more pricier plans, you’ll get a dedicated product specialist assigned to you who will help you set up your dashboards.
However, DashThis is more suitable as a reporting tool rather than a data analytics platform. There are very few options to customize or organize your data on DashThis.
You can only “merge” widgets together in DashThis; you can’t blend data sources to the full extent or create advanced metrics and dimensions. On Whatagraph, you can easily organize your data any way you’d like using simple workflows.
Key features
- 30+ integrations
- Custom data upload via CSV file or Google sheets
- Visualization dashboards
- Automatic data refreshes
- Upload client or band logos
- Create custom widgets, domains, color schemes, and email addresses
- Library of report templates
- Report sharing via email, URL, or PDF
DashThis Reviews from Real Users
“Very easy to use and visually appealing dashboard. Super customizable and easy to hookup to any of our platorms.” (Source)
“One downside is the pricing; it can be a bit steep for smaller teams. Also, some of the advanced features are a little tricky to set up without some prior knowledge.” (Source)
“The weakness of DashThis is that it requires knowledge of the other programs it's pulling information from.” (Source)
Pros and Cons
Pros:
- Easy to use and set up
- Many templates and dashboard examples available
- Relatively inexpensive
Cons:
- Limited data organization and customization features
- Limited data integrations
- Basic-looking reports
DashThis pricing
DashThis charges by the number of dashboards, and, as of March 30, 2026, also sets a cap on data sources per plan. Users and integrations remain unlimited across all tiers.
- Individual at $44/month (billed annually): 3 dashboards, 15 data sources.
- Professional at $139/month (billed annually): 10 dashboards, 40 data sources.
- Business at $279/month (billed annually): 25 dashboards, 100 data sources.
- Standard at $429/month (billed annually): 50 dashboards, 200 data sources.
9. Grow.com
Best for: Mid-to-large enterprises and data-forward teams that need ETL, storage, and visualization.
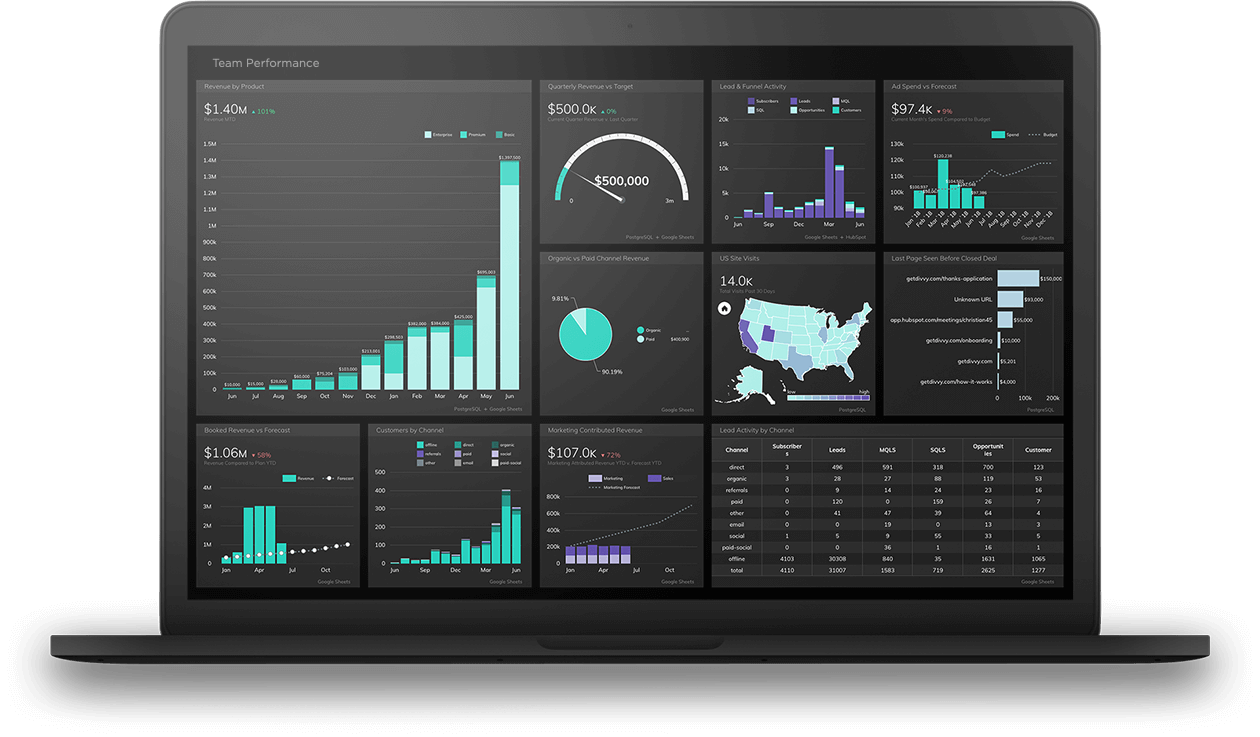 Swydo pulls data from your connected platforms and displays it. Grow pulls your data, stores it internally, transforms it, and then visualizes it; making it less of a reporting tool and more of a self-contained BI stack.
Acquired by enterprise software company Epicor in 2022, Grow connects to 100+ data sources via native integrations: SQL databases, CRMs, ad platforms, accounting tools, and file sources including Google Sheets, Dropbox, Excel/CSV, and Amazon S3.
Once that data lands in Grow, you can reshape it using either point-and-click No Code Transforms or raw PostgreSQL for anything more complex.
You can create three types of dashboards on Grow:
- Dynamic dashboards which display data based on who is logged into the account.
- Dashboard Blueprints which are pre-built, single data source dashboards
- Custom & Sandbox dashboards which shows blended data sources and metrics
The key advantage of Grow over Swydo is their 24/7 customer support via live chat. Swydo’s customer support is available 24/5. US-based customers can also call their hotline to get quick answers.
However, Grow is more suitable for internal data storage and monitoring rather than for external reports. Their dashboards are very nitty-gritty which can overwhelm clients or the C-Suite.
Key features
- 100+ native integrations
- Built-in data storage
- SQL or non-SQL based data transformations
- Customizable dashboards
- Advanced data analytics and predictive modeling
- Real-time data updates
Grow Reviews from Real Users
“Ease of use, Its like power of data which can be used at various levels of our organisation and has best value in analytics.” (Source)
“I wish it was just a bit smoother and faster overall, that’s all.” (Source)
“Grow.com is great for creating dashboards quickly, but it could improve in areas like data loading speed, version control, and advanced visualization customization.” (Source)
Pros and Cons
Pros:
- Intuitive, easy to use interface
- 24/7 customer support
- No-code data pipelines, storage, and visualizations
Cons:
- Occasional lags
- Expensive
- Slow performance when dealing with large volumes of data
Grow pricing
Grow doesn’t share their pricing publicly.
10. Funnel.io
Best for: Enterprises and large agencies with dedicated data or analytics teams.
Funnel has built out into a full marketing intelligence platform covering four layers: data integration, advanced measurement, reporting, and data activation.
The foundation is the Data Hub: 600+ connectors pulling from marketing platforms, CRMs, ad networks, and data warehouses, all centralized, harmonized, and stored in Funnel before being routed wherever you need it.
The standout capability is Funnel Measurement. Rather than relying on last-click attribution alone, it combines Marketing Mix Modeling (MMM), multi-touch attribution (MTA), and incrementality testing in a triangulation approach that cross-validates results across all three methodologies.
Funnel does offer a basic visualization dashboard to visualize your key metrics, but there aren’t a lot of customization or white-labeling options available.
Funnel is also difficult to use and much more expensive than Swydo.
Key features
- 600+ integrations
- Custom integrations or Google Sheets data import
- Custom dimensions, metrics, and currency conversions
- Basic visualization dashboards to view key metrics
- Export to data destinations
Funnel Reviews from Real Users
“Been using it for close to 8 years, I love that it's user friendly and is able to easily pull data from all our major platforms.” (Source)
“Some connectors and transformations can also take a while to process when large volumes of data are involved. I would also like to see more in‑tool guidance and templates for common dashboards so new users can get value faster.” (Source)
“Unfortunately, the software is not very scalable when connecting to different platforms.” (Source)
Pros:
- A wide range of connections with all major marketing platforms
- Low-code data organization interface
- Fast and helpful customer support team
Cons:
- Initial steep learning curve
- Occasional bugs in connectors
- Basic native visualization widgets
Funnel.io pricing
Funnel uses a two-component pricing model: plan tier plus flexpoints, which measure usage capacity across connectors, accounts, dashboards, and destinations.
- Starter from $200/month: 121 connectors, 5 users, 1 workspace, Funnel Dashboards and Looker Studio reporting, Google Sheets export, daily sync.
- Business from $800/month: 579 connectors, unlimited users and workspaces, full reporting suite, data warehouse exports, Measurement available as a paid add-on.
- Enterprise: Custom pricing. 590 connectors, Snowflake export, SAML/SCIM SSO, audit log, EU data center, enterprise SLA.
Funnel Measurement pricing is separately quoted and based on ad spend volume and number of models required.
11. Supermetrics
Best for: Enterprises with dedicated data scientist teams.
Supermetrics started life as a connector between Google Analytics and Excel. The platform now covers four layers.
- Connect handles data ingestion from 170+ pre-built sources plus CSV/Excel uploads for offline data and custom-built connectors for anything bespoke.
- Manage covers storage, normalization, and transformation: automated field mapping, custom field definitions, data blending across sources, and Supermetrics Storage, a managed data warehouse layer built on BigQuery that lets teams centralize historical data without owning or maintaining their own warehouse infrastructure.
- Analyze routes clean data to wherever your team works; Looker Studio, Power BI, Tableau, Google Sheets, Excel, BigQuery, Snowflake, Redshift, or Amazon S3.
- Activate, the newest pillar (expanded through Supermetrics' June 2025 acquisition of Dutch data company Relay42), closes the loop by pushing performance data back to ad platforms and engagement tools.
The strongest use case is teams that need clean, governed, multi-source data flowing reliably into an existing BI or warehouse setup.
The ceiling shows up when teams want a self-contained reporting product. Supermetrics isn't Whatagraph; there's no white-labeled client-facing report builder, no drag-and-drop dashboard with preset templates designed for non-technical stakeholders.
If your end deliverable is a polished performance report for a client who doesn't want to open Looker Studio, you'll need to build that layer yourself on top.
Key features:
- 150+ integrations
- Data transfers to business intelligence tools, spreadsheets, and data warehouses
- Native data storage layer called “Supermetrics Storage”
- Automated normalization, custom fields, data blending, and data enrichment rules
- Ad budget tracking
- Real-time and retroactive reporting
Supermetrics Reviews from Real Users
“I like that Supermetrics supports all common networks and offers many connectors, which allows collaboration with many tools.” (Source)
“It often feels like you need to upgrade just to access basic functionality, and the pricing structure doesn’t scale well if you only need a few specific integrations.” (Source)
“I don’t feel comfortable with Supermetrics package price, where it keeps increasing, more so when users or connectors increase Supermetrics faces technical difficulties, more so when there is network connectivity problems that needs fixing.” (Source)
Pros:
- Simple and easy to use
- Automated no-code data transfers
- Easy historical data retrieval
- Great for extracting data to BI or ML platforms
Cons:
- Loading data to multiple destinations is not available with a single pricing plan
- Adding more data sources requires buying more connectors
- Looker Studio connector can get slow when connected to multiple ad accounts
Supermetrics pricing
Pricing is modular and not published transparently. Your quote is based on sources, destinations, and required features.
12. Improvado
Best for: Data teams and marketing teams at large companies.
Improvado is an end-to-end data pipeline platform that gathers data from marketing platforms, MarTech tools, and CRMs, transforms this data, and ships it to various destinations.
You can integrate with over 500 channels and harmonize and clean your data into an unified dataset.
You can then push this cleaned data to visualization tools, data warehouses, and spreadsheets. You can also keep your data in a fully-managed storage.
Similar to Supermetrics and other ETL tools, you’ll still need to move your data from Improvado to a third-party tool like Looker Studio to visualize it.
However, Improvado does offer pre-built dashboards that you can use right away with your visualization tool of your choice. This means you won’t need to spend too much time creating dashboards and reports.
But it can take months to implement Improvado and you’ll need to have strong coding skills to build dashboards. This makes it a more suitable tool for enterprises who need a powerful data analytics platform, but it may be overkill for marketing agencies and small businesses.
Improvado Reviews from Real Users
“The tool is powerful and the team wants to try hard to support you.” (Source)
“It requires technical experience. I wouldn't say this is a tool marketers or beginners can use. You'll need a developer depending on what you are looking to do.” (Source)
“Too much push for AI. Inconsistent data delivery based on the settings selected.” (Source)
Key Features
- 500+ integrations
- Fully-managed data storage
- Unlimited data destinations
- Pre-built dashboards
- AI-driven data transformations
- Marketing attribution
- AI-powered campaign governance
- AI-insights
Pros and Cons
Pros:
- Powerful data analytics
- AI-powered insights
- Helpful customer support
Cons:
- Can be expensive for small businesses and agencies
- Long implementation time
- Steep learning curve
Pricing
Pricing is custom across three tiers—Growth, Advanced, Enterprise—volume-based on data rows rather than source or user count.
13. NinjaCat
Best for: Marketing agencies, media companies, and enterprise brands that need data infrastructure and client-facing reporting in one platform.
NinjaCat is an end-to-end platform for connecting to your data sources, cleaning the data, visualizing it, and shipping it to destinations.
The foundation is the Data Cloud, which connects to 150+ pre-built marketing-specific data sources covering paid media, social, web analytics, CRM, and offline channels. Data lands in a dedicated Snowflake environment managed by NinjaCat, which you can keep as your primary warehouse or use as a staging layer before pushing to BigQuery, Databricks, Redshift, or S3.
You can then simplify and harmonize your data with no-code transformations and custom calculations. There’s also the option to store your data in a managed warehouse. Or, you can ship your data to external storage destinations like Snowflake, BigQuery, or Amazon S3, or business intelligence destinations like Tableau and Looker Studio.
When it comes to creating reports, you can start from a blank template (that looks like a “canvas”) and add and adjust metric widgets as needed.
 Graphic designers will be familiar with this layout as it looks a lot like a popular design tool—Figma. However, if you’re a marketer without a design background, this can be quite confusing and overwhelming.
The most significant recent development is NinjaCat's AI Agent Showcase: a growing library of task-specific agents that operate on top of the Data Cloud.
Key Features
- 100+ pre-built connectors
- No-code transformations and calculations
- Data transfer to BI tools and data warehouses
- Easy ad spend and campaign performance monitoring
- White-label options
- White-glove setup and service
NinjaCat Reviews from Real Users
“I love how it pulls in our data across several different platforms into one cohesive report.” (Source)
“The support the NinjaCat provides is exceptional.” (Source)
“I found a lot of the functionality on Ninjacat to be really clunky, unfortunately things take a LONG time to process if you're adding more than one filter to a table.” (Source)
Pros:
- Automated client reporting
- One platform for integration and visualization
- Multiple choice of destinations
- Custom branded reports
Cons:
- Separate workspaces to organize and visualize data
- Complex visualization builder
- Performance issues with reports
- No autosave in case of a crash
Pricing
Pricing is flat-rate and custom, no metered usage or per-connector charges.
Published on Nov 08 2024
WRITTEN BY
YamonYamon is a Senior Content Marketing Manager at Whatagraph. With an eye for detail and a knack for always considering context, audience, and business goals to guide the narrative, she's on a mission to create genuinely helpful content for marketers. When she’s not working, she’s hiking, meditating, or practicing yoga.