TL:DR
TapClicks is a comprehensive marketing platform that helps businesses and agencies manage, analyze, and report on all their marketing data in one place.
Who it’s best for:
Large agencies or enterprises with complex data needs, especially if you’ve got a data person on hand to manage the backend and you're comfortable paying extra for more features.
Key features at a glance:
| Feature | TapClicks |
| Integrations | 250+ sources (if you’re on the more expensive plans) |
| Stable connections | Connectors break more often than you'd like |
| Ease of use | Not beginner-friendly; takes time to learn |
| Data blending | Available |
| Internal dashboards | Included in higher-tier plans |
| Customizable reports | Strong customization (but locked behind paywalls) |
| Report sharing & automation | Scheduled emails, PDF, Excel, Powerpoint, live links |
| Security | SOC 2 Type II and SOC 3 certified, GDPR-compliant, MFA, 2FA, and SSO, audit logs, role-based user permissions |
Pros ✅
- Wide range of integrations (250+ sources on higher-tier plans)
- Great for large-scale, multi-channel reporting
- Offers strong automation and white-labeling options
- Includes AI features like smart summaries and prescriptive analytics
Cons ❌
- Steep learning curve, not beginner-friendly
- Connectors often break or glitch, causing delays in data
- Interface feels outdated and clunky to use
- Most powerful features are locked behind expensive add-ons
- Pricing is confusing and stacks up fast if you're not careful
Why You Can Trust This Review
At Whatagraph, we don’t write reviews from afar. We work directly with agencies and in-house marketing teams running real campaigns across Google Ads, Meta, Shopify, LinkedIn, and custom CRM pipelines. We’ve built dashboards, debugged integrations, and sat in on client pitch meetings where the report had to work.
For this TapClicks review, we:
- Built a new TapClicks workspace from scratch and connected the works—GA4, HubSpot, Shopify, Meta, and a sample SQL table.
- Timed how long it took to go from "data connected" to "client-ready dashboard"—without prior training.
- Read 100+ verified G2, Capterra, and Software Advice reviews—prioritizing those with specifics.
Our goal is to help you make an informed decision, whether that leads you to TapClicks, to Whatagraph, or to another solution entirely.
TapClicks Pricing
TapClicks offers a modular pricing model and gives you the option to “Build My Plan” according to your team’s needs.
The structure is primarily a two-step process:
- Selecting a base "TapData" package for data connection and data management; and
- Choosing a "Data Destination" for reporting, analytics, or insights.
For Step 1, I’ve chosen the TapData+ plan which starts at $349 and is designed for “growing teams.”
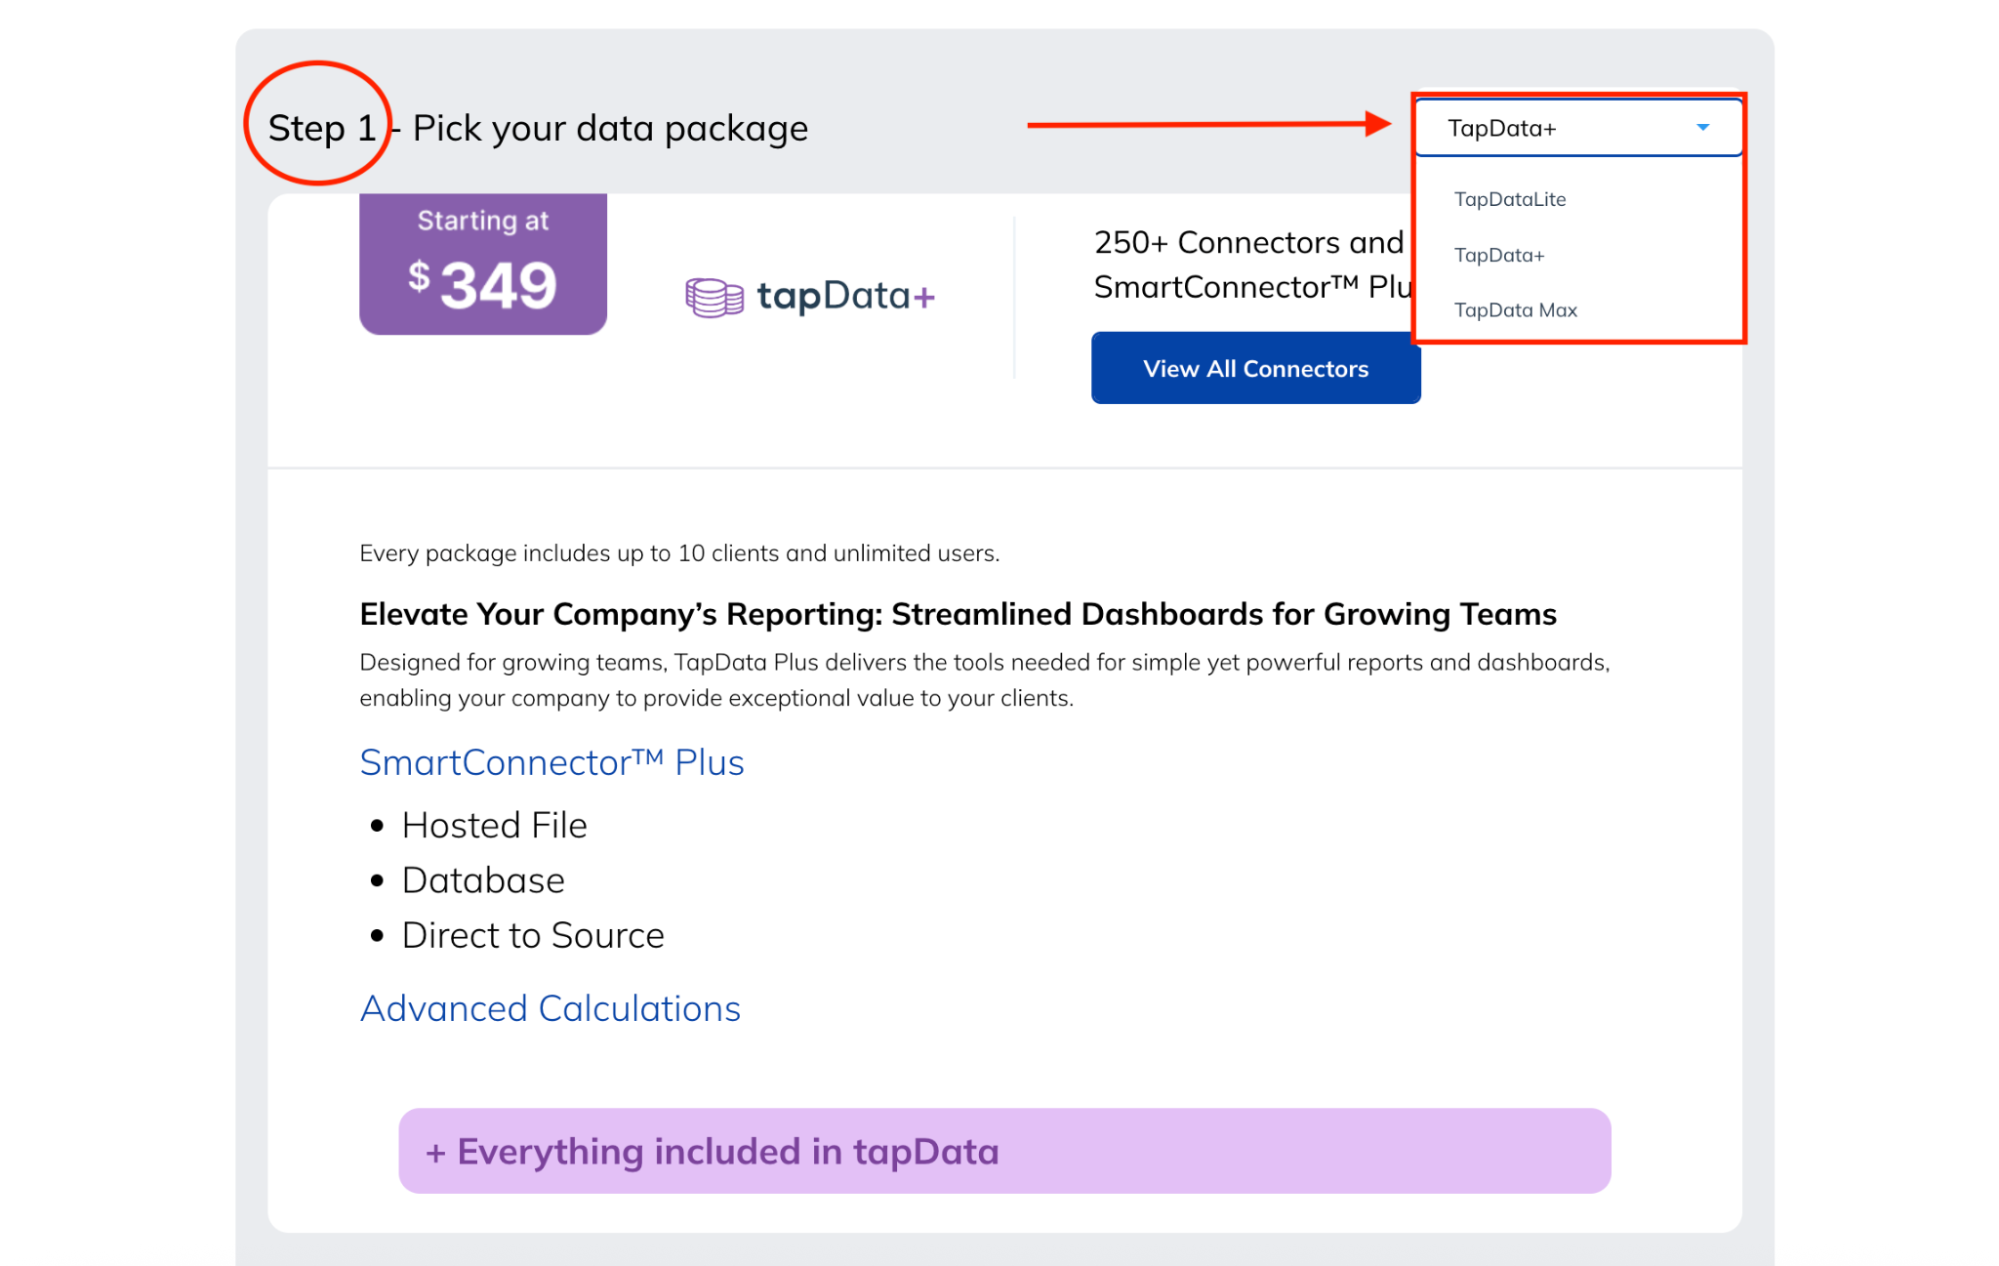
Overall, here’s how the plans break down for Step 1:
Plan | Starting Price | What You Get |
| TapData Lite | $99/month | 64 connectors + manual import tools (SmartConnector™ Basic) |
| TapData+ | $349/month | 250+ connectors + hosted file, DB access, direct-source sync (SmartConnector™ Plus) |
| TapData Max | $649/month | Everything in TapData+, plus: outbound data export, TapAPI, auto-assignment, multi-destination |
Heads up: These tiers are only about data ingestion. If you want to build reports, share dashboards, or pull insights—you still need a reporting layer. That’s where Step 2 comes in.
Now that your data is flowing in via your TapData plan, you need to decide how you want to visualize, analyze, and act on it. This is where you choose your "destination" or interface for marketing analytics.
For Step 2, I'm going with TapInsights.
Here’s my thinking: since I’ve already committed to TapData+ for muscular data collection, just having basic reporting (TapReports) feels like I wouldn't be using my data's full potential.
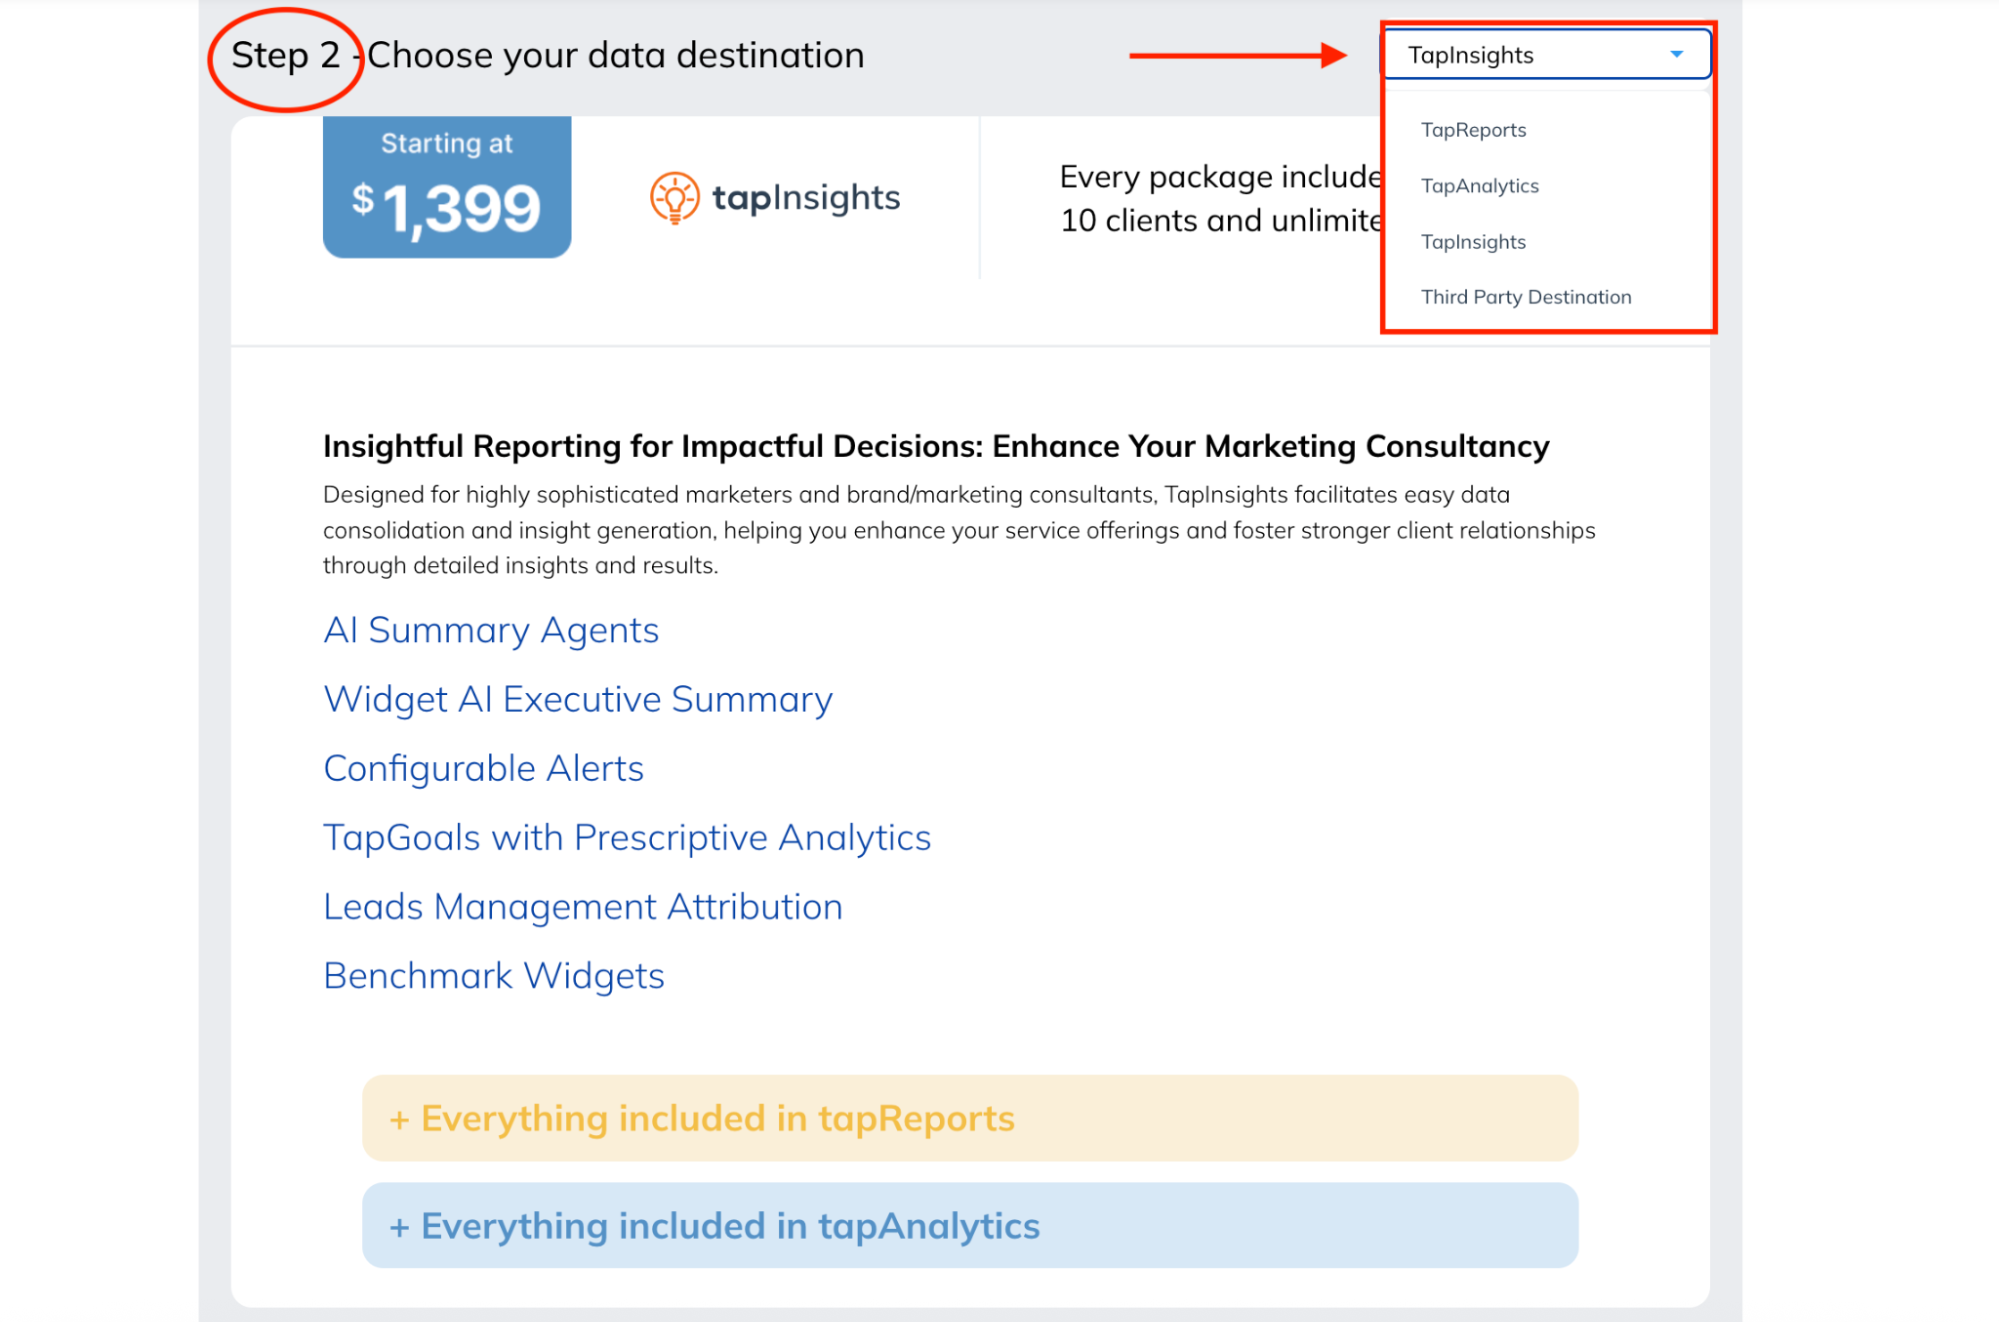 Here’s how the pricing for data destinations breaks down:
Destination | Starting Price | What You Get |
| TapReports | $199 | Report Automation, Report Studio (for customization & branding), Data Source Overview, Quick Reports, Pre-Defined Channels, Advanced Calculations |
| TapAnalytics | $899 | Includes all TapReports features, plus: Interactive Dashboards, Custom Channels, Margin & Markup Rules, Data Lookups, Smart Campaigns |
| TapInsights | $1,399 | Includes all TapAnalytics features, plus: AI Summary Agents, Widget AI Executive Summary, Configurable Alerts, TapGoals with Prescriptive Analytics, Leads Management Attribution, Benchmark Widgets |
| Third-Party Destination | Custom | Capability to send data to your own Business Intelligence (BI) tools or data warehouse. (Typically requires TapData Max for features like Data Exporter & TapAPI Access) |
So, my "Build My Plan" setup looks like this:
- Step 1: TapData+ ($349)
- Step 2: TapInsights ($1,399)
But the thing is, that $349 + $1,399 is still not my actual package price, because now I’m nudged to “Submit For Quote.”
 That gives me a ballpark of $1,748.
But as we’ve established, that "Submit For Quote" button means this isn't the final check you’ll be writing.
On Capterra, a user shares that although they think TapClicks is a “very good tool for digital marketing,” the rub is in their pricing especially for smaller agencies: “Can be very expensive if you go into Premium elements. As for a small company the price can rise very fast.”

What does TapClicks’ pricing mean for your budget?
- Budget for two “core” plans: Your total TapClicks cost will always combine a TapData plan (for connecting your data) AND a Data Destination plan (for what you do with that data—reports, dashboards, AI). Don't budget for just one.
- If you have more than 10 clients? The "starting at" prices for TapAnalytics and TapInsights include up to 10 clients. If your agency serves more clients than this, your quoted price will be higher.
- The starting price isn’t the final price: Once you click "Build My Plan," you’ll still be nudged to “Submit for Quote.” Final pricing depends on your data volume, number of clients, support needs, and any extra connectors or API usage.
In short: TapClicks gives you options. But most agencies need at least TapData+ + TapAnalytics to function smoothly. And many end up closer to $2k/month once the real numbers are in.
Whatagraph, on the other hand, takes a more direct and personalized route to arrive at your ideal solution and price.
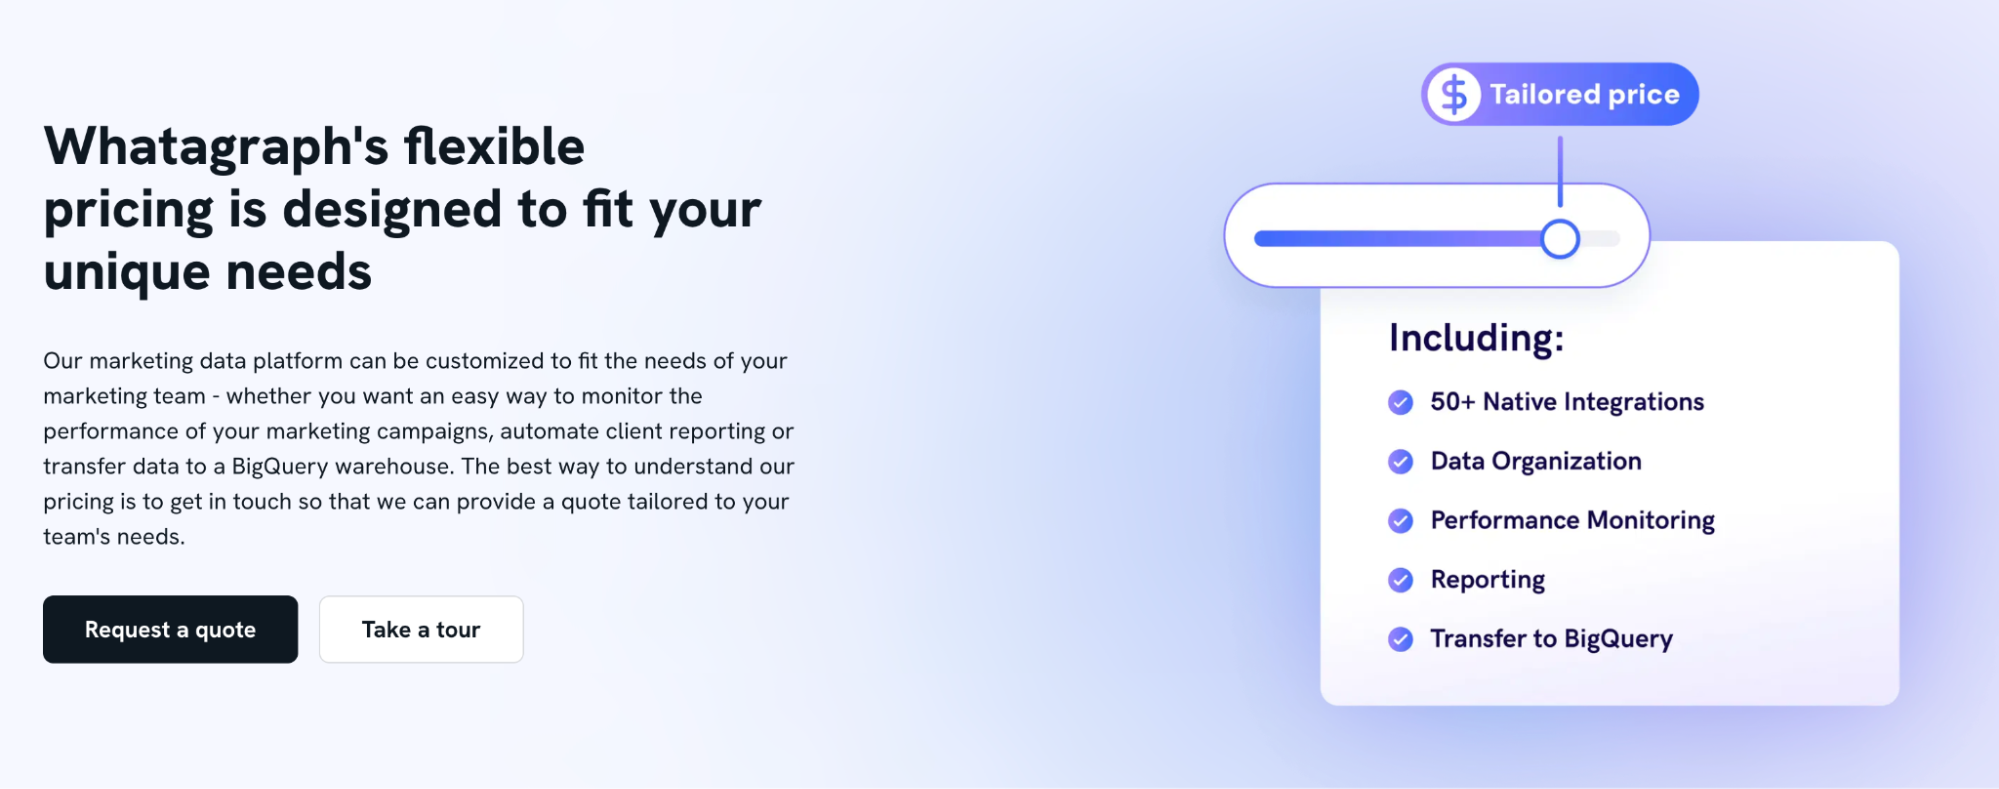 Instead of you first trying to piece together various pre-defined modules and their "starting at" prices, Whatagraph prioritizes a conversation about your agency's actual requirements from the outset.
Real User Reviews: What are Customers Saying About TapClicks?
I scanned 100+ reviews from G2, Capterra, Software Advice, YouTube videos, and Reddit threads to find the themes that came up again and again.
Not one-off hot takes—recurring patterns.
TapClicks pros: What users love
✅ All-in-one data aggregation and reporting
Users love the feeling of control—finally getting diverse data from social media (like Meta and LinkedIn), Google Ads, HubSpot, and their custom CRM under one roof.
Like Ahmad S., a Connectivity Software Engineer who says:
What I like best about TapClicks is that it simplifies marketing data by pulling everything into one easy-to-use dashboard. This saves time on reporting and gives clear insights to optimize campaigns quickly.
This single-pane-of-glass setup saves hours and makes it easier to spot trends across channels.
✅ Boost in productivity and time savings
If you’re still stitching together Excel reports or pasting screenshots into decks, TapClicks feels like a relief.
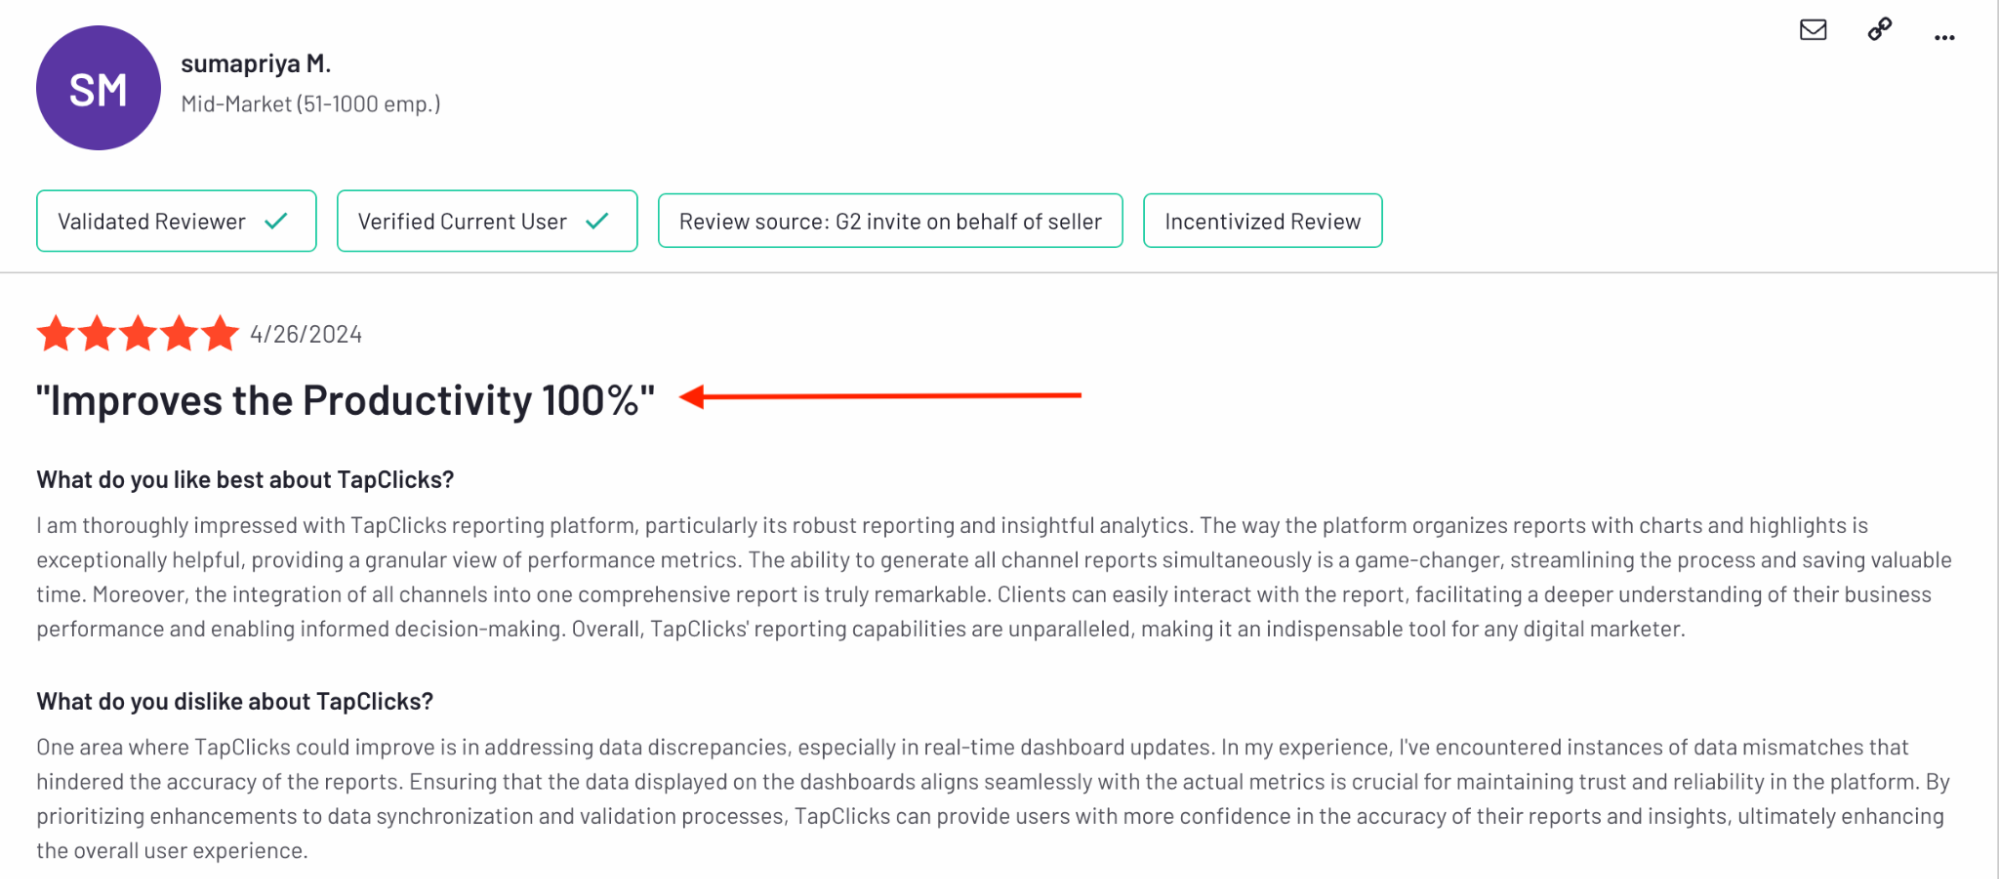
One reviewer called it “unparalleled” for digital marketers, and says that TapClicks improves “productivity 100%.”
 ✅ Customizable dashboards with granular client view control
Users also appreciate being able to design internal dashboards for deep performance reviews—while creating simpler, cleaner views for clients. You don’t have to show raw metrics if they just want high-level KPIs.
Katie w., a Digital Media Buying Supervisor shares on G2:
Internally we're able to track performance and see what we need to see while also having a dashboard for our clients that has all the information from the same campaigns but with the information laid out in a way the client can understand.
TapClicks cons: Where users get frustrated
❌ Steep learning curve
Several users find the platform challenging to get started with, noting a difficult initial setup process and a steep learning curve for creating essential components like widgets.
If you’re looking for a user-friendly marketing operations platform end-to-end, hit pause on TapClicks for a moment.
A verified user on G2 gives Tapclicks feedback that it's “not always the most intuitive to use, lots of steps to connect data.”
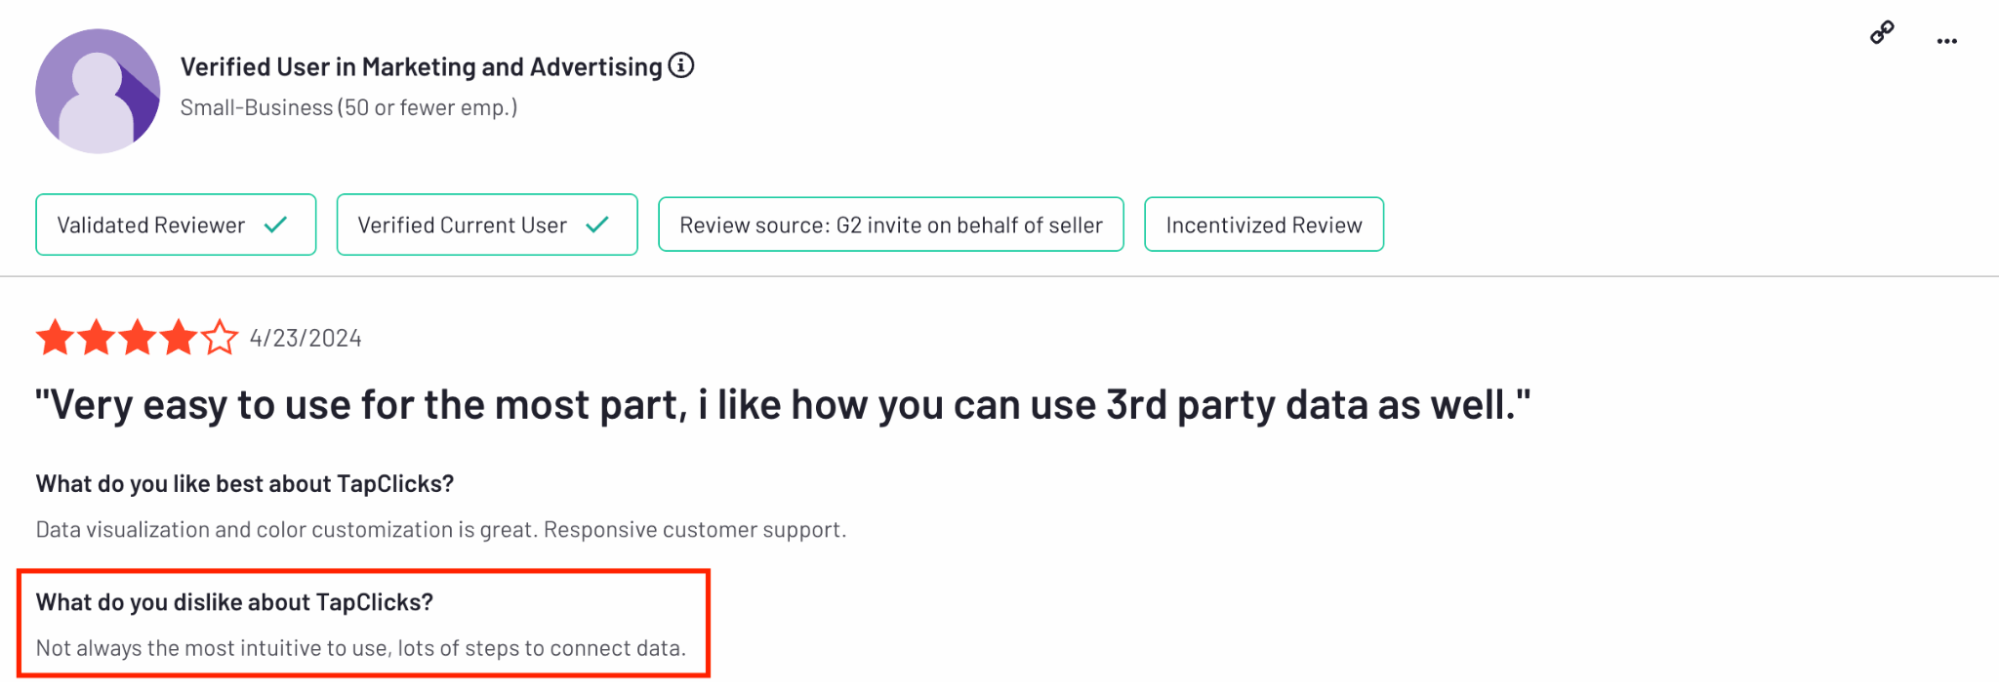 This isn’t a plug-and-play platform. New users regularly call out how unintuitive the interface is—from report setup to widget configuration.
A five-star reviewer also echoes this frustration:
The initial setup can take a bit, including a steep learning curve for some agency staff.
❌ Data inaccuracies and lag times
Data accuracy is everything in client reporting. But several users called out lagging dashboards and mismatched metrics. Some even had to manually edit widgets before sharing them. That kind of manual patchwork erodes confidence.
Even in an incentivized review, for example, John A. shares:
…data not always correct, lag time. I don't like the way it logs you out within 10 minutes.
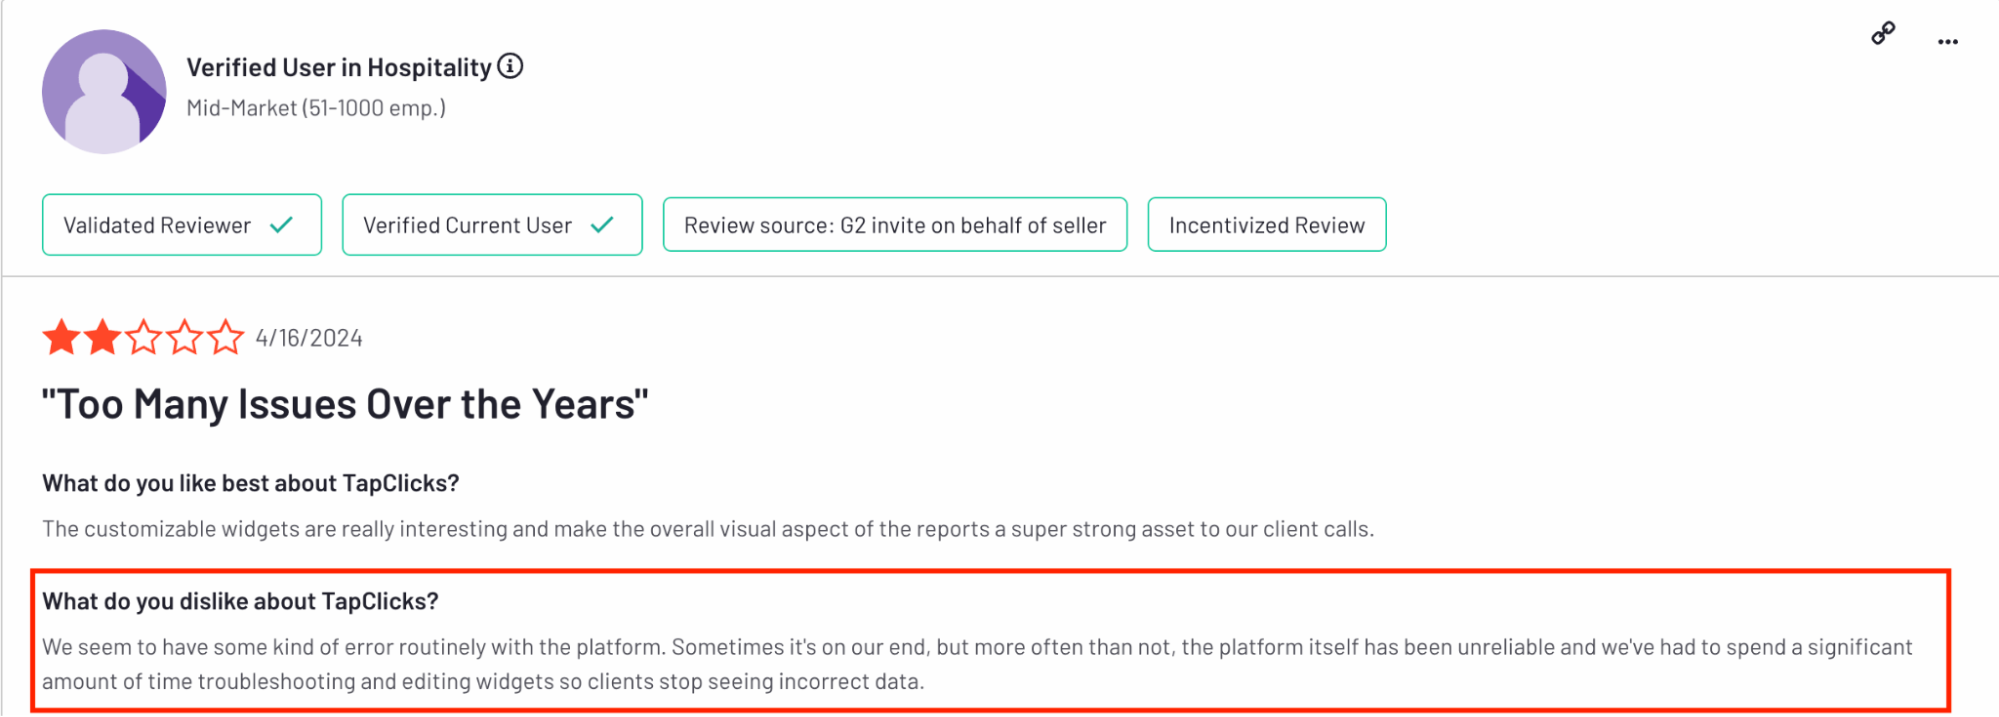
Another verified user complains that they’ve had “too many issues over the years”: “...the platform itself has been unreliable and we've had to spend a significant amount of time troubleshooting and editing widgets so clients stop seeing incorrect data.”
 ❌ Support is slow when it matters most
TapClicks support isn’t unreliable—it’s slow. That might not be a dealbreaker during onboarding, but when you’re under pressure to deliver a client report, a 48-hour response window just doesn’t cut it.
slow to fix bugs, slow to respond to critical errors in the platform.
Check out our guide to TapClicks alternatives for 2026.
Feature Deep Dive #1: TapClicks Ease of Use
How quickly can your team get up and running?
Let's dig into what "easy" means in the TapClicks world.
Are there ready-to-use templates and drag-and-drop features?
Let's tackle the first part of the question: templates.
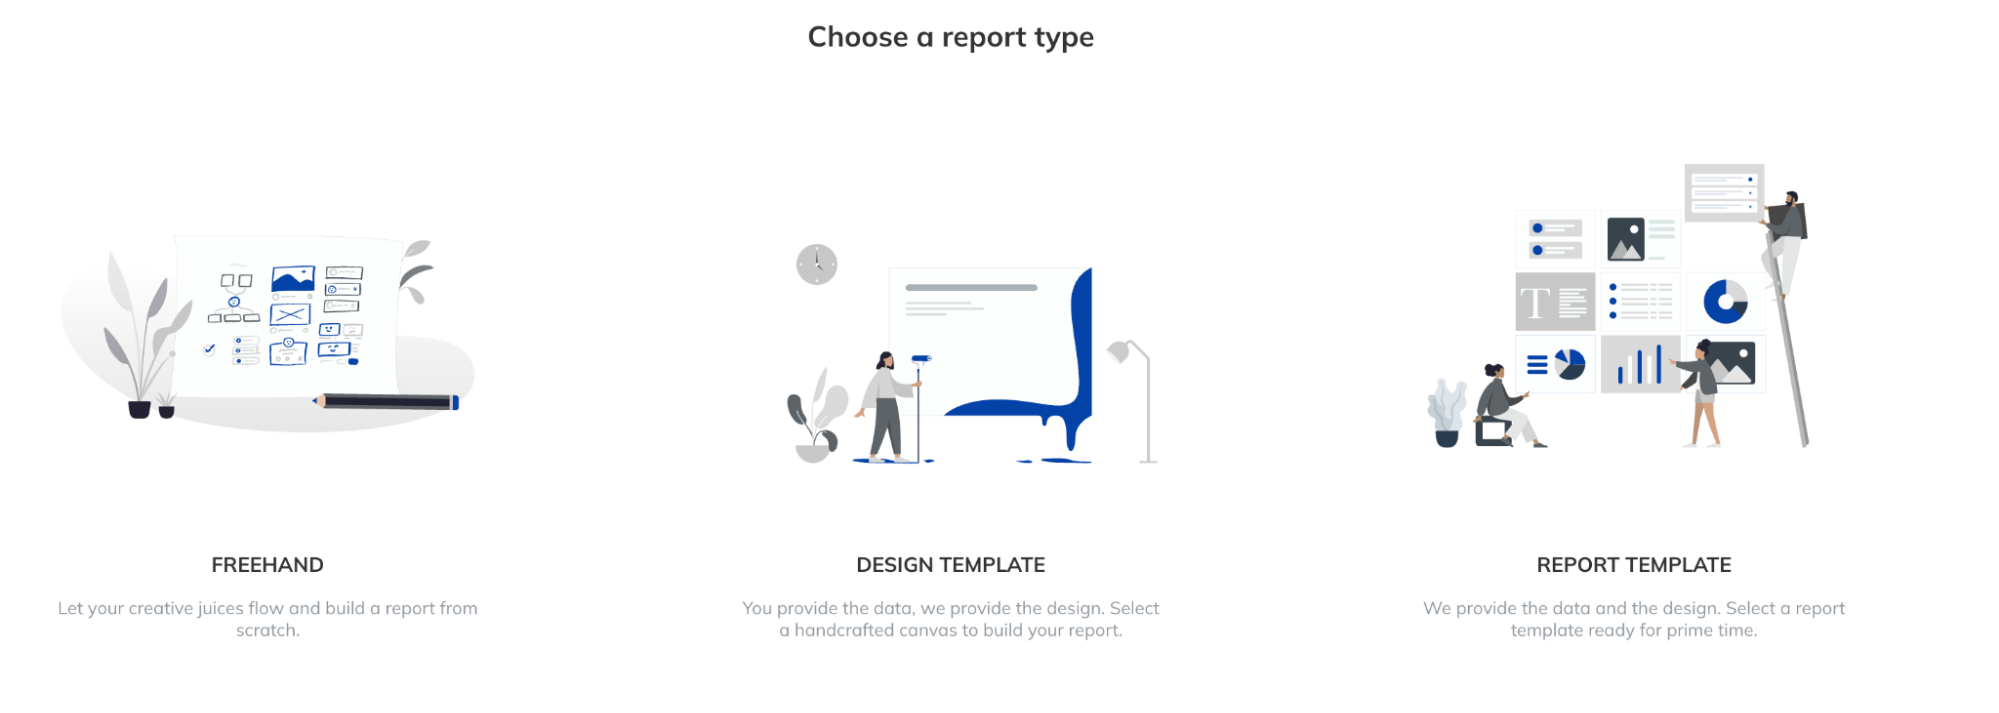 Yes, TapClicks generally gives you a few paths. As you can see from common starting points in the platform, you typically get to choose from three main options to build your reports once data is connected:
- Freehand: Basically, you’re staring at a blank canvas. As TapClicks puts it, "Let your creative juices flow and build a report from scratch." For those who want total control and have a clear vision.
- Design Template: Here, TapClicks says, "You provide the data, we provide the design." You pick a "handcrafted canvas" to build your report upon. A bit of a head start on the looks.
- Report Template: This is the most "ready-to-use" option. "We provide the data and the design. Select a report template ready for prime time." This sounds like the quickest way to get something out the door.
Now for the second half of the question: drag-and-drop.
This is where things get a little more “clicky” than you might expect.
When building your report layout, you’re not dragging widgets out of a side panel like you would in Whatagraph.
You first have to click to insert a widget. Then, choose between three types:
- Data Widget (for charts, KPIs, tables).
- Media Widget (images, videos).
- Admin Widget (pagination, notes, logos).
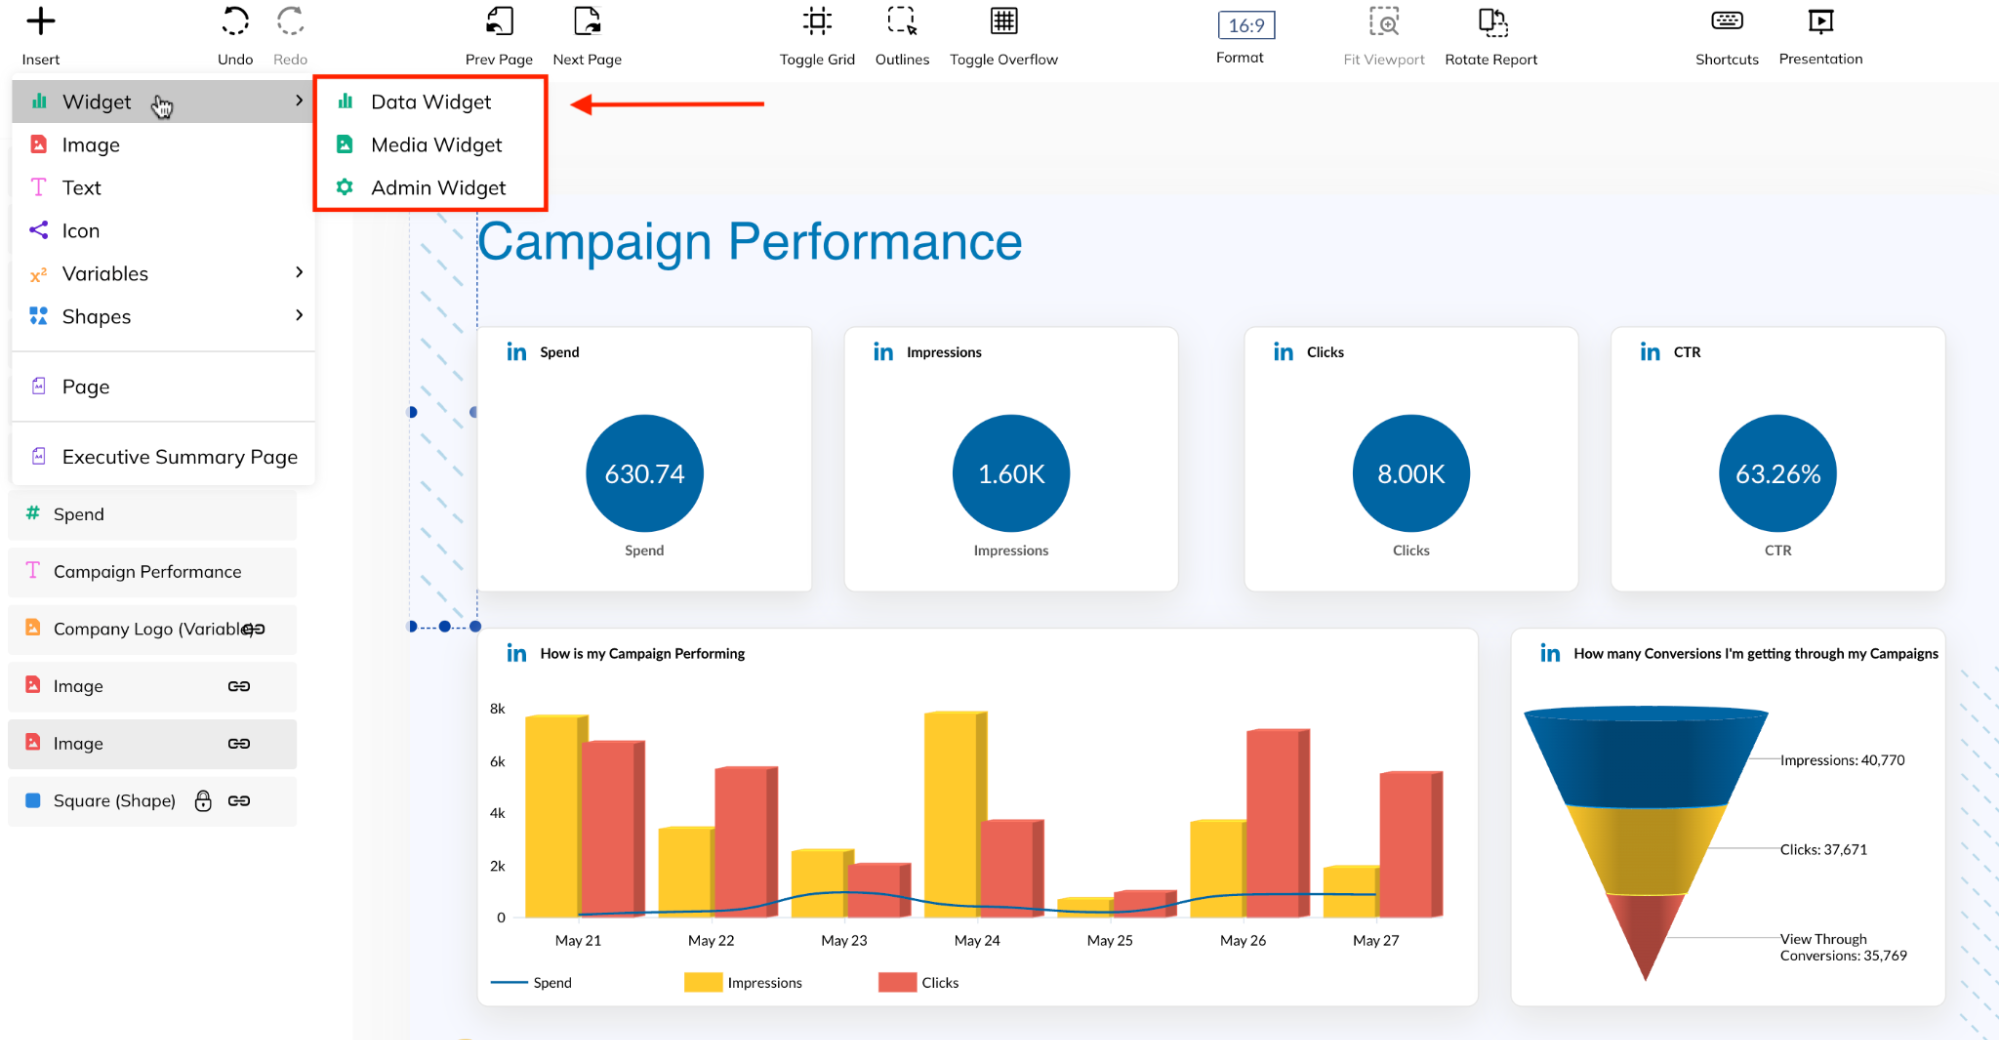 Every single data visualization element starts with a menu click. You can’t just drag a “CTR” block or “Spend” chart onto the canvas from a sidebar.
But, once the widget is on the page, you can move it around. TapClicks uses a grid-based layout that lets you drag, reposition, and resize existing widgets.
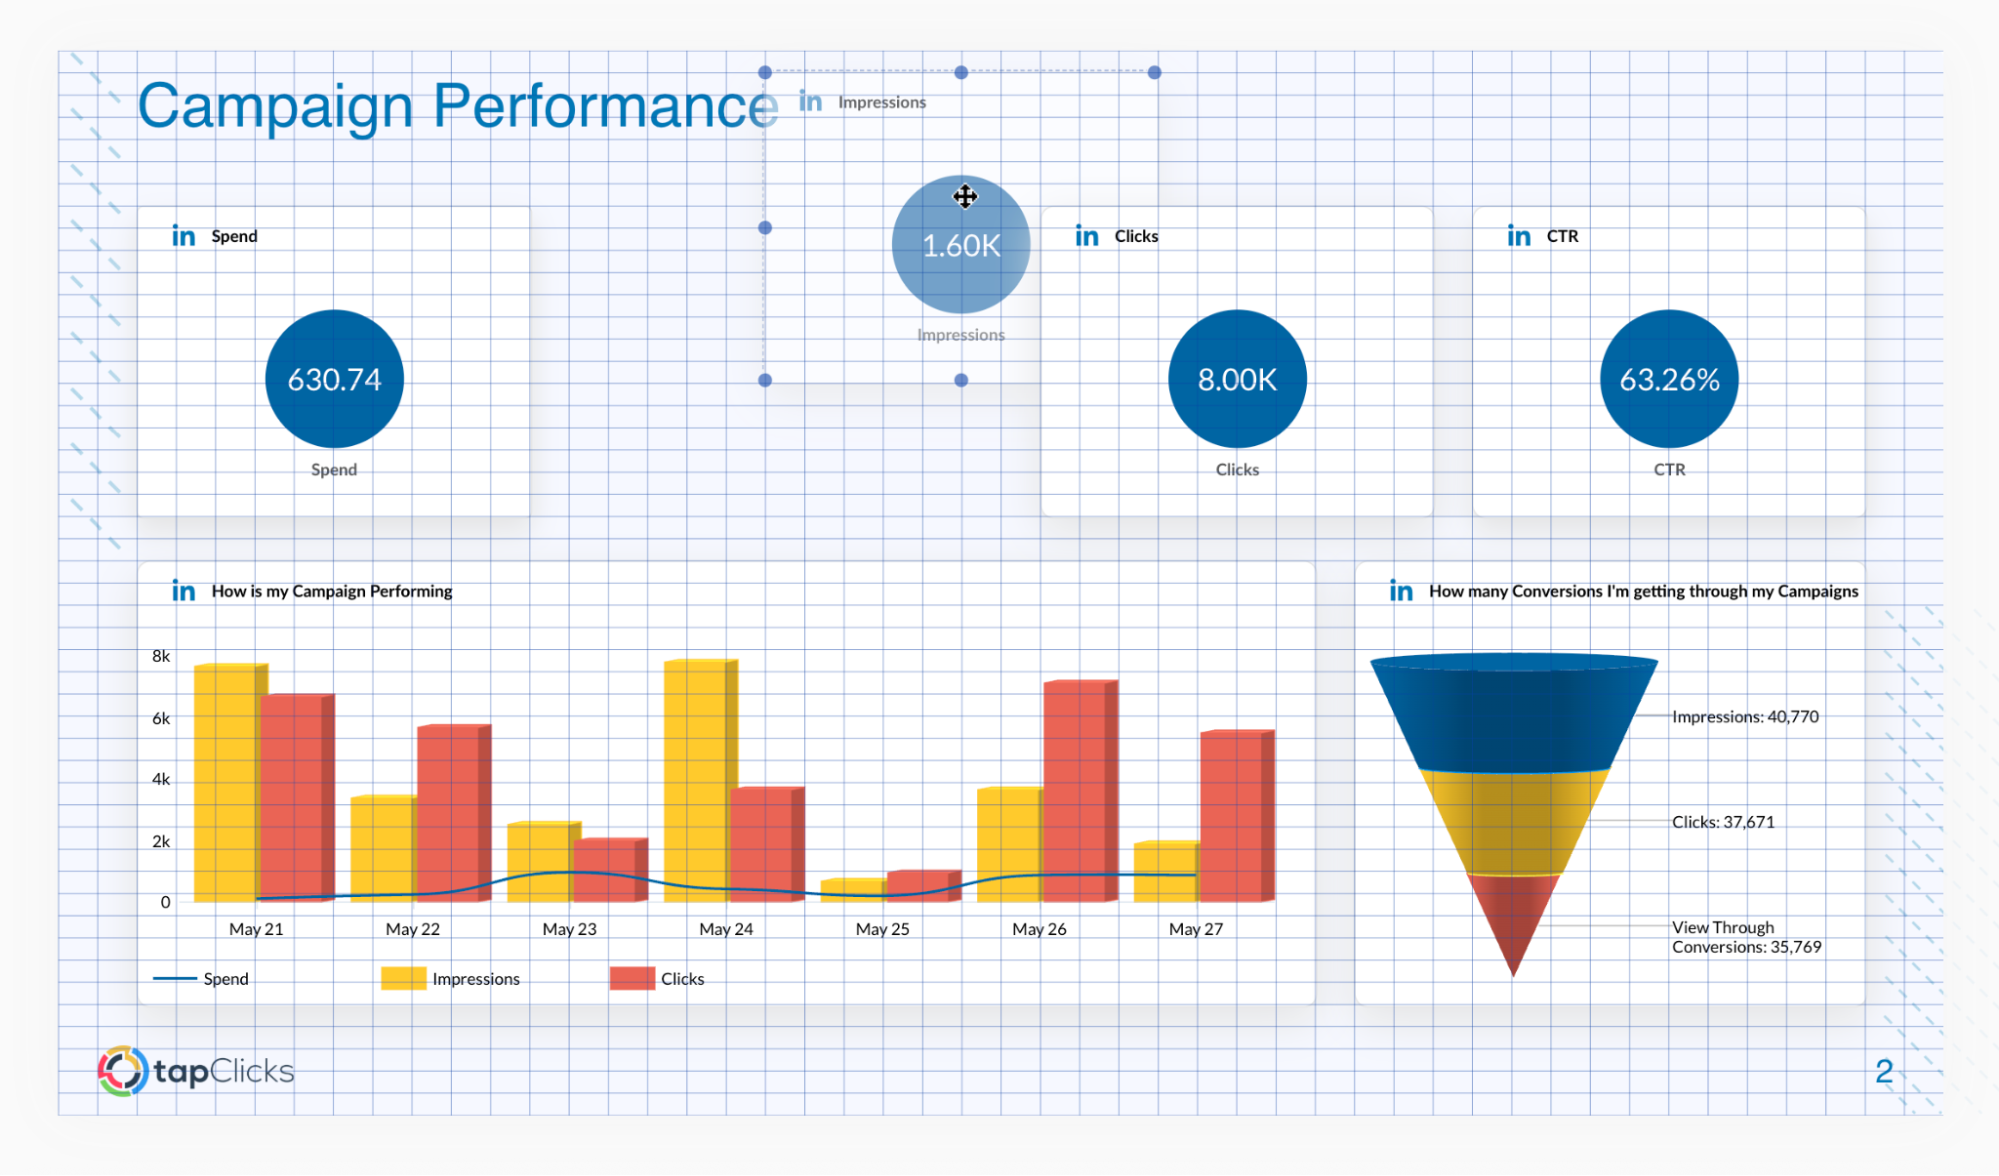 The drag-and-drop experience is more like moving furniture around after you've placed it.
That may not matter if you’re reusing a few go-to layouts. But if your team builds a lot of custom dashboards—or frequently adjusts reports with new metrics, designs, or layouts—you’ll feel the friction over time.
The clicks add up.
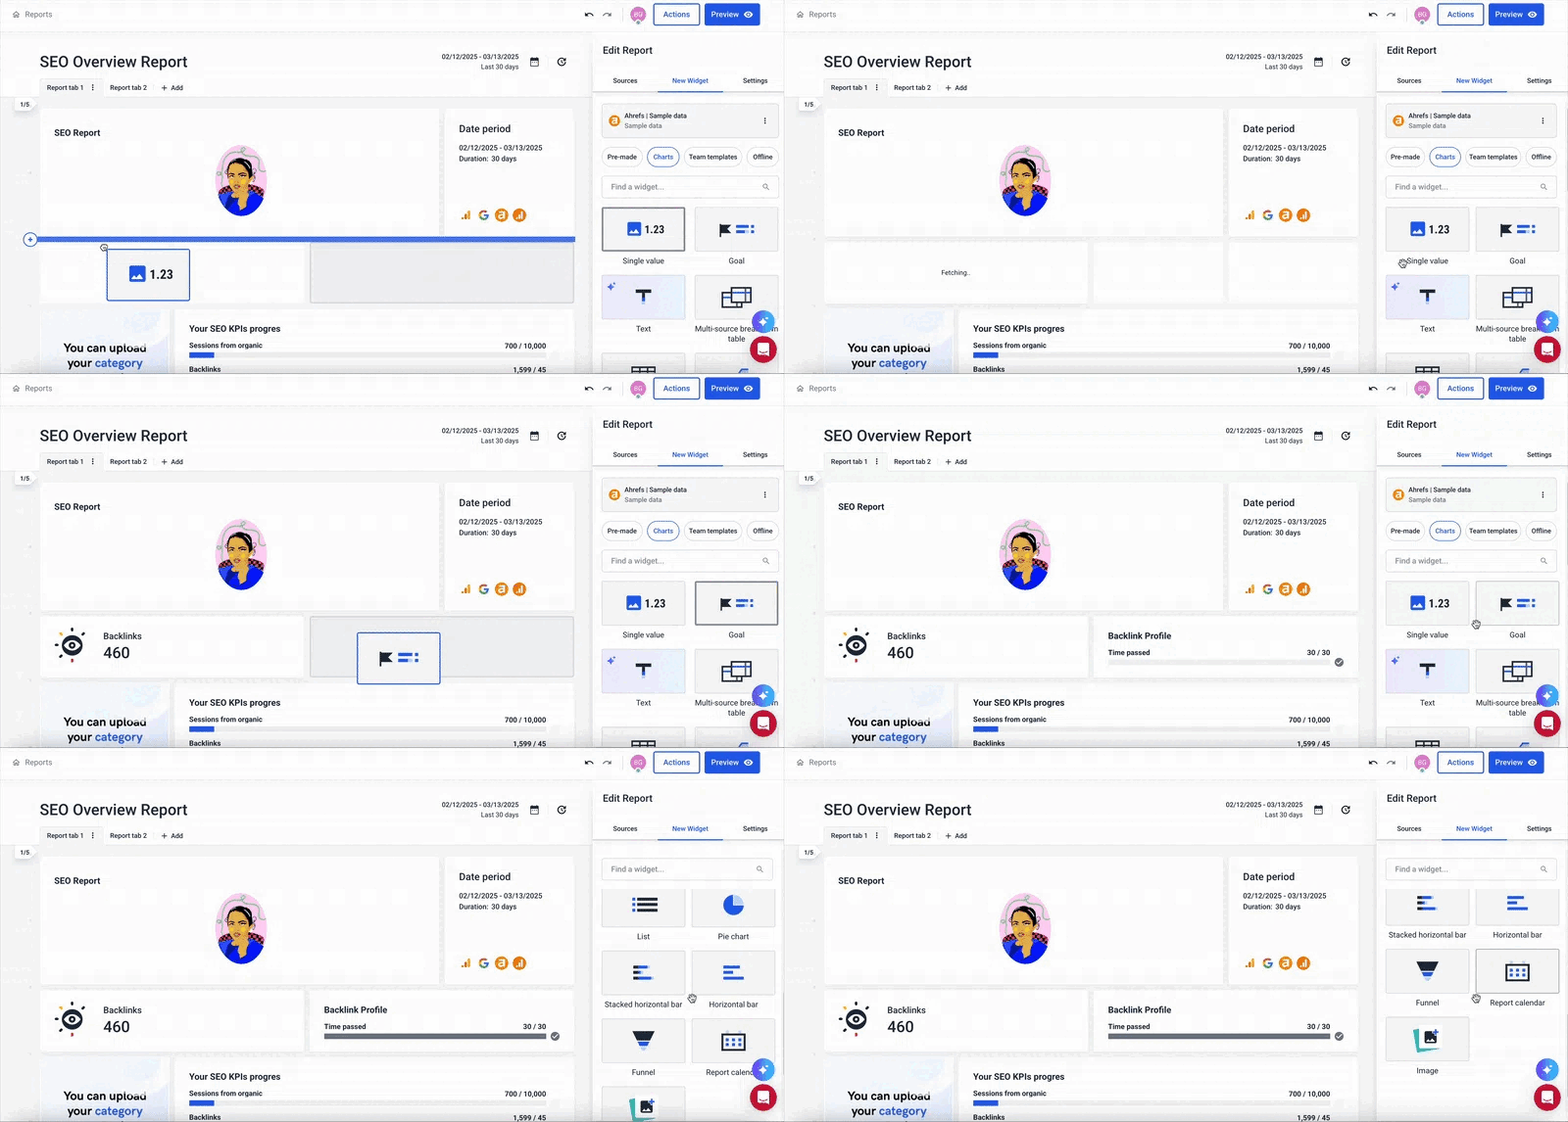
Now compare that to Whatagraph, where you drag widgets straight from the sidebar onto the grid.
One move. One second. Done.
Is everything housed in one marketing reporting environment?
TapClicks says it’s an all-in-one platform. And to be fair, it is all under one login.
You’ve got TapData for ingestion, TapAnalytics for dashboards, TapReports for output, and even TapWorkflow for marketing campaign ops.
On paper, that’s end-to-end coverage.
But “all-in-one” doesn’t always mean all-in-one UX.
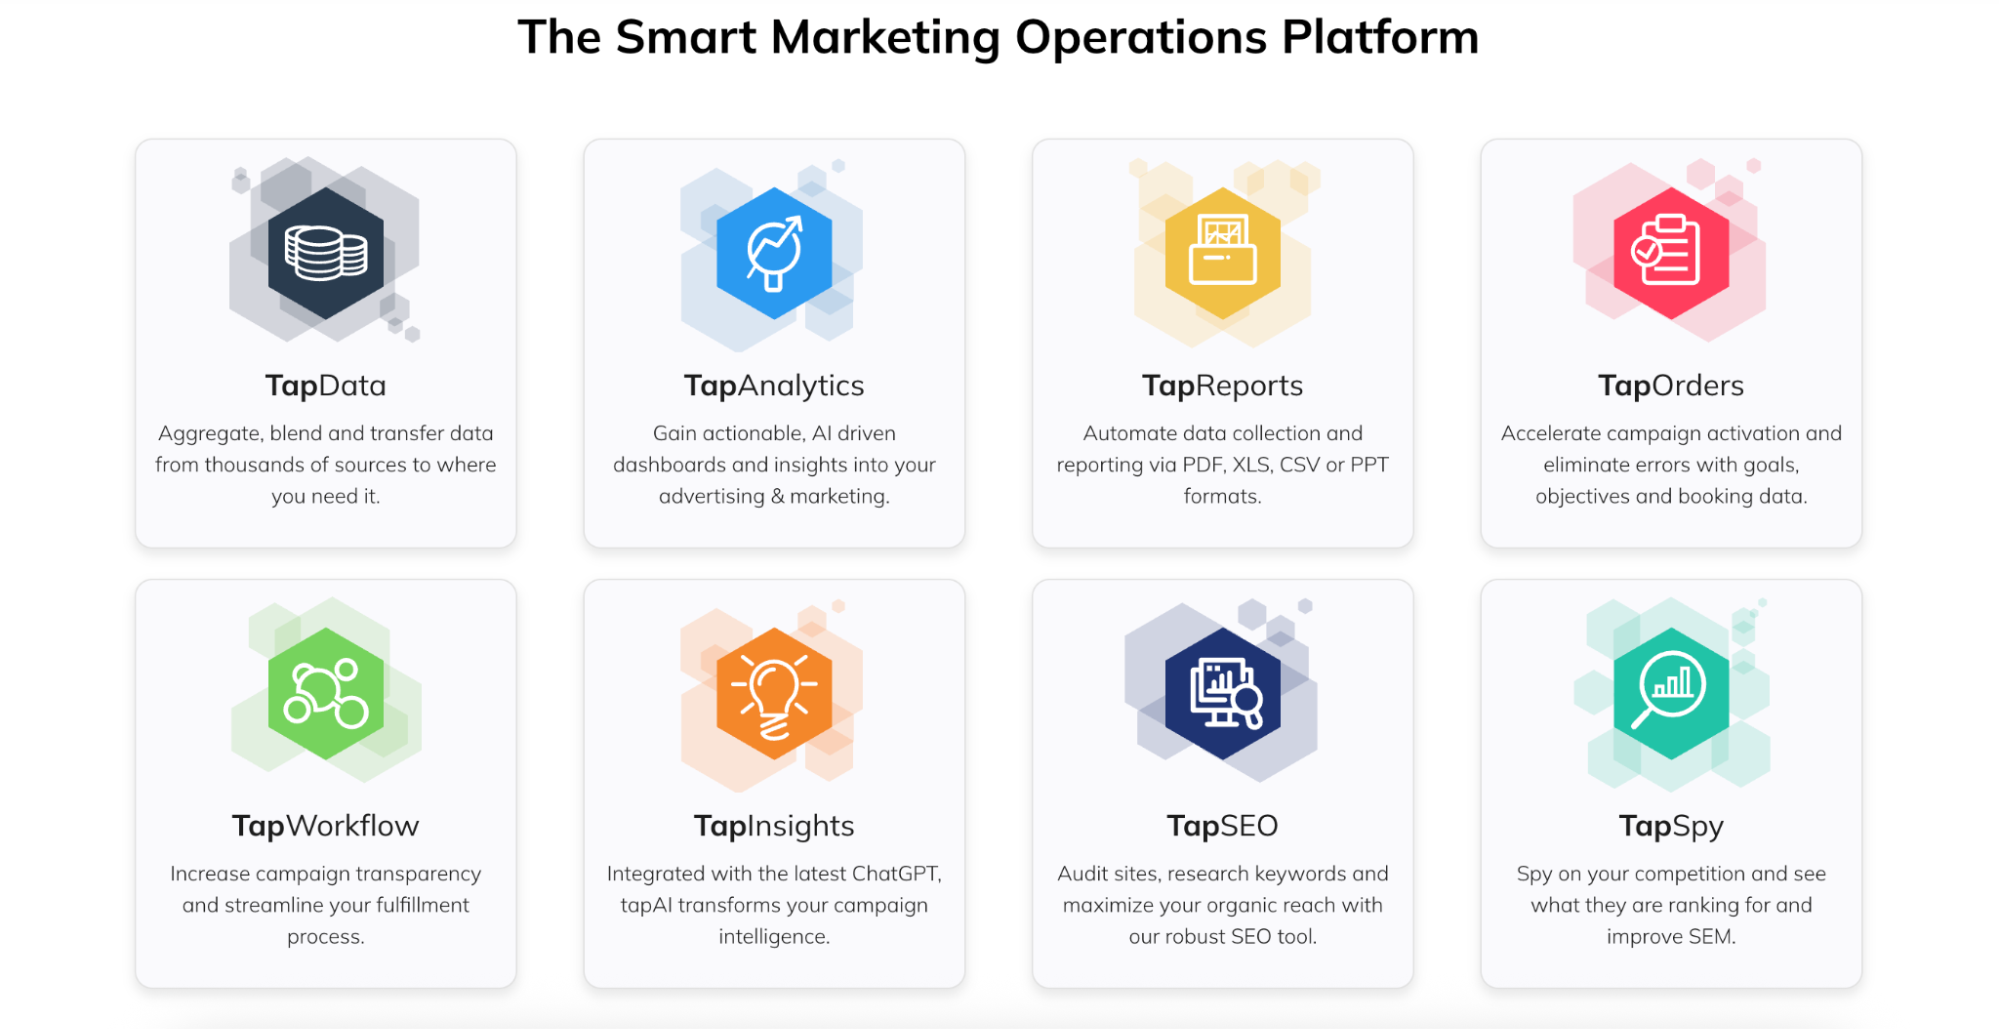 You’re not working from a single, unified canvas.
You’re jumping between dashboards, widget builders, report templates, and schedulers—each tucked into its own tab, with its own menu, its own new “workspace.”
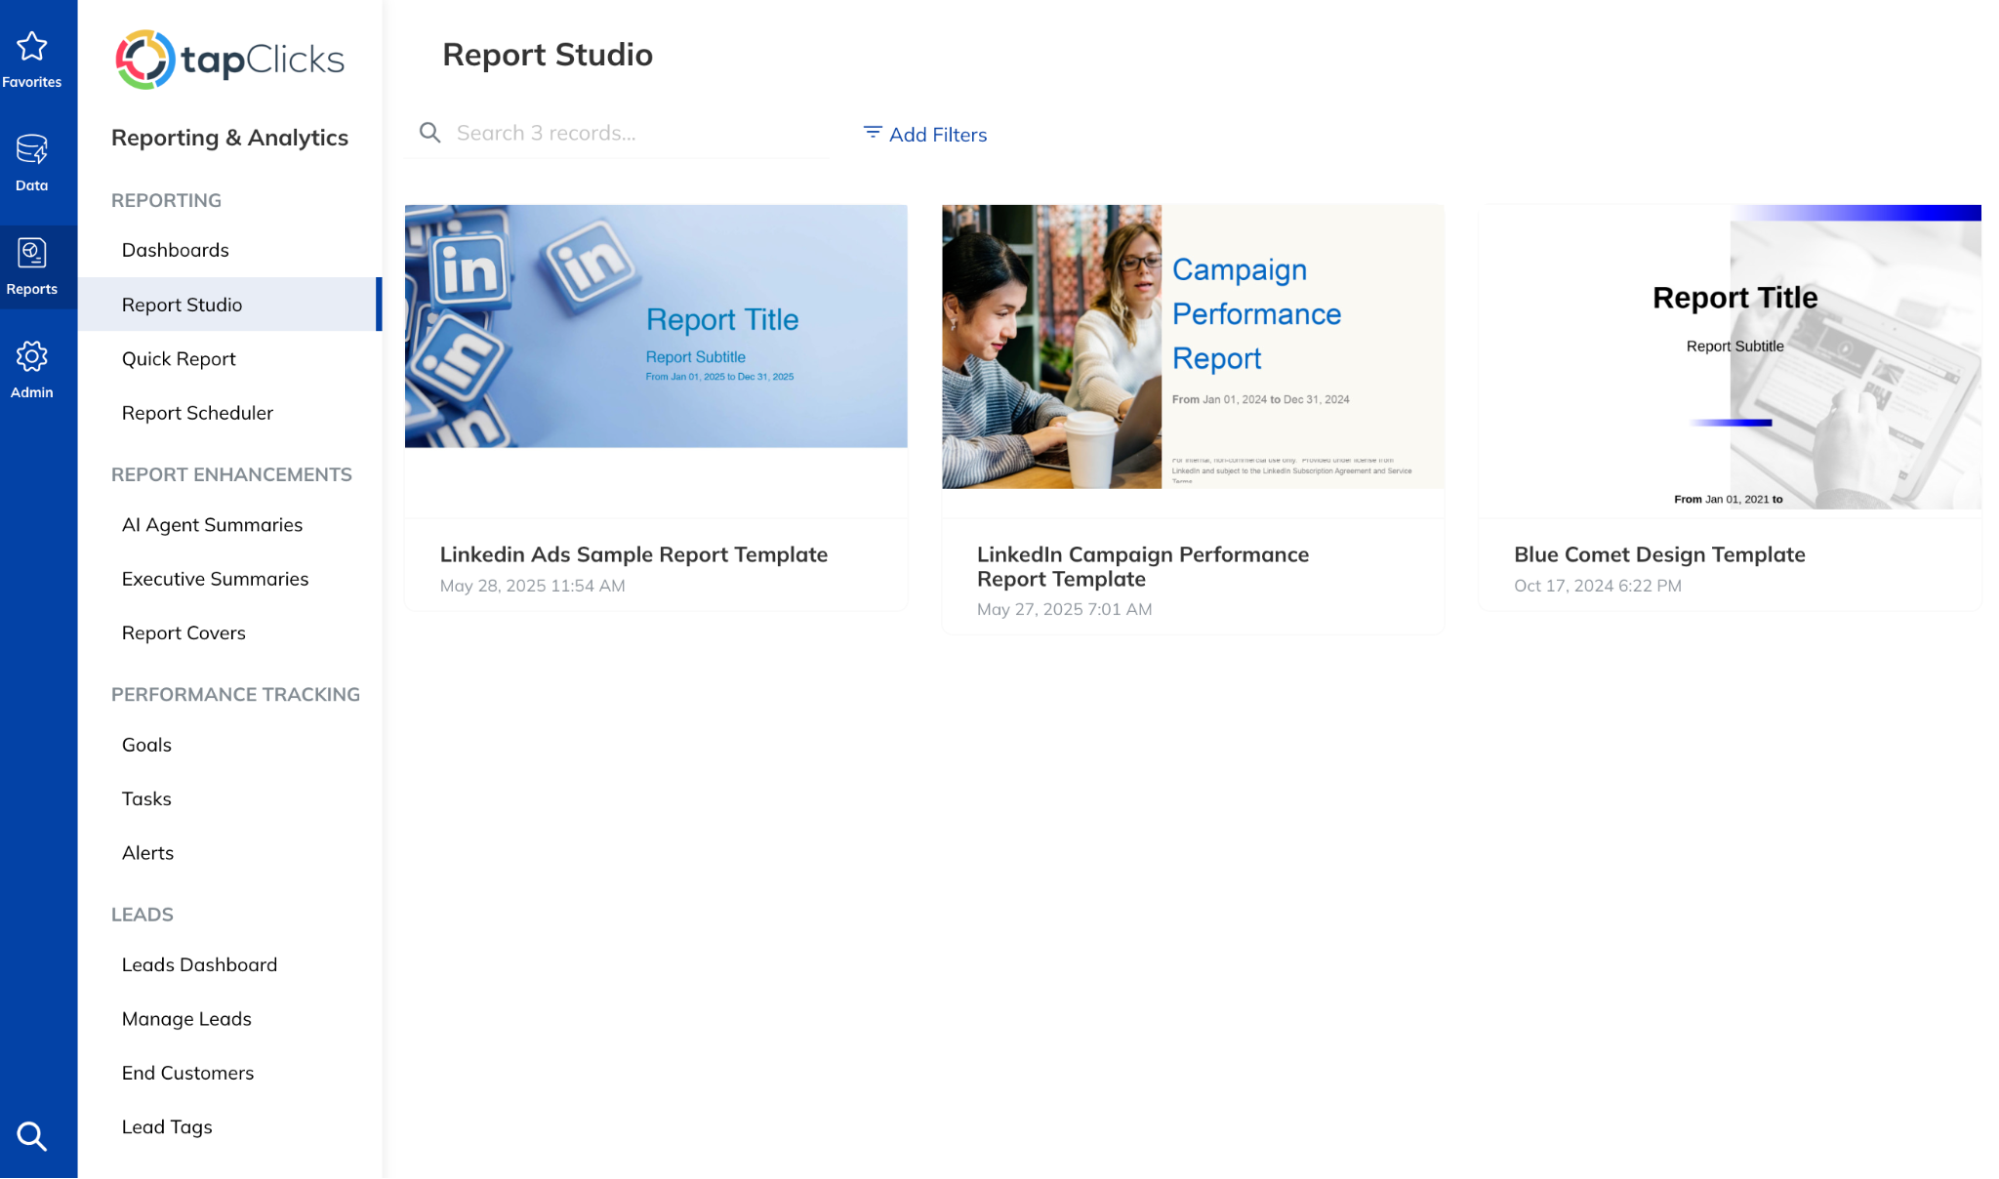 All this switching between workspaces—”workspace hopping”—takes up valuable time.
And those hops add up.
Every switch between workspaces is a small mental reset:
—Where’s the filter for that widget again?
—Was that in the dashboard tab or the report tab?
—Why is this client’s data live here but not showing there?
Instead of moving smoothly from insight to action, you’re reorienting yourself again and again.
To be clear: TapClicks gives you a lot of power. But you have to know how to move between modules to use that power efficiently.
For lean teams, or those without a dedicated ops manager, the friction can slow down your workflow.
In a recent YouTube review, The Wise Explainer said that the advanced features are probably overkill for you if you don’t really use the “full” capability of the workspace. He adds that “TapClicks is intuitive but onboarding can take time due to the depth of its functionality.”
In other words, the platform has the right parts. But the connective tissue—the UX that ties everything together—is where it falls short.
Compare this to Whatagraph, where dashboards and reports are built in a single editor with unified styling, drag-and-drop layouts, and data blending baked in.
You stay in one view. You build faster.
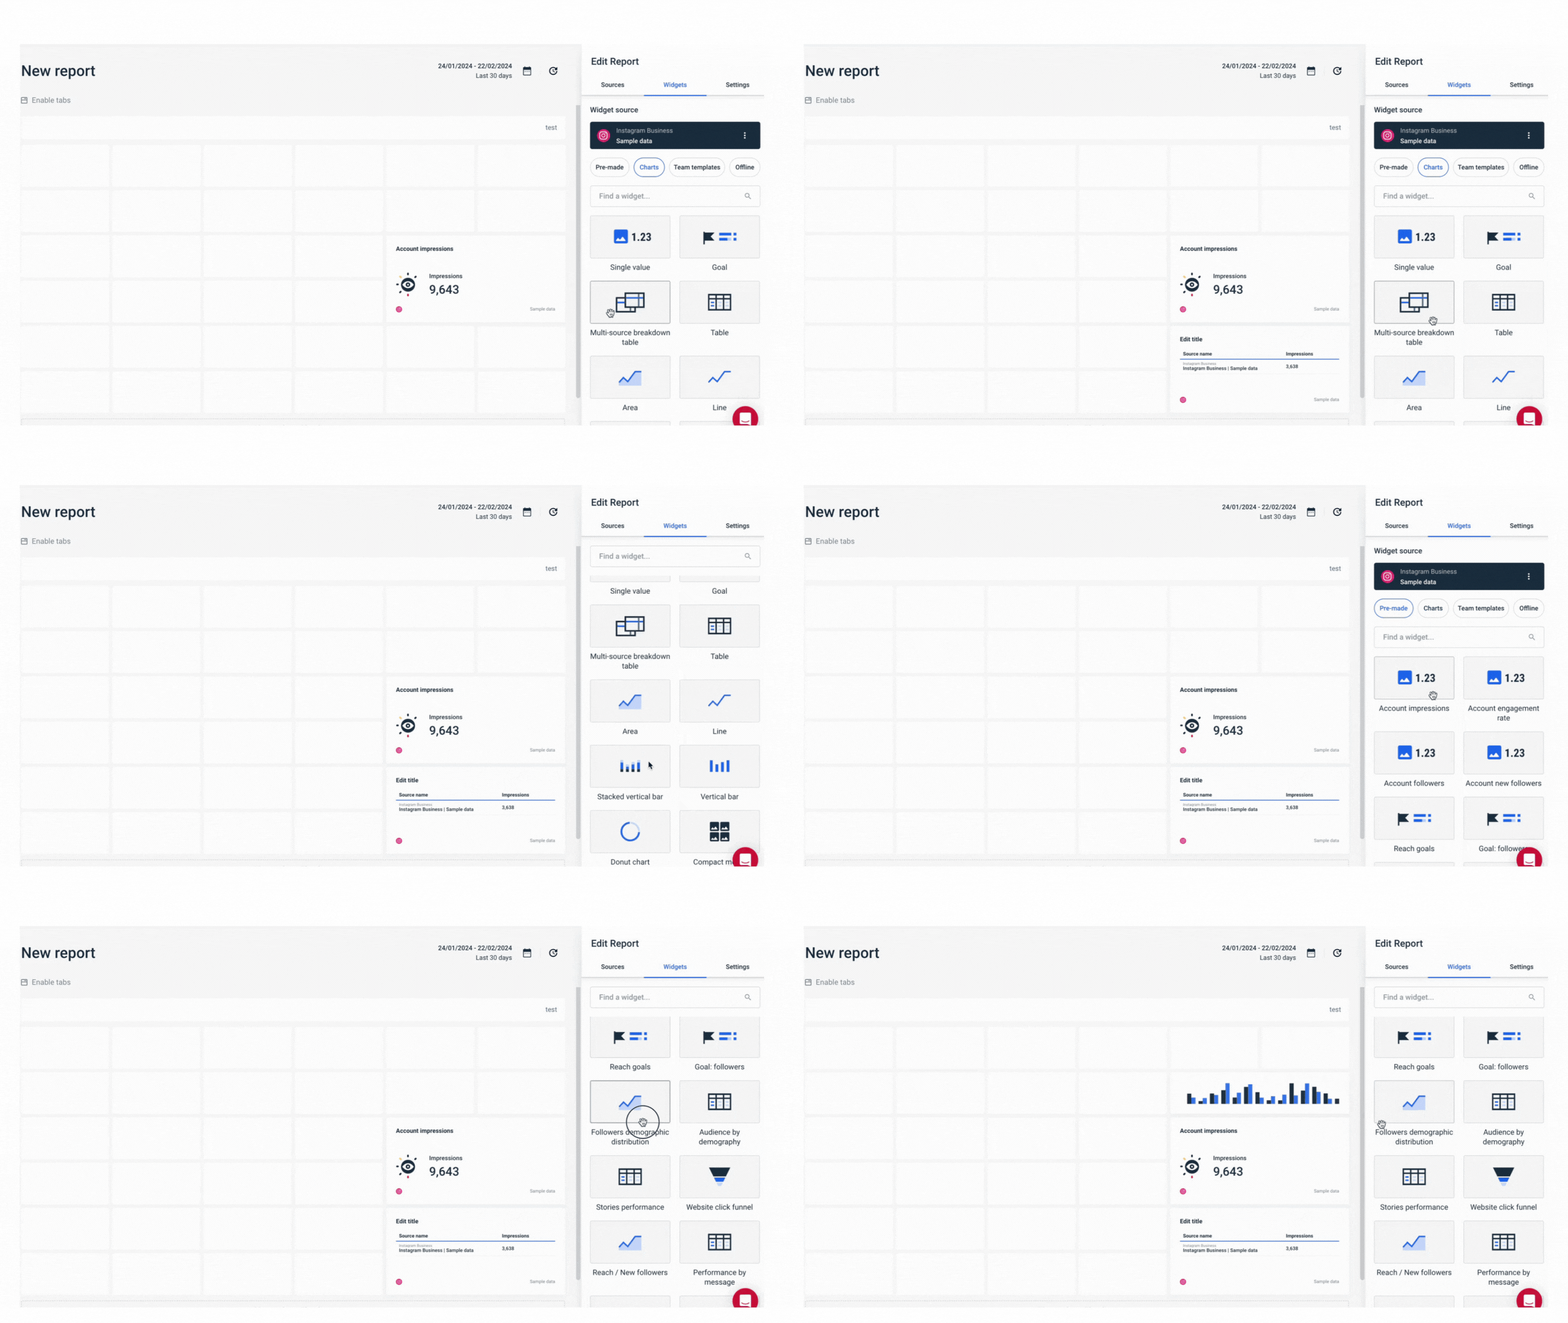
How easy and fast is editing dozens of reports?
If you’re managing a small handful of clients with nearly identical dashboards, you’ll be fine.
TapClicks offers report templates and even CSV-based bulk updates that can save time, if you’re set up for it.

Here’s how it works:
- TapClicks shows “Export” and “Import” icons across several parts of the platform—Clients, Users, Business Units, Dashboards, and more.
- These buttons let you download a CSV of existing records (like dashboard layouts or client metadata), make edits in bulk, and re-upload them to apply changes across the board.
In theory—very efficient. You can update client names, assign dashboards, or push broad changes without clicking through every single interface manually.
But in practice—it’s a power-user move.
You need to know which fields to edit, how to format the upload, and where mistakes will quietly break things without warning. If your agency doesn’t have someone comfortable working with structured data or managing config files, this “shortcut” might cost more time than it saves.
Also, if your reports are heavily customized, these CSV workflows don’t touch layout-level changes or widget-specific edits. You’ll still end up clicking through each report manually to update logos, KPIs, or visual components.
Whatagraph, for example, sidesteps this problem entirely. With linked report templates, you update the “master” once—and that change cascades across every linked client report. That’s marketing performance, built for speed.
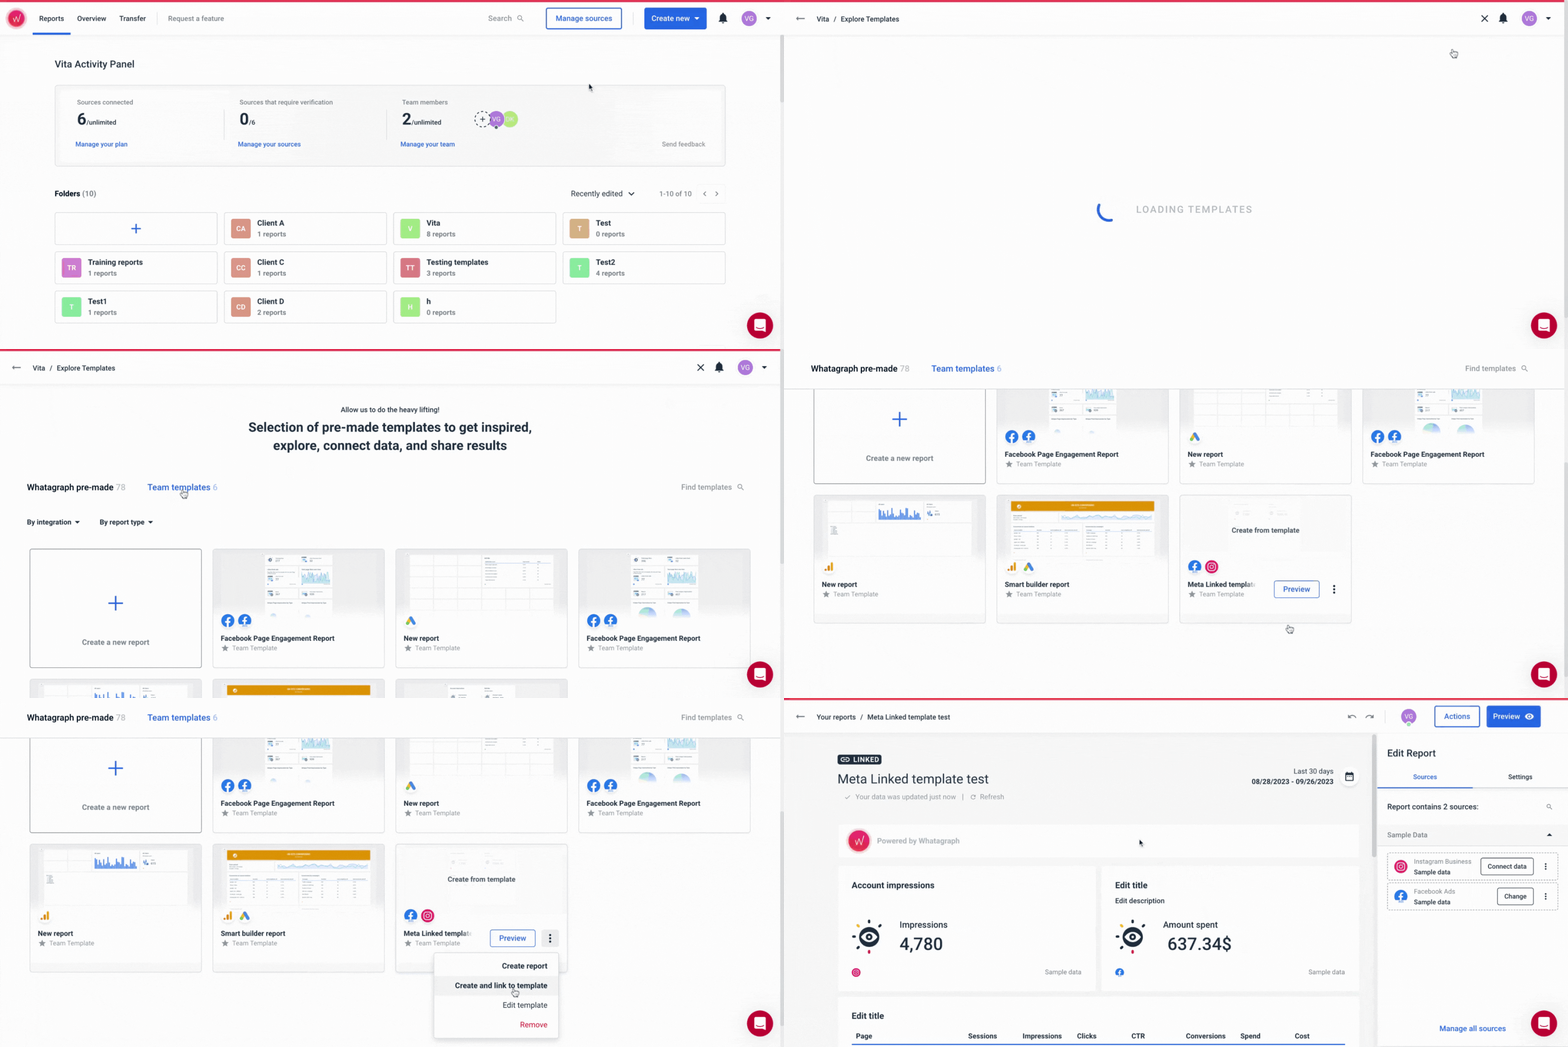
TapClicks has the right parts, but stitching them together takes effort. Expect extra clicks, workspace hopping, and a steeper learning curve.
Feature Deep Dive #2: TapClicks Integrations
Your clients use a ton of tools. The big ones like Google and Meta, plus a whole constellation of others. Can TapClicks connect to everything you need?
And how well do those connections actually work?
How many out-of-the-box integrations are there?
TapClicks advertises 216 native integrations, and you’ll see a long scroll of logos when you hit “Show All” in the “Manage Data Sources” screen—everything from Meta and Google Analytics to ecommerce hubs like Amazon DSP, AdRoll, Adobe Analytics, and niche platforms like Acoustic and Adventive.
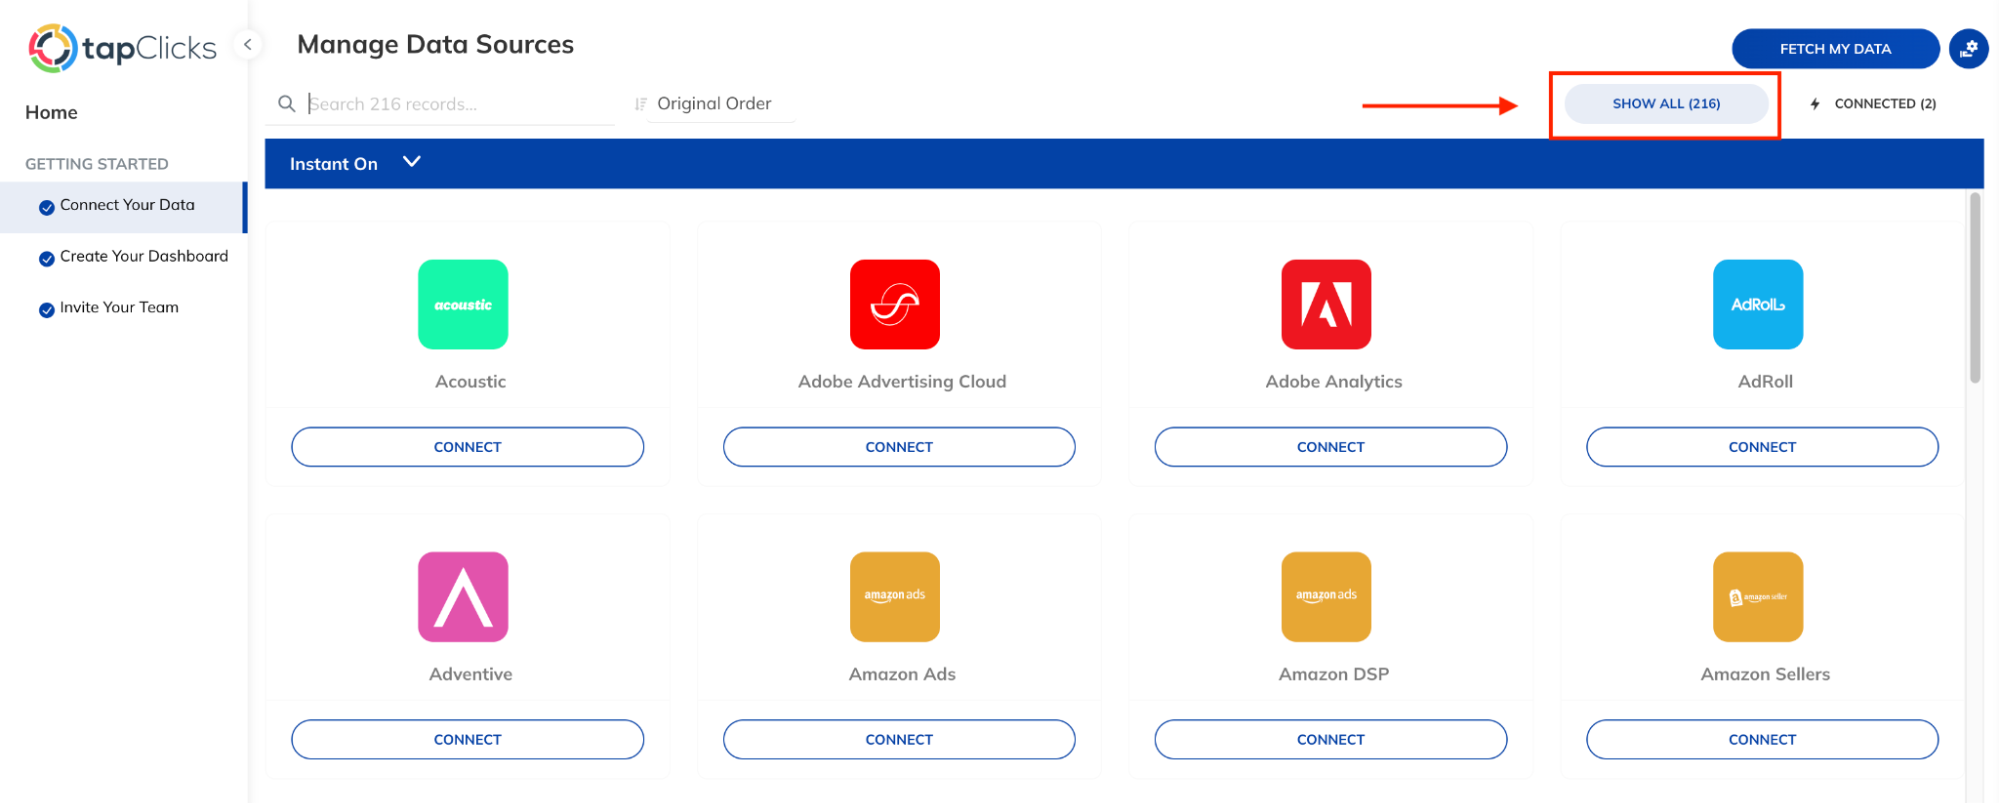 These “Instant On” connectors are meant to plug directly into your dashboards with minimal setup.
Heads up: Even with that impressive breadth, it’s important to note that integrations like SE Ranking for SEO and AppsFlyer aren’t available on the platform. (But they are available on Whatagraph.)
Can you connect custom APIs or upload offline data?
Yes—TapClicks gives you multiple ways to get your data in.
You can manually upload offline data sources—like budget files, media buys, or custom campaign management sheets—and map them into dashboards using custom dimensions or flat tables.
Apart from the integrations we just covered, you’ve got a few options for custom data connectors:
- SmartConnector™ Basic: For importing CSVs, Google Sheets, or email reports.
- SmartConnector™ Plus: For hosted file transfers and direct database connections.
- TapAPI (TapData Max only): For sending data into or out of TapClicks via API.
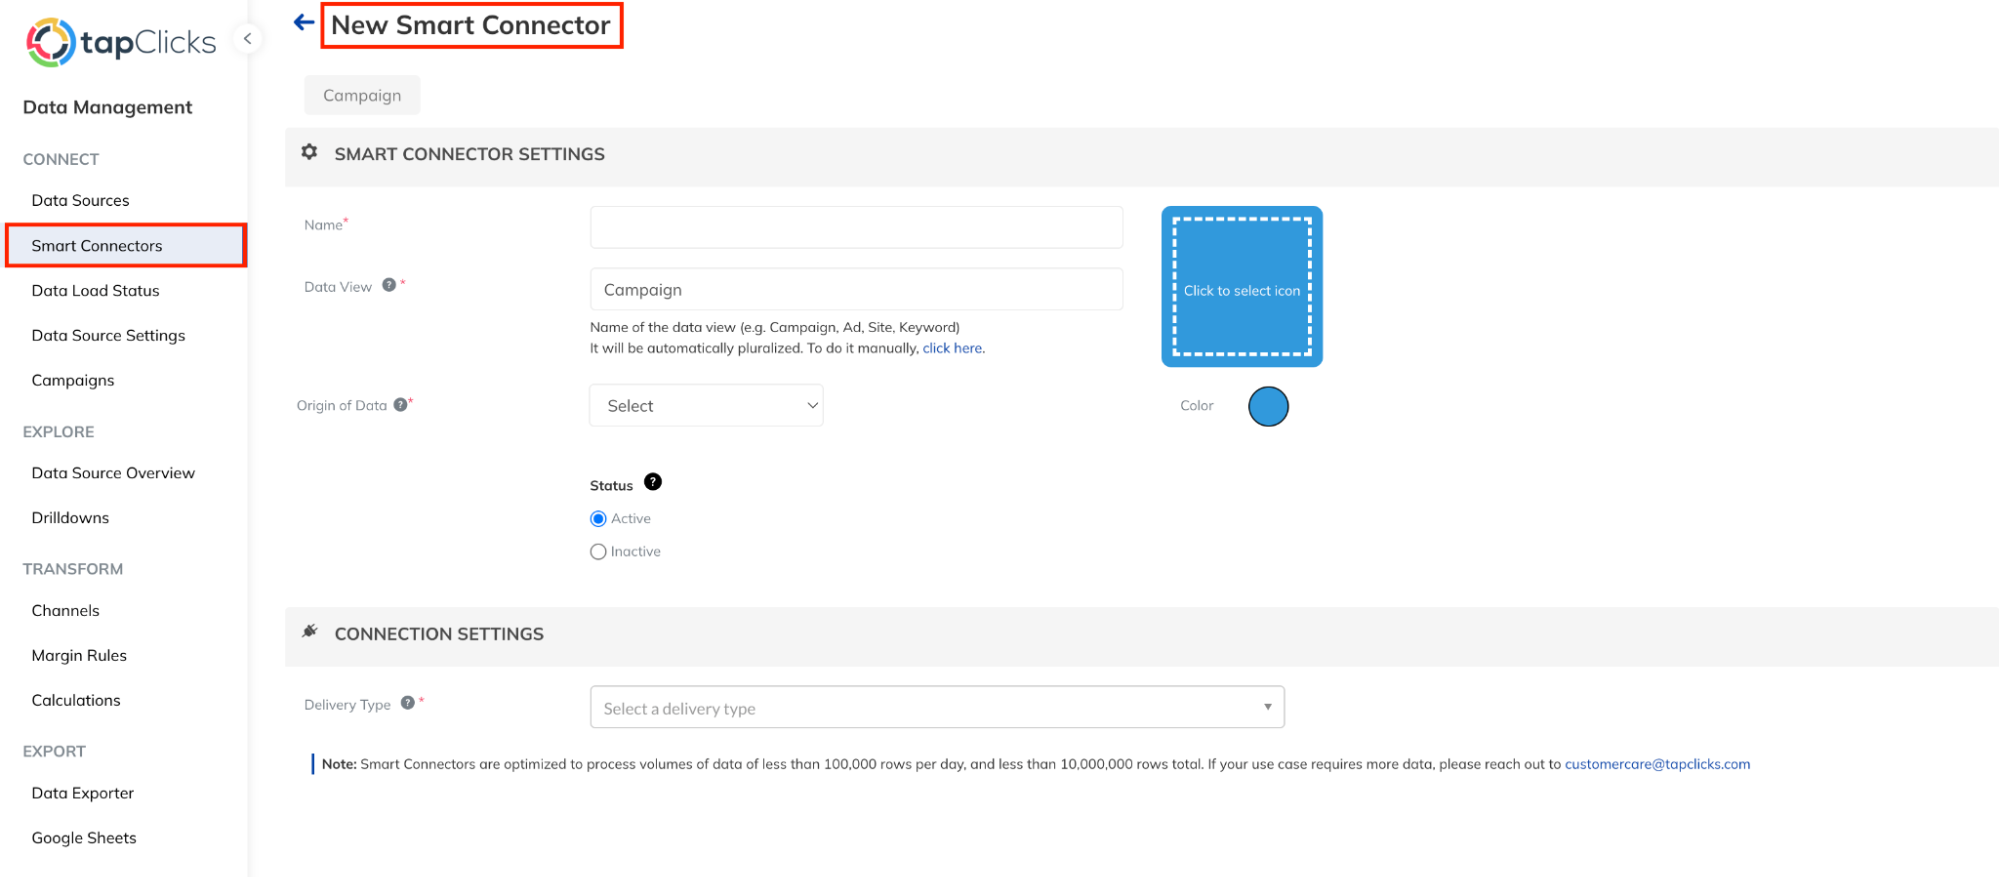 One user put it this way:
“[I like] The ability to pull data from all places via the built-in connectors. If there is not a native connector, you can also pull the data through the platform's smart connector.”
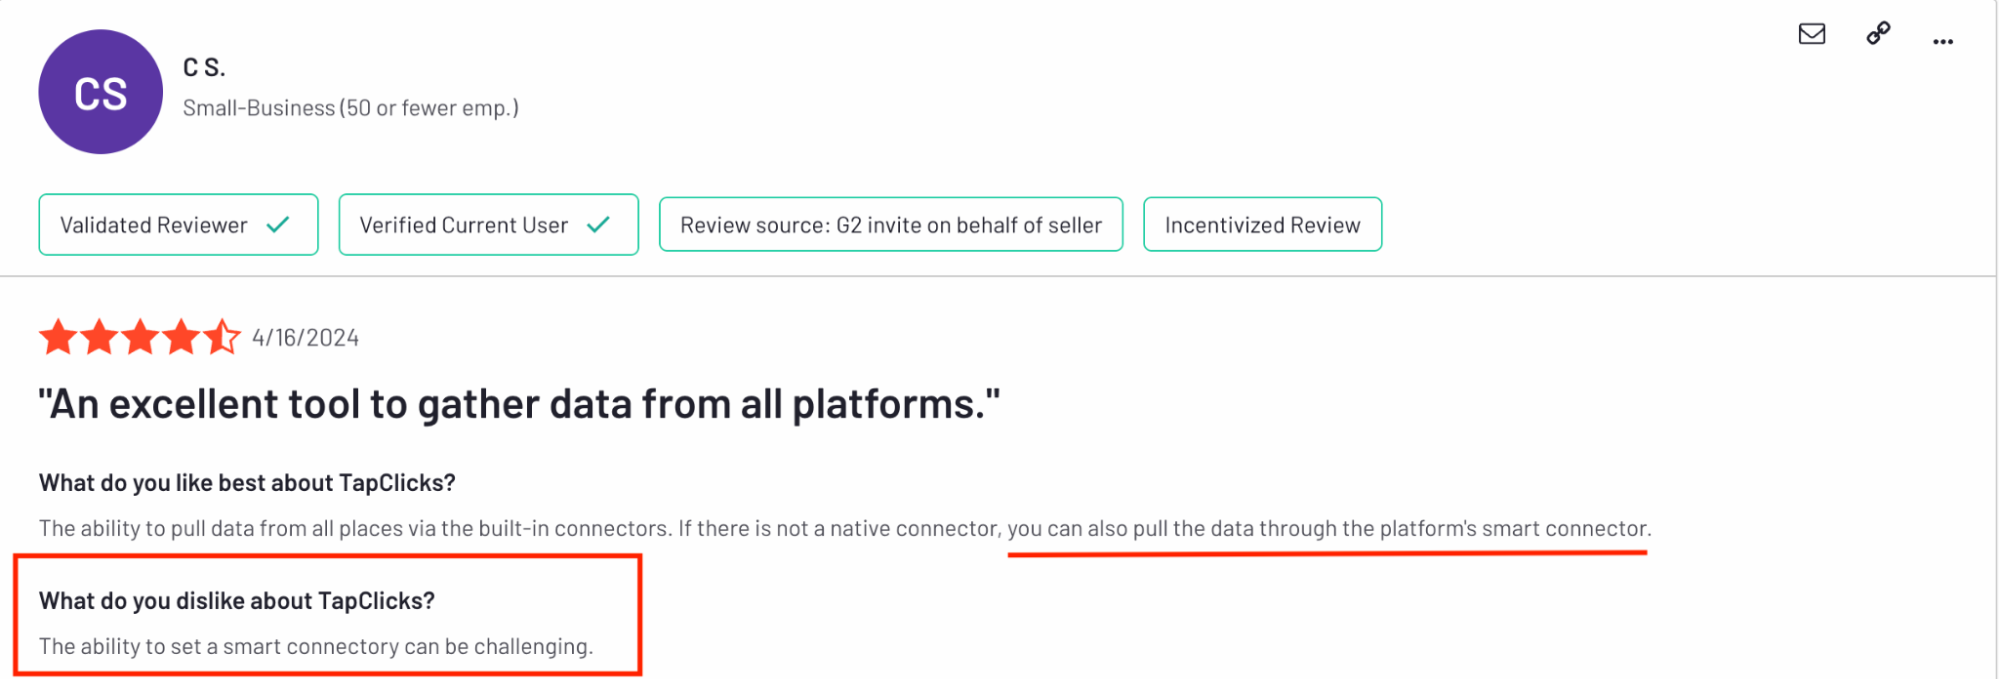 But here’s the flip side:
That same user called SmartConnector setup “challenging.”
And that’s the core of the TapClicks user experience—it’s a classic power vs. ease-of-use tradeoff.
The capability is there; the simplicity of using it isn't always guaranteed.
How reliable are these connections day-to-day?
This is where a significant number of user reviews take a sharp, critical turn. If you're looking for unwavering, set-it-and-forget-it reliability, the feedback suggests you might need to brace yourself.
Even a five-star reviewer like katie w. complains specifically about TapClicks’ connections’ reliability.
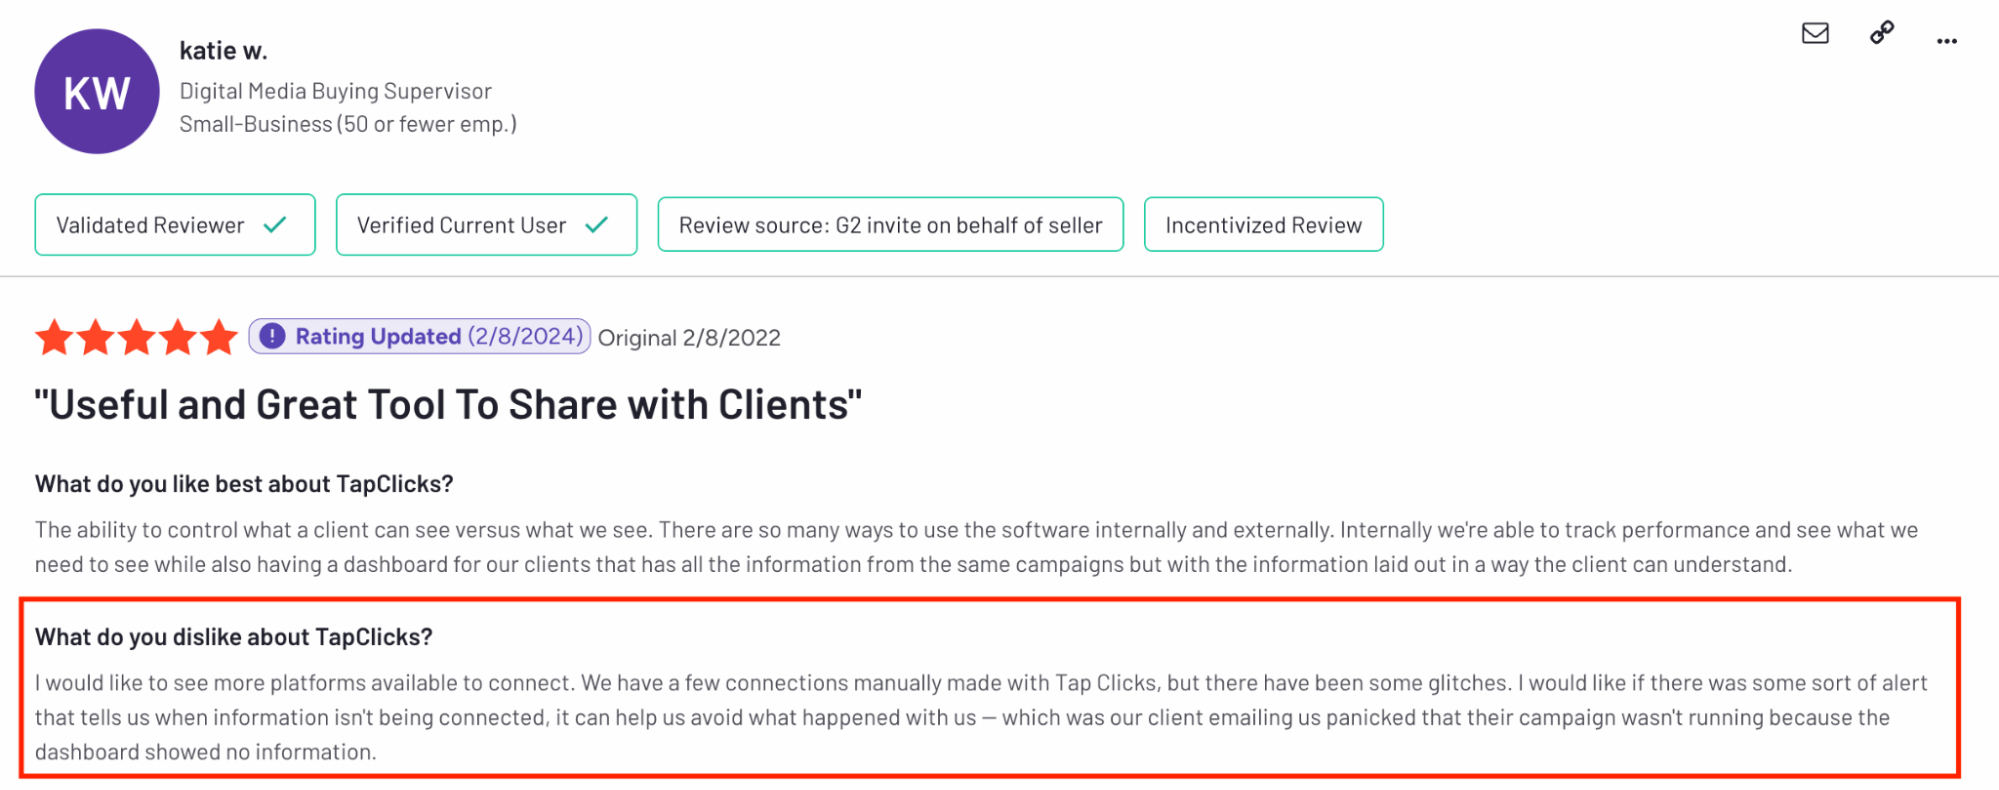 Let’s break down what this means for your day-to-day workflow:
- Even when users go through the effort of setting up connections manually (likely for data sources not natively supported by TapClicks), these connections aren't always stable and can experience "glitches."
- A key frustration is that TapClicks reportedly doesn't provide an alert system to notify users when these data connections fail or stop pulling information—”I would like if there was some sort of alert that tells us when information isn't being connected.”
- The direct, damaging consequence of these glitches and the absence of alerts is that critical data issues (like empty dashboards making campaigns appear offline) often go unnoticed by the agency until a "panicked" client discovers and reports the problem.
Beyond outright breaks and the lack of alerts, some users point to another layer of difficulty: the ongoing effort to simply maintain these connections.
Continual updating of connections and reporting requires use of professional services from Tap.
Data hygiene becomes your responsibility entirely.
Flexible, but not frictionless. TapClicks supports custom and offline data—but keeping connections clean takes constant effort.
Feature Deep Dive #3: TapClicks Data Organization, Filtering, and Blending
Once your data flows into TapClicks, how can you organize and clean it so your reports will show an accurate and holistic view of performance?
Let’s take a look.
Can you blend data or create custom metrics and dimensions?
TapClicks supports data blending across sources, and as of April 2025, they’ve improved this with Unified Blending in Channels. You can now combine data from both On Demand and Instant On connectors into the same view.
That means no more duplicating channels or setting up separate dashboards just to visualize two sides of a campaign.
It’s a meaningful upgrade—especially for agencies managing a mix of real-time and batched data sources.
That said, the power’s still wrapped in a technical shell.
You’ll need to know how to structure blended views, configure your channels, and troubleshoot misaligned metrics. This isn’t a visual drag-and-drop builder—it’s a configuration layer. And it takes some work to get right.
As for custom metrics: TapClicks offers those too, but the experience varies depending on the connector type. For On Demand Connectors (like Google Ads, GA4, Facebook, HubSpot, and others), you can use “Advanced Calculations”—TapClicks’ way of building detailed, flexible custom metrics inside the platform.
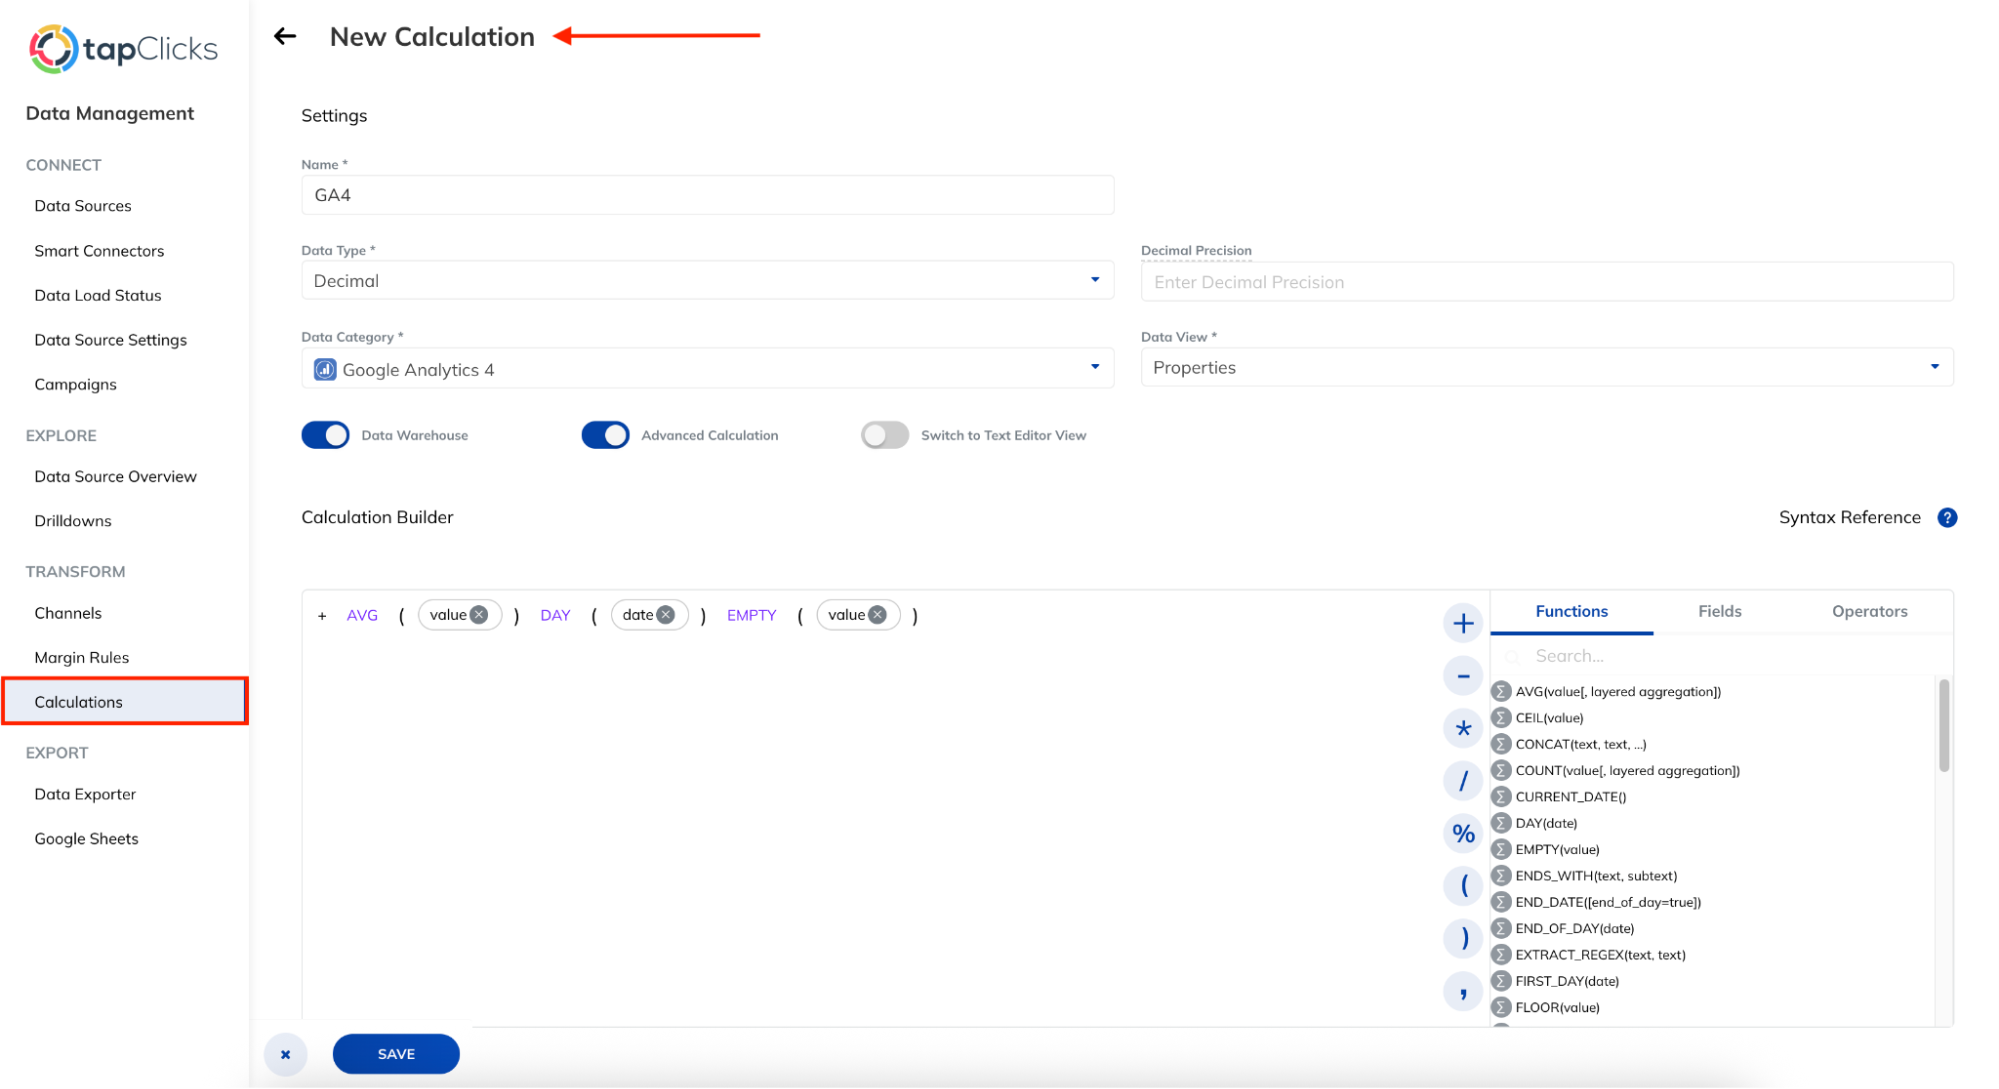 They’re more powerful than Basic Calculations and give you real control over how metrics are shaped—perfect for things like blended ROAS, normalized conversion rates, or custom funnel definitions.
But these tools aren’t available across all connectors.
And even when they are, you're working in a rules-based builder—not a visual UI. That makes them best suited for ops-minded users who are comfortable thinking in logic trees.
So yes, blending and custom metrics are available—but like most things in TapClicks, they’re flexible and fiddly.
If you want full control over blended metrics—without the heavy technical lift—Whatagraph is the simpler, faster option.
Whatagraph lets you:
✅ Standardize campaign names (e.g. merge “retargeting campaign” and “retargeting ads” into just “Retargeting”).
✅ Unify dimension labels across platforms (like turning “City,” “Location,” and “Geo” into one clean field).
✅ Segment data cleanly (e.g. group countries into “Tier 1” vs. “Tier 2” markets).
✅ Match metrics under one name (like “Conversions” across Google Ads, Meta, and Shopify).
You can blend data from any source, create unlimited custom dimensions and metrics, and do it all on every pricing plan—no premium-tier lock-ins, no connector restrictions.
You can also build these custom blends, metrics, and dimensions directly in your reports—no need to go back and forth from one workspace to another.
Check out Whatagraph’s powerful Organize feature here:
What kind of filtering can you do in TapClicks?
TapClicks gives you a decent amount of filtering power—if you know where to look and how to use it.
You can filter by metric, attribute, campaign, channel, source, and date. Filters can be applied at the widget level, dashboard level, or across entire reports. You can also save and reuse filter presets for recurring client needs.
But the interface doesn’t exactly invite play.
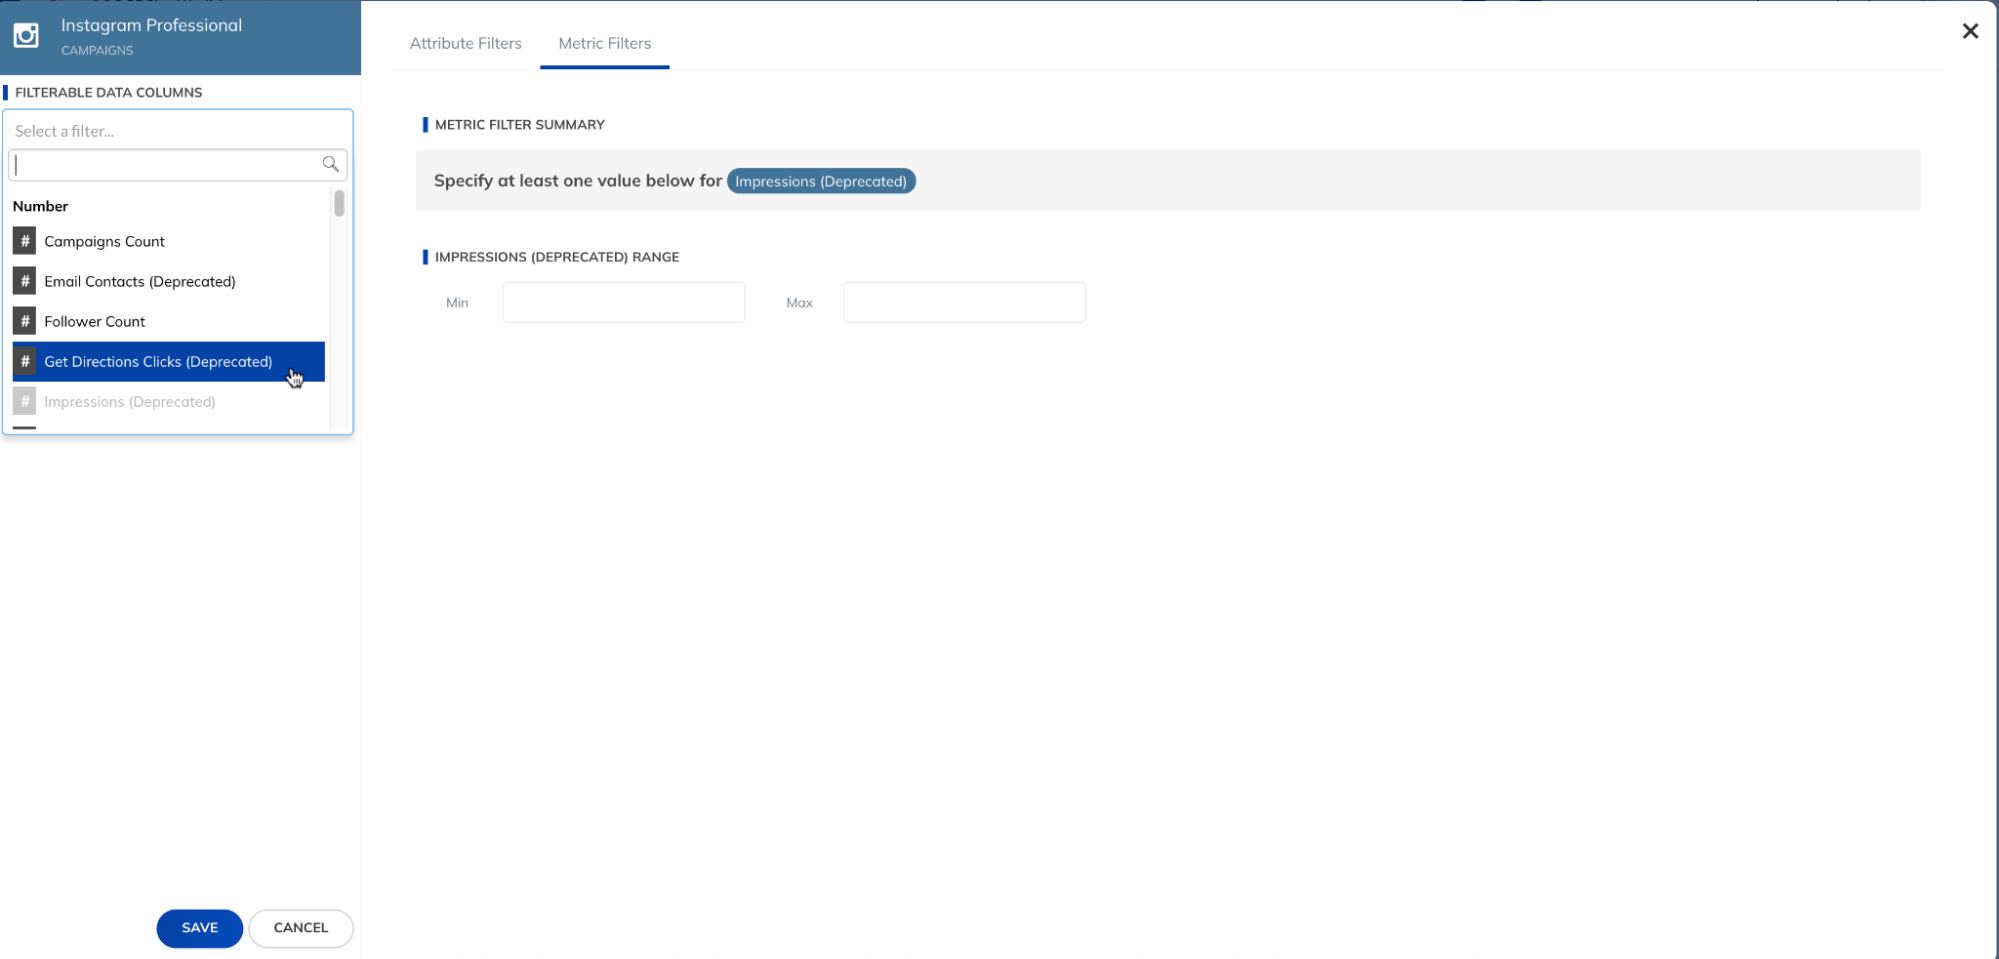 As the screenshot shows, you're not dragging pills into a logic builder or toggling switches. You're filling out text fields, selecting from dropdowns, and specifying ranges manually.
It’s functional, but doesn’t exactly flow.
And here’s where it gets trickier—the fine print according to TapClicks’ documentation:
- No filters for Microsoft Ads: Their API doesn’t allow it.
- Limited filtering for LinkedIn Ads: You can only do so much before hitting API walls.
- No “pick from a list” filtering: You can’t select campaigns from a dropdown—you have to manually enter the value.
- No combined AND/OR logic: You can’t nest complex filters using both.
- No filtering on date or boolean fields: Want to segment based on campaign start dates? Nope.
- No filters on dynamic custom fields: If it’s custom and dynamic, it’s off-limits.
- No promoting On Demand filters to dashboards: Filters on On Demand widgets are locked in place—you can’t apply them globally.
So yes, TapClicks supports filtering. But not in the flexible, visual, "slice-and-dice" way many marketers expect in 2026.
In contrast, Whatagraph simplifies this entire process. You can apply a “Source filter” to an entire report—no need to add filters widget by widget. It’s faster, cleaner, and much easier to maintain across dozens of clients.
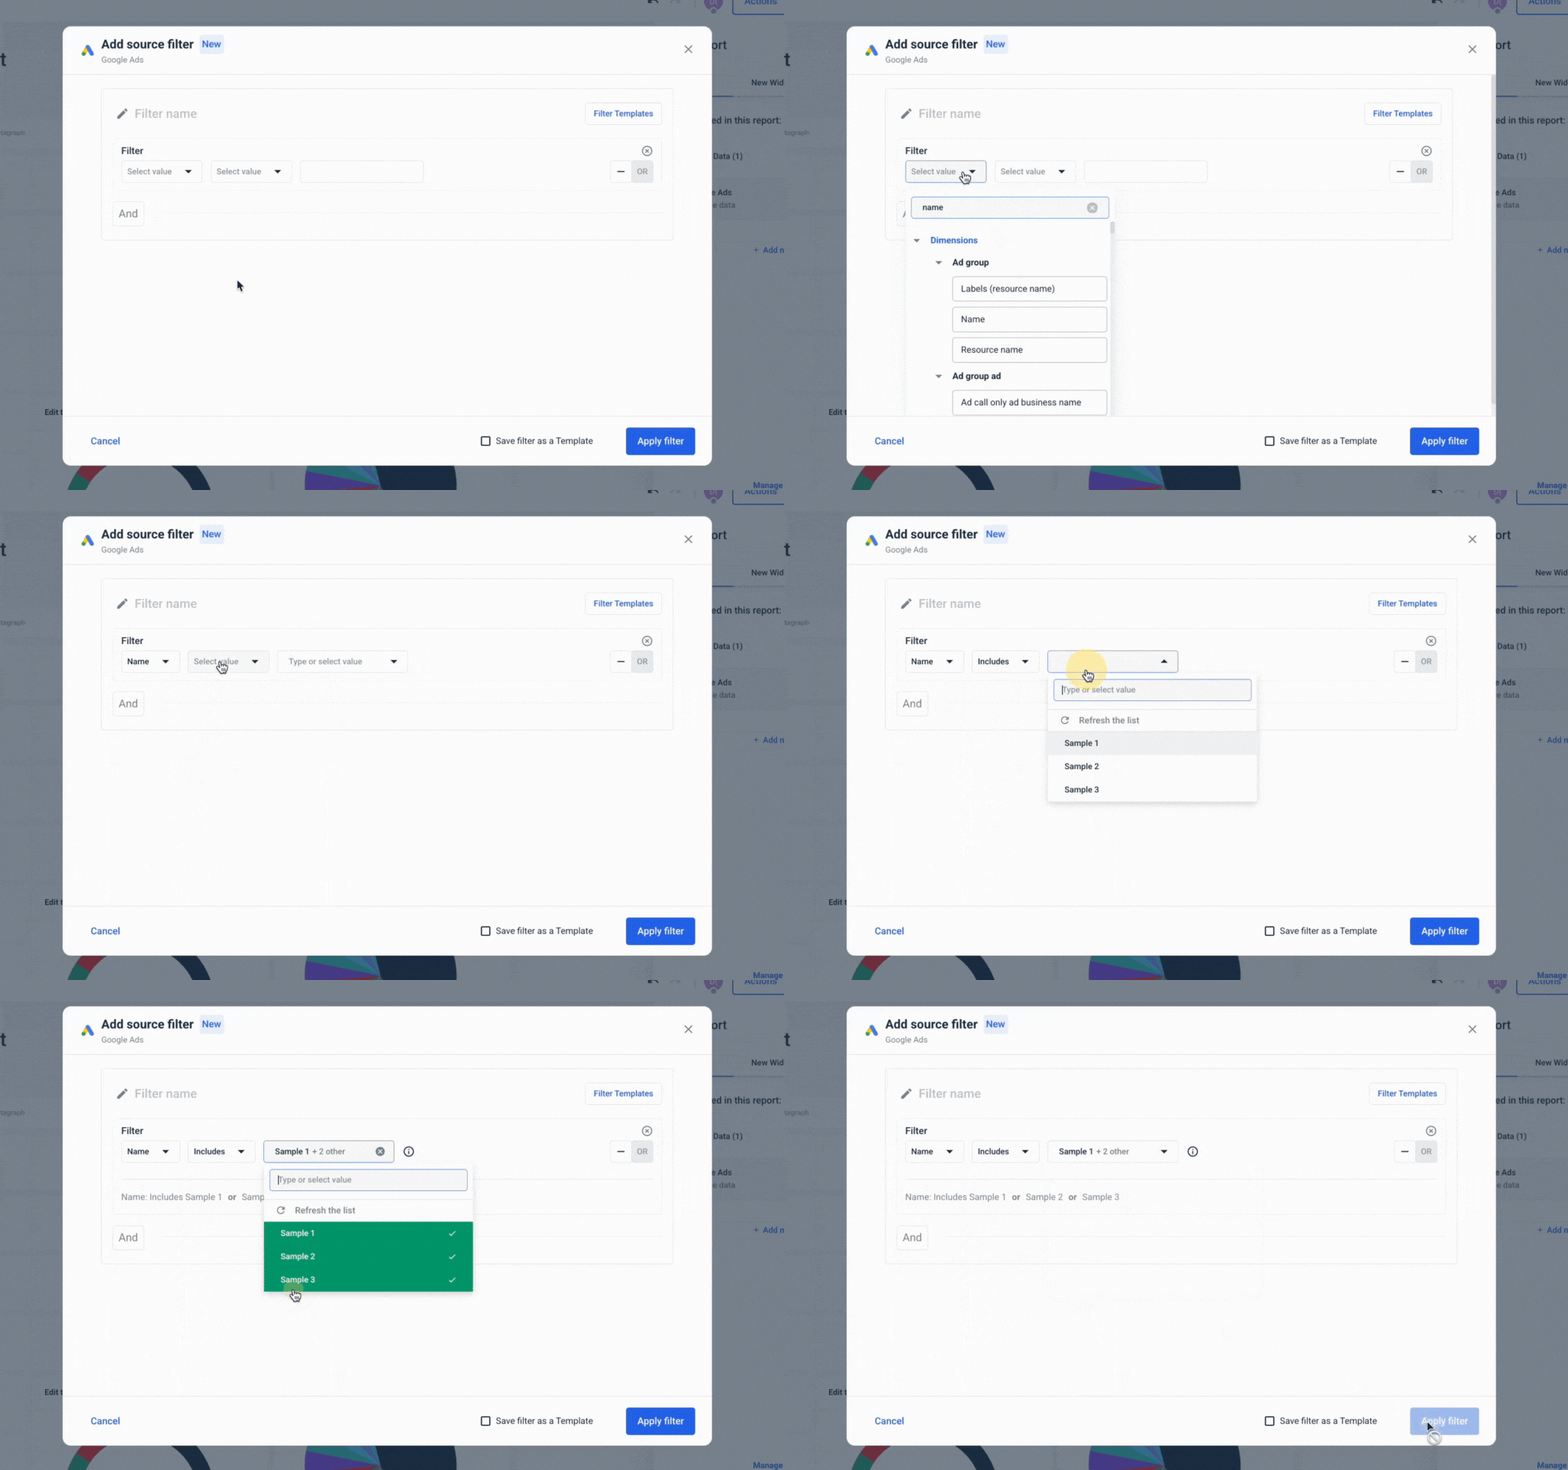
Even better, you can layer those Source filters with widget-level filters for granular breakdowns—giving you both a bird’s-eye view and field-level control without the tedium.
How can you manage clients on TapClicks?
TapClicks is clearly built for multi-client setups. You can create dedicated Business Units, assign users with client-specific roles, and tightly control which dashboards, reports, and data each person sees.
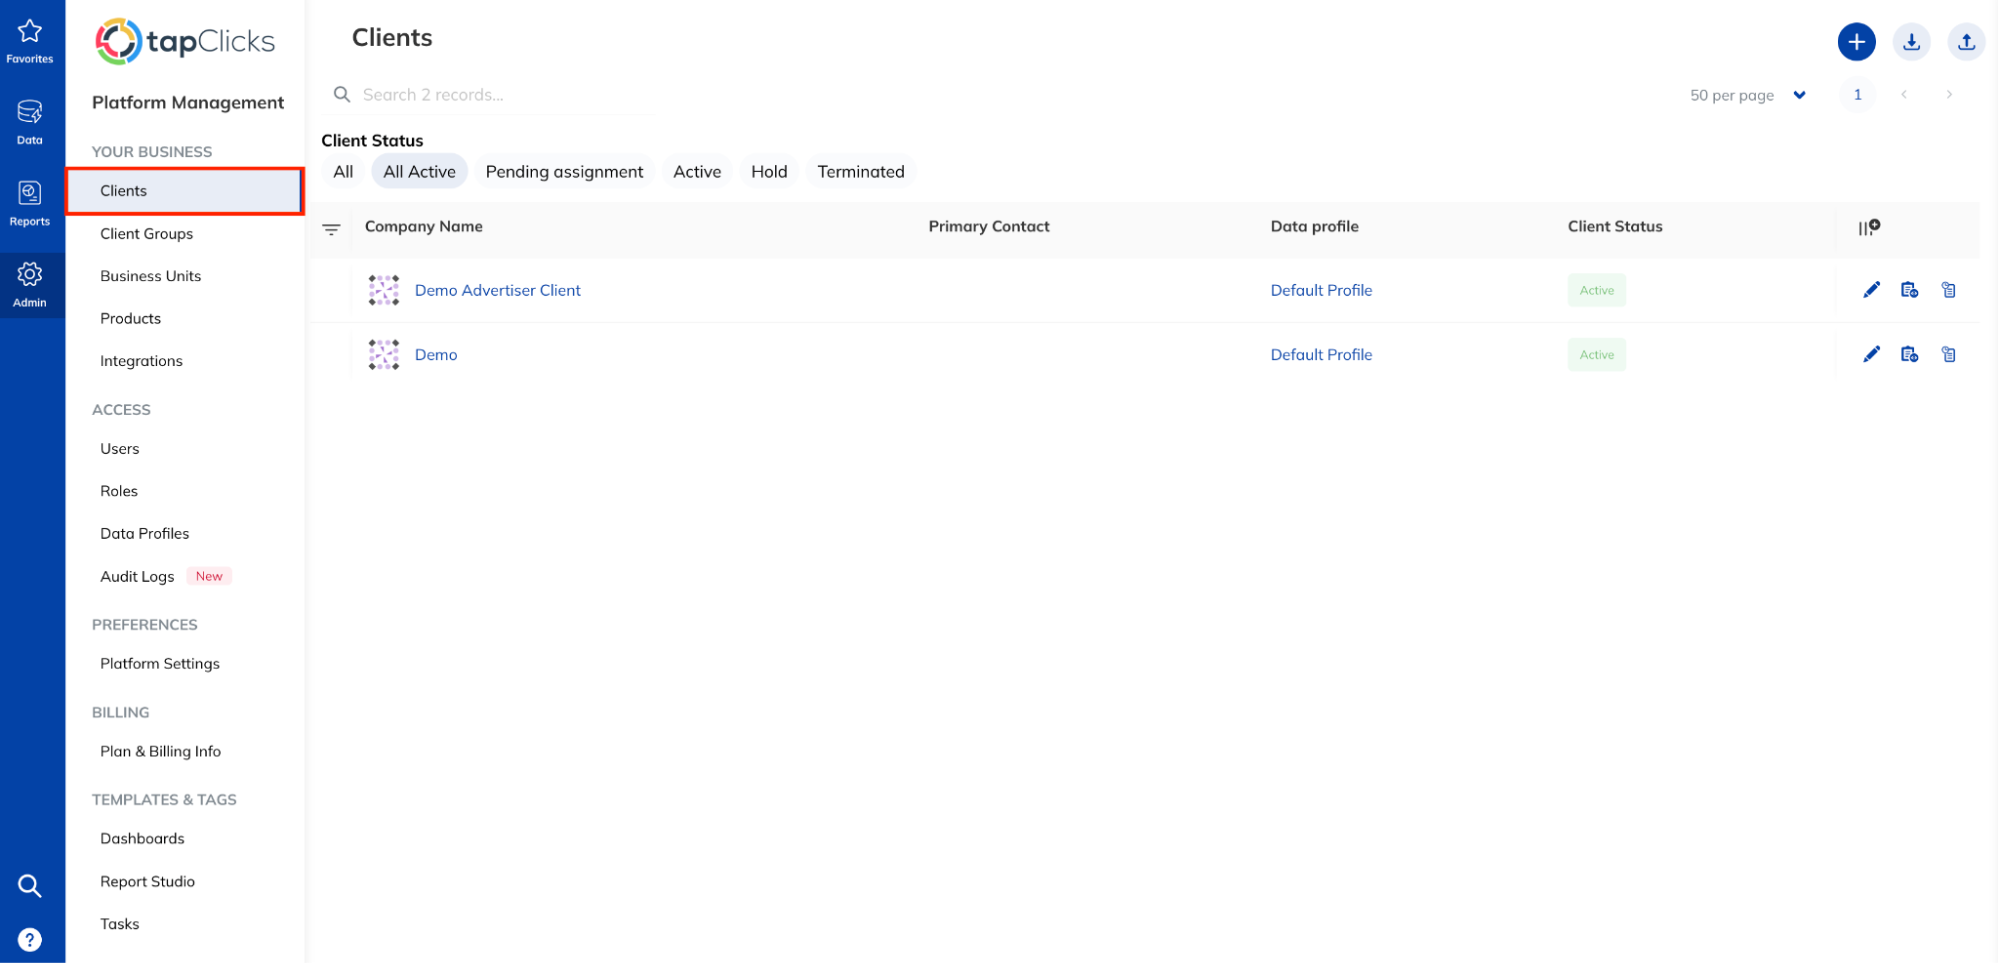 You can assign each client:
- A specific data profile (what data they see).
- Their own dashboards and reports.
- Group-level permissions.
- TapOrders visibility (for ad operations).
- Account manager linkage.
- Cross-business unit order booking options.
And if that sounds like a lot...it is.
You don’t just “add a client.”
You fill out a multi-tab form: company name, business unit, data profile, products, account manager, TapOrders status, report access status—and more.
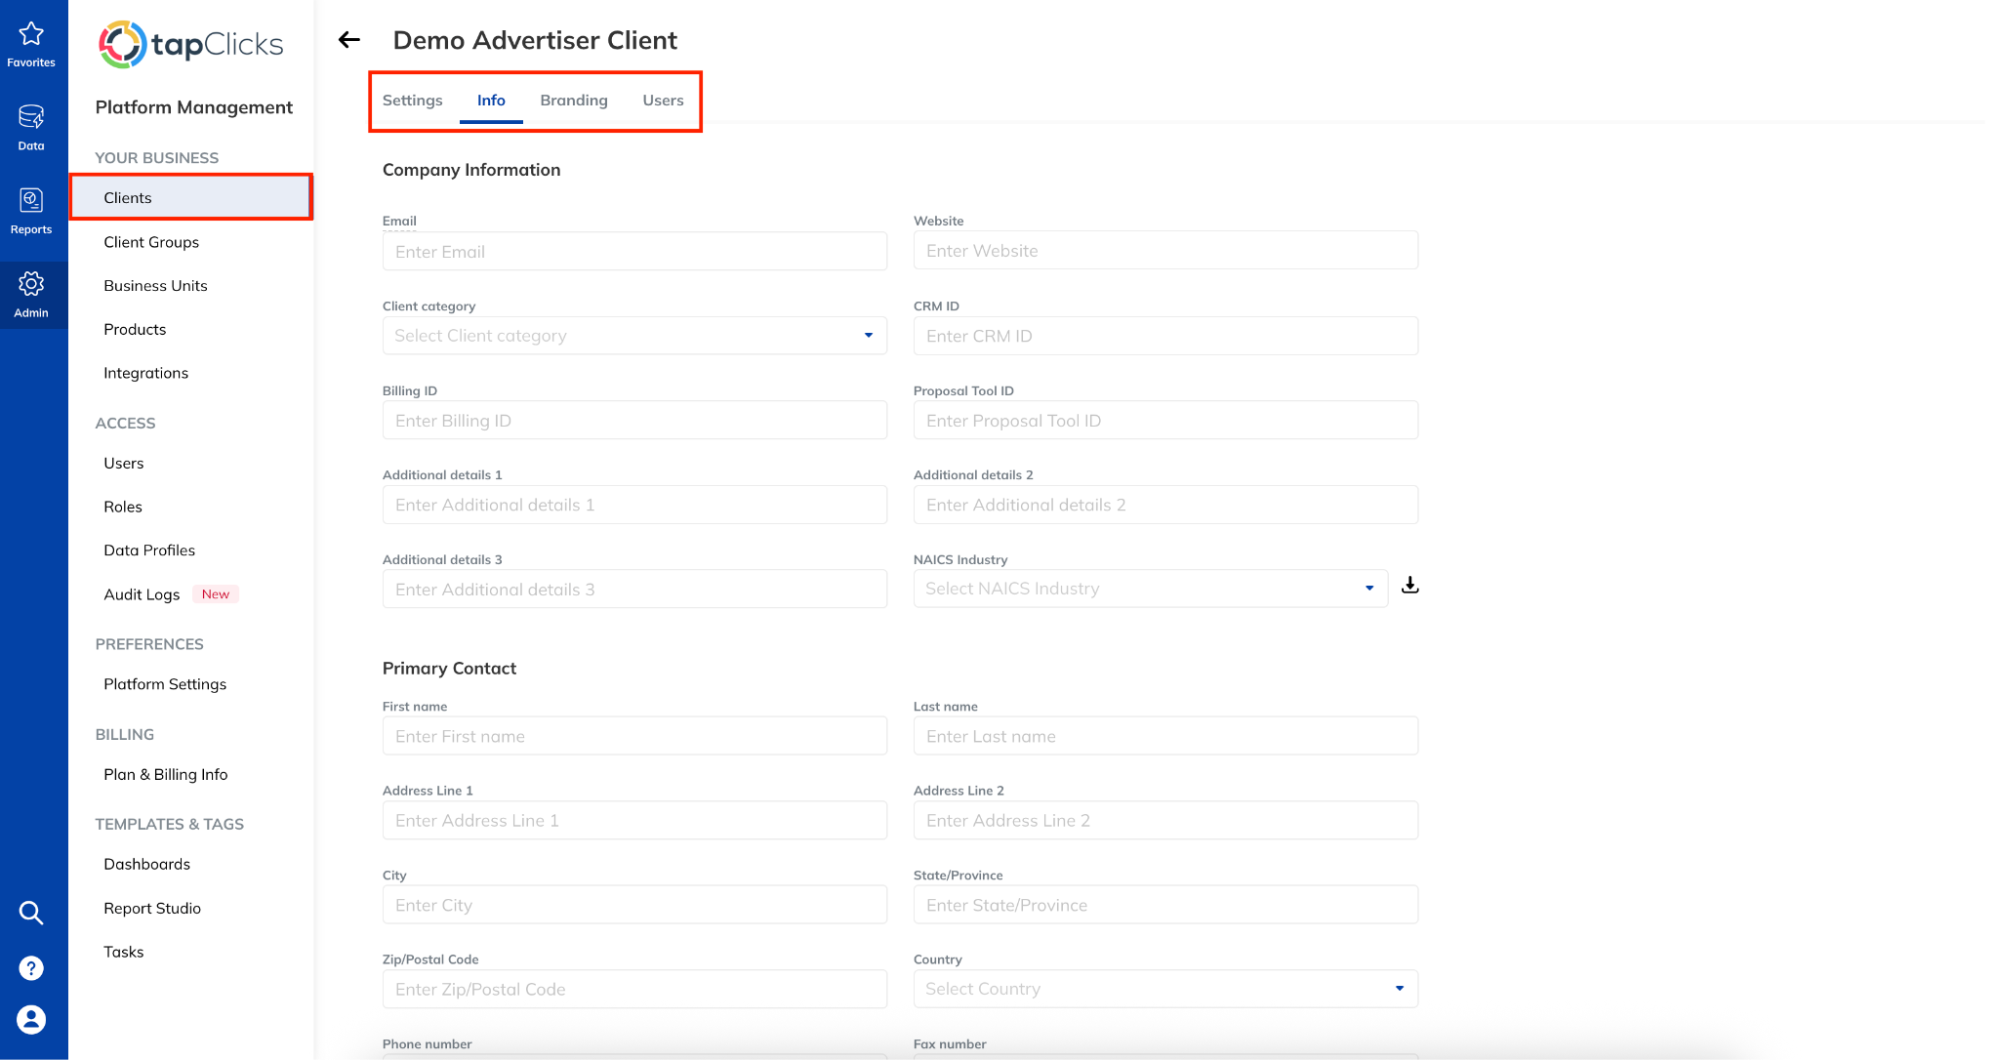 Want to white-label reports? Upload a logo under the “Branding” tab. Want to gate access to specific dashboards? You’ll have to configure that too.
Once a client is created, you can’t delete them. You can only inactivate or “hold” their account, which preserves their config but hides the data. So every new addition needs to be intentional—especially if you’re working with dozens of clients and rotating access often.
The tooling is there, but you’re building every brick manually.
TapClicks gives you deep control over data blending, filtering, and client access—but it’s manual, clunky, and best suited to ops-heavy teams.
Feature Deep Dive #4: TapClicks Reports and Dashboards
This is where the rubber meets the road.
This section looks at how reports are built in TapClicks, what you can customize, how interactive the dashboards really are, and what options you have for sharing and automation.
How are reports built (templates vs. custom)?
We touched on this earlier in the ease of use section, but it’s worth digging deeper here.
Yes, TapClicks offers templates. Yes, there’s a “Quick Report” option. But in practice, these starting points rarely get you all the way to a polished, client-ready result.
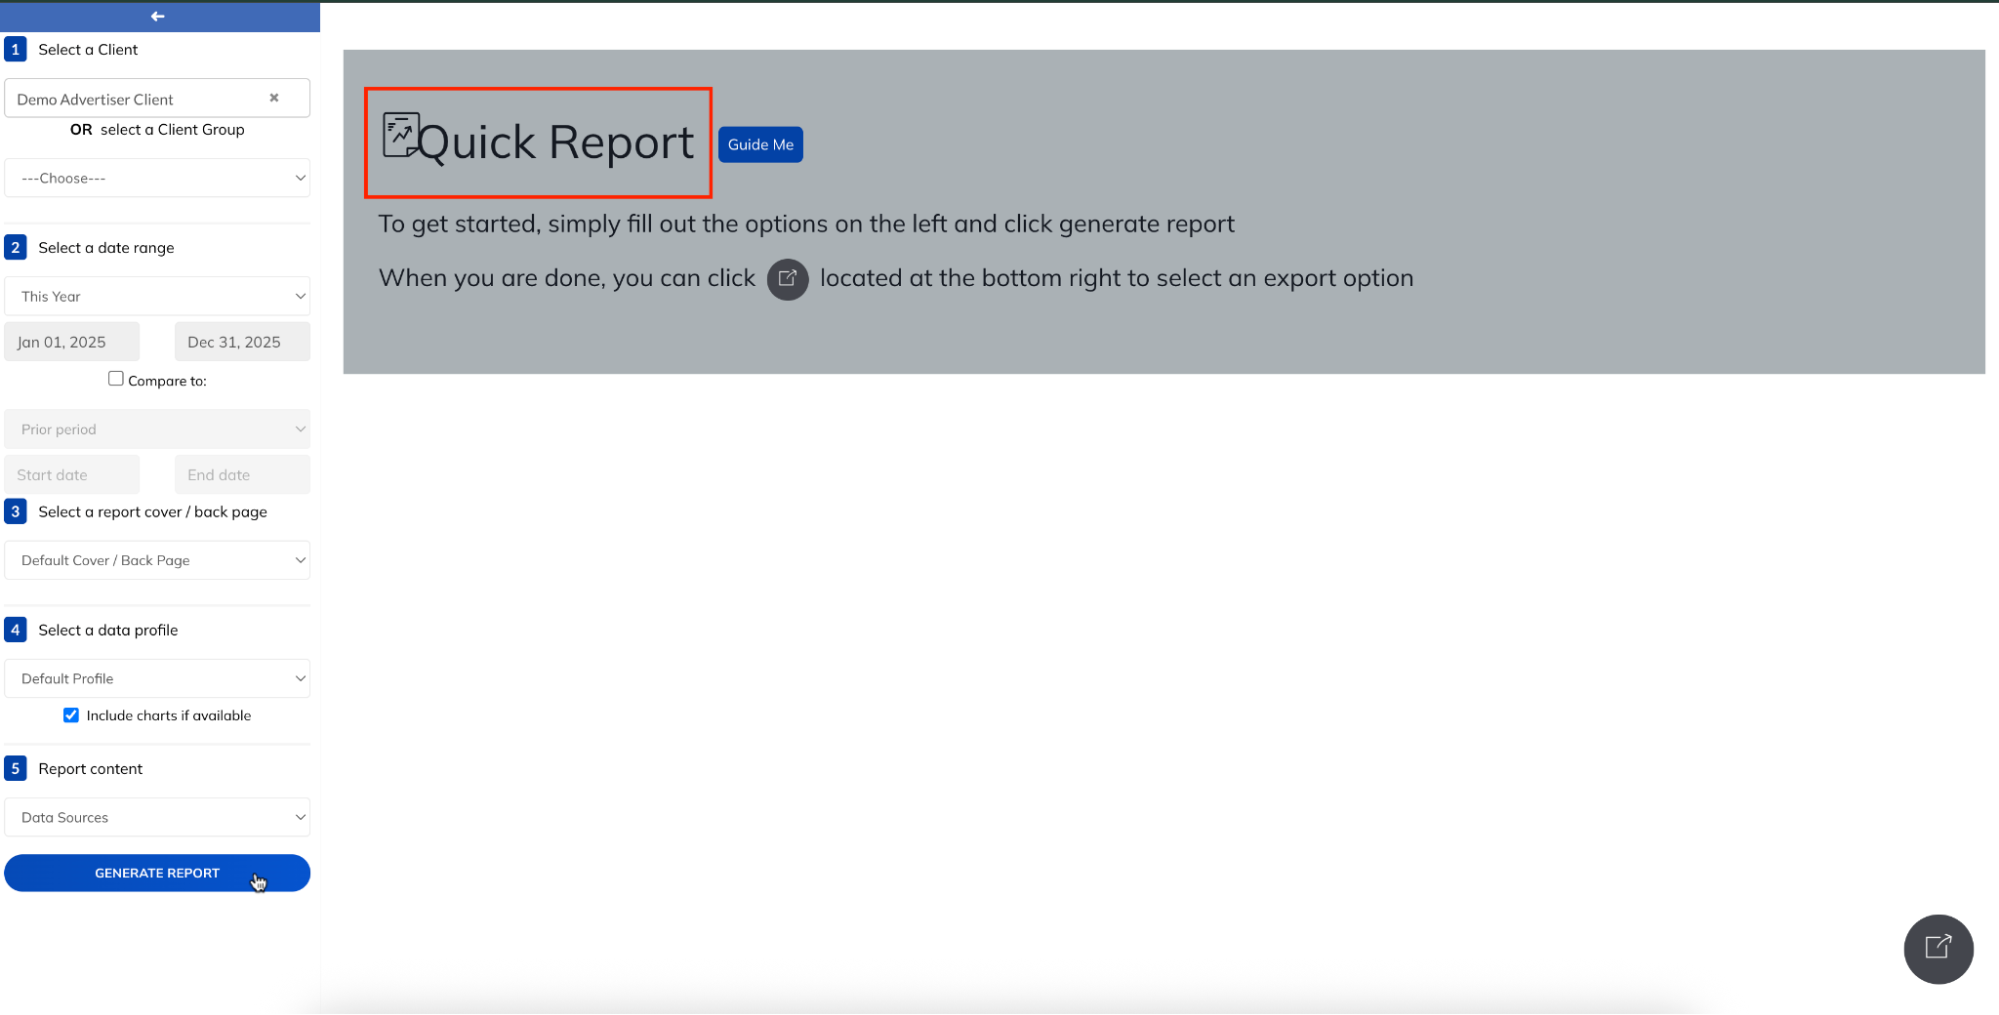 Take Quick Report, for example. You select a client, date range, data profile, and hit generate. The output is fast—but raw. You’ll still need to tweak visuals, adjust layout, and manually style everything before it’s ready to send.
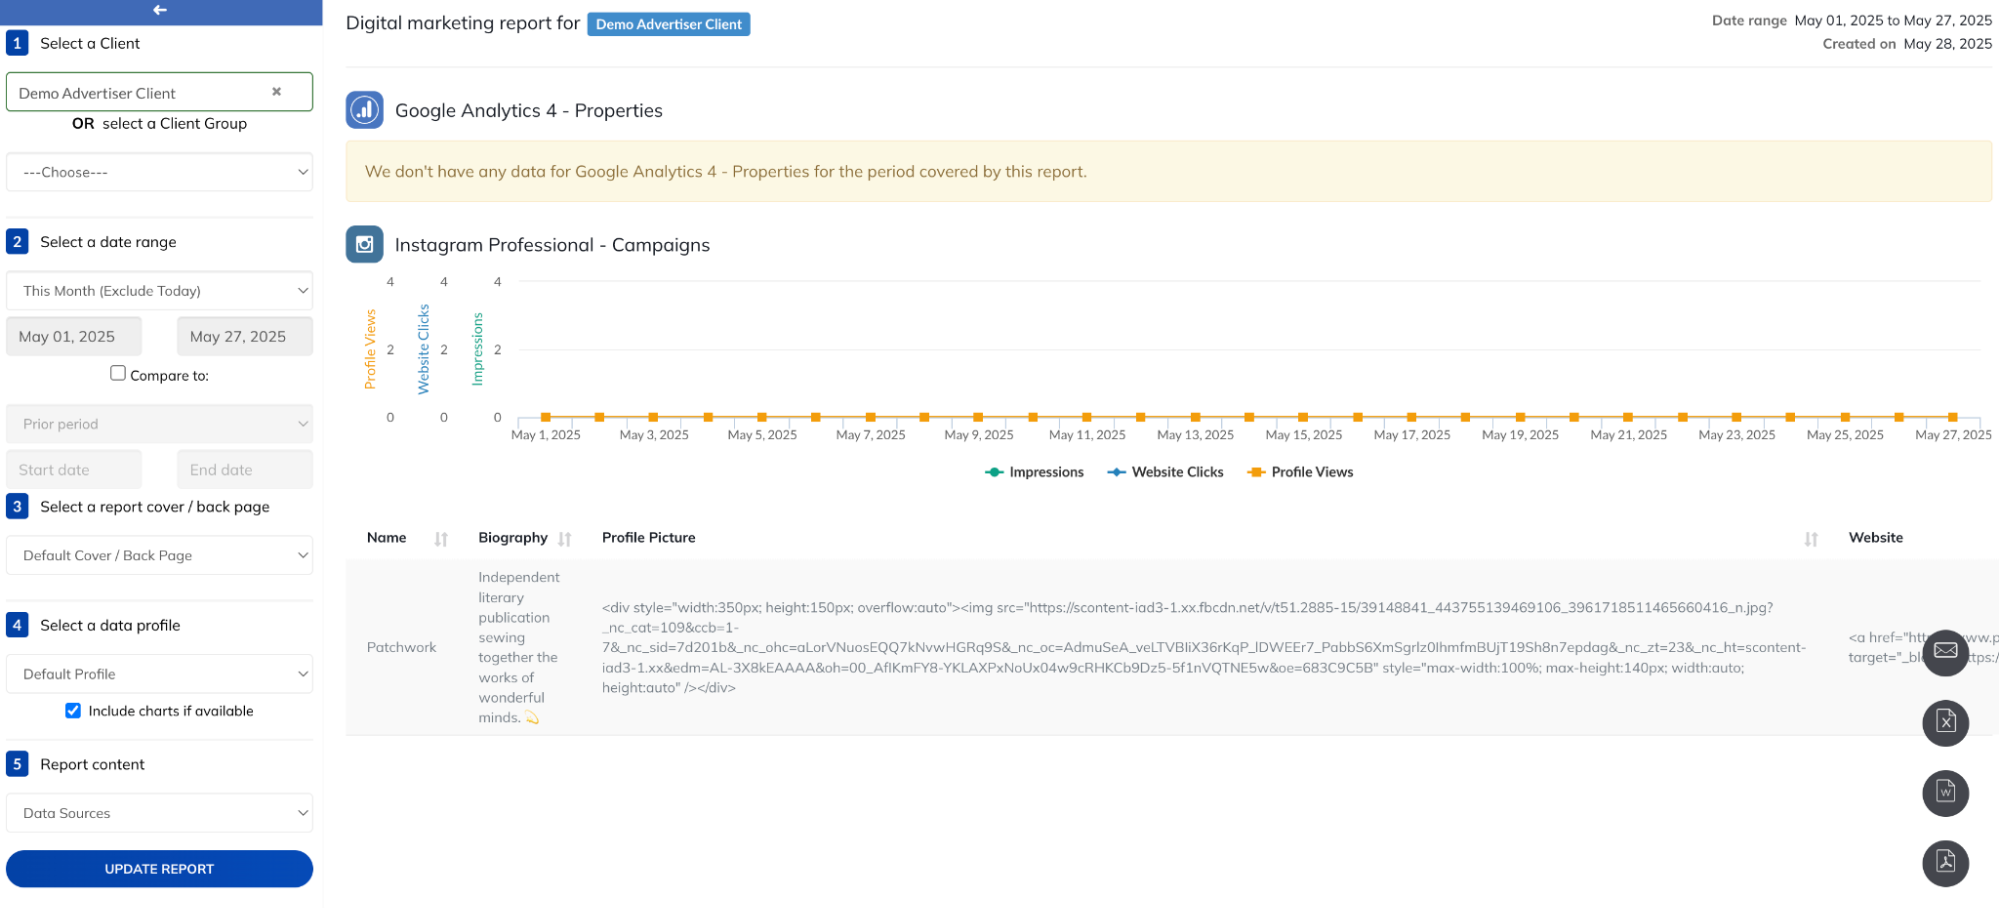 Then there’s the Freehand option. And by “freehand,” they mean it literally.
You start with a blank canvas and click “Insert” every time you want to add…anything.
Data chart? Click.
Text box? Click.
Logo? Click.
Every element is placed manually. If you’re building even a simple 3-page report, expect to click 100+ times just to get the layout in shape.
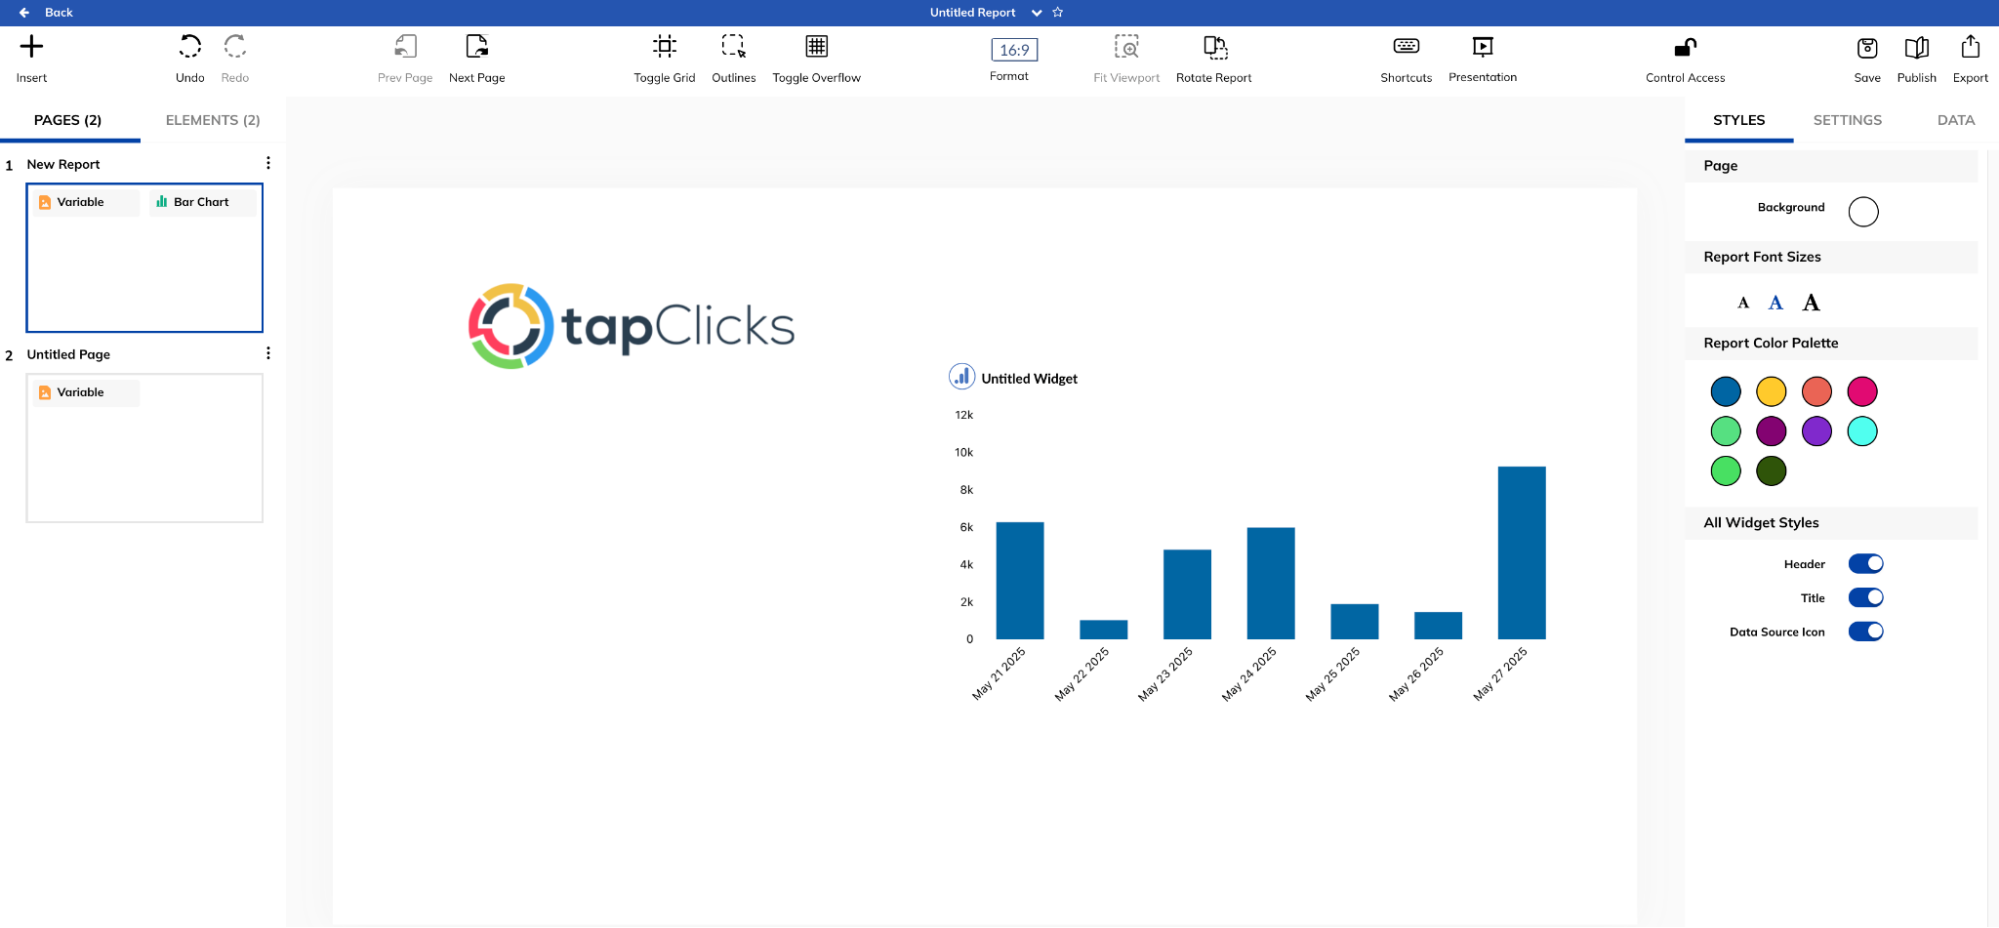 You can build highly custom reports, but there’s no fast lane unless you’re copying from an existing template or sticking to a repeatable format.
What can you actually customize?
All your visual data lives inside Widgets—bar charts, pie charts, line graphs, tables, and so on. These widgets are the building blocks of your Dashboards and Reports. To customize what you see, you’ll need to edit each widget manually.
Here’s the workflow:
- Go to your dashboard.
- Hover over a widget.
- Click the three-dot “More Options” menu.
- Select Edit.
- Click the Styles tab.
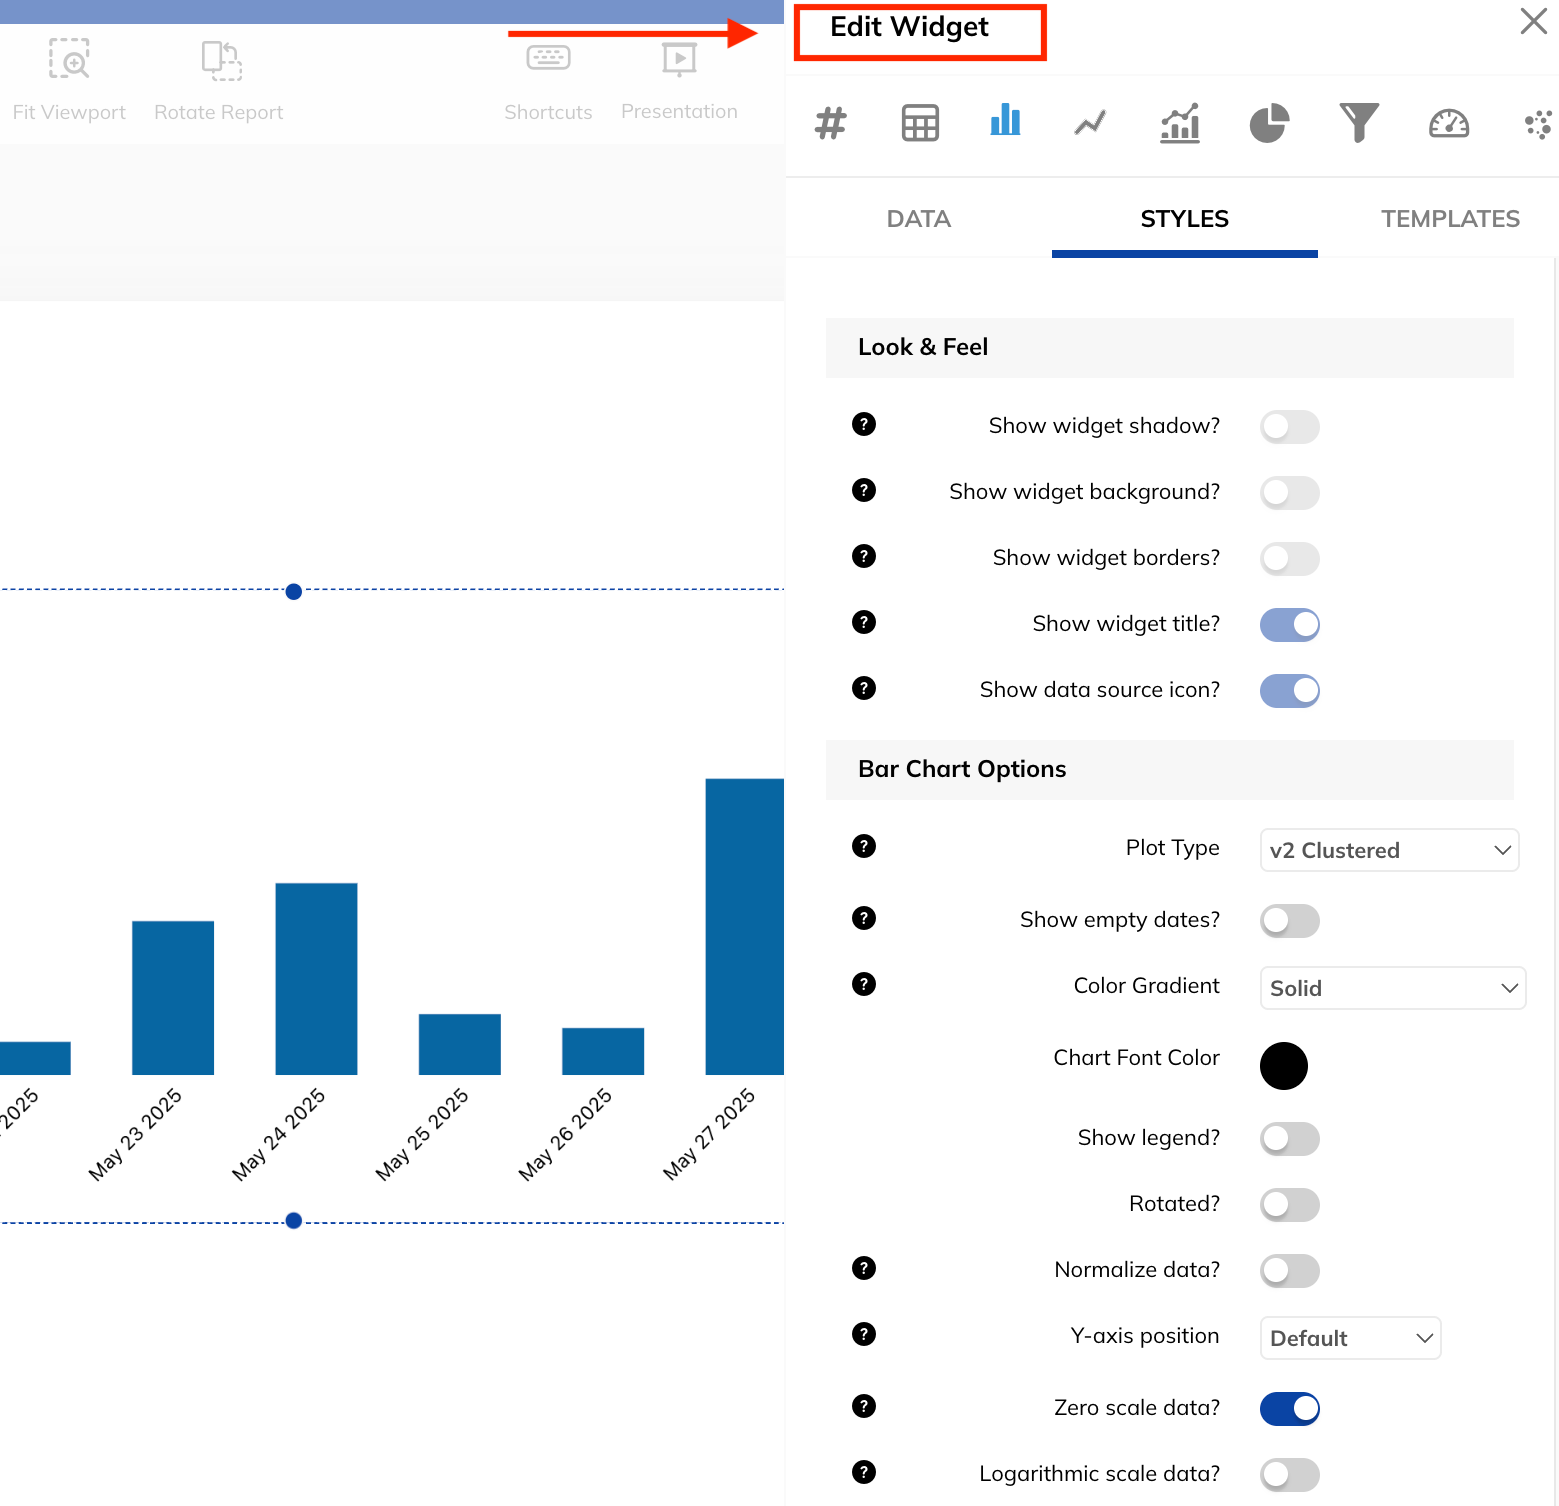 From there, you’ll see two main sections:
- Look & Feel: Controls the visual design—colors, fonts, borders, etc.
- Bar Chart Options: Controls chart-specific settings like axis formatting, label visibility, data point precision, and more.
You can toggle each style setting on or off using sliders, and for some options, there’s a little “?” icon to explain what the setting does.
It’s granular and gets the job done—but it’s not exactly quick.
Let’s talk white-labeling.
In TapClicks, you can fully brand the login experience and dashboard interface: upload your client’s logo, pick a theme color (they offer 10+ presets), and even customize the login screen text. This is a big win for agencies looking to deliver a clean, branded experience across every touchpoint.
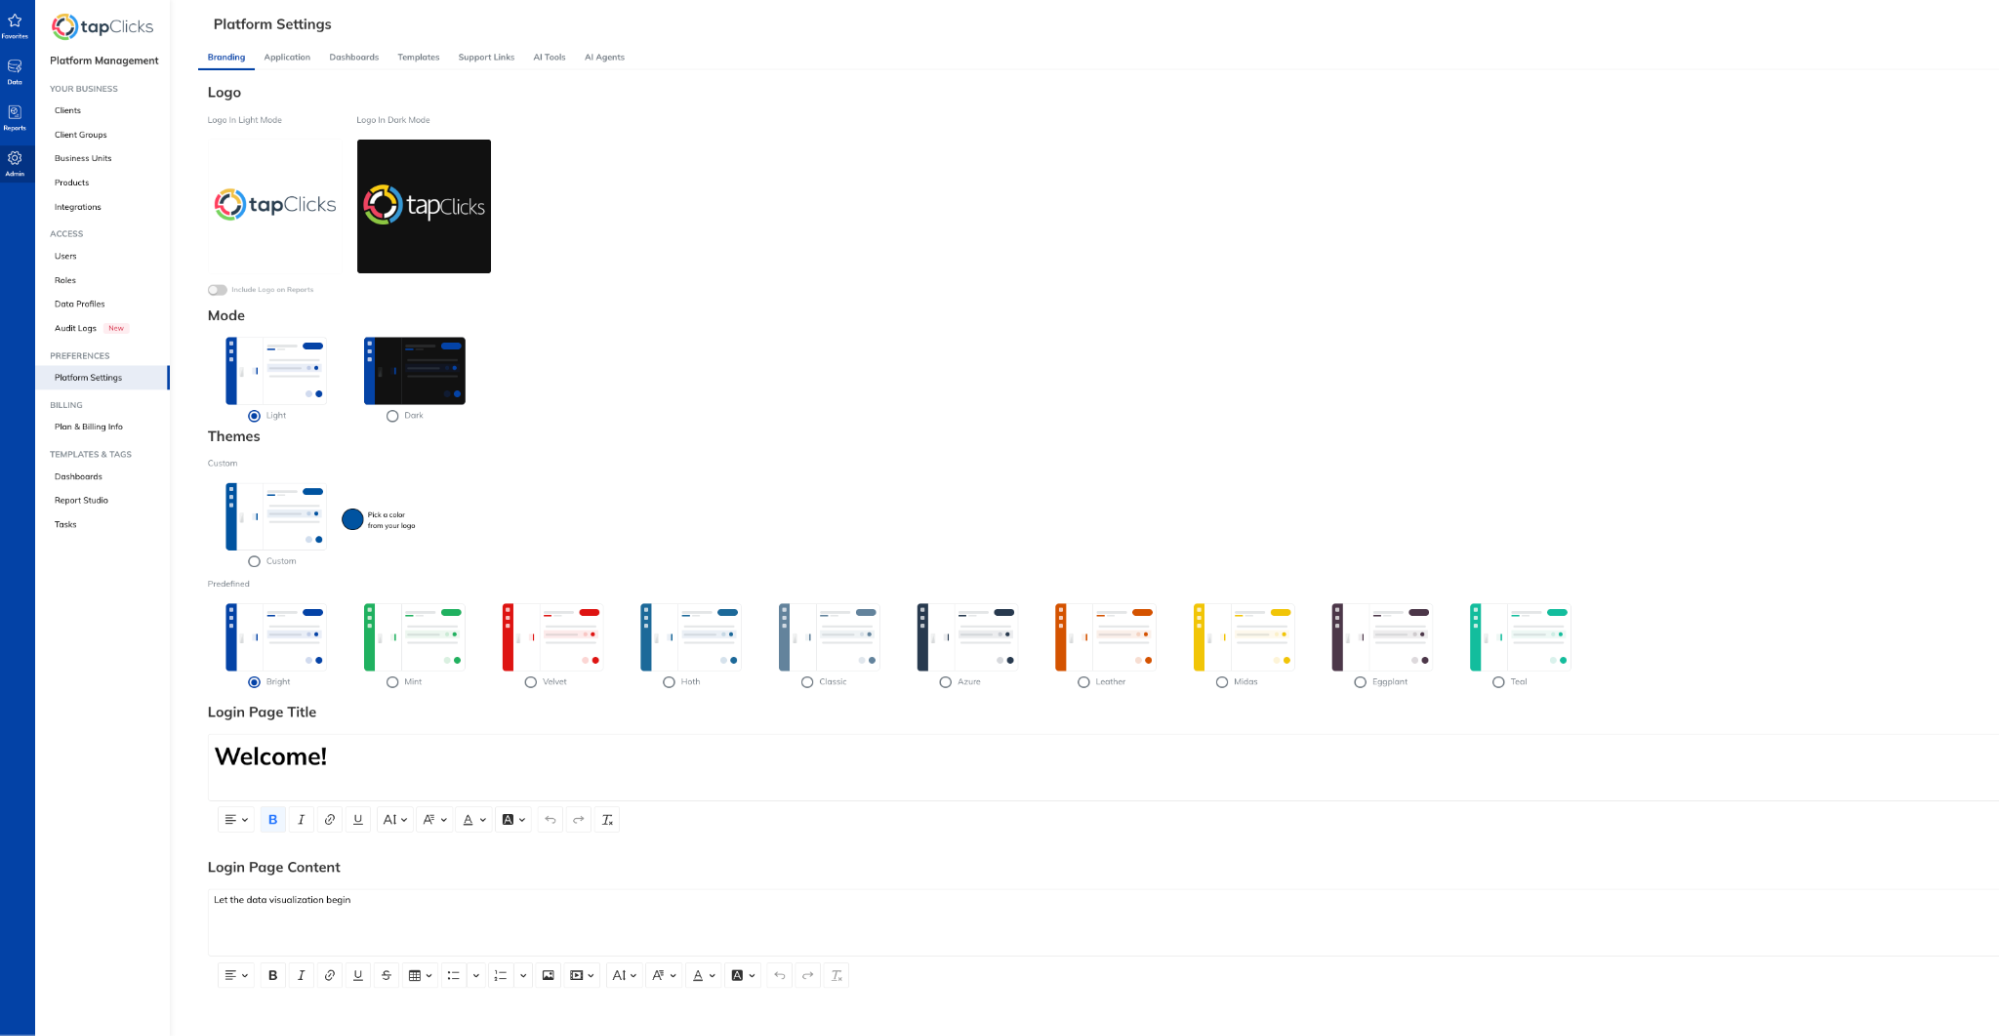
Users find this level of customization limiting, still:
One says that they don’t like “not being able to change pie chart section colors beyond what is assigned at the dashboard level.”
By contrast, Whatagraph gives you more visualization freedom with less effort.
You can customize the full report—widget styling, chart types, layout spacing, color schemes, and branded elements—without hunting through nested side panels.
And because styling happens in a unified editor, you can actually see what your client will see, as you build.
 Patrick C.,’s recent review describes us best:
Whatagraph is extremely flexible, the visuals are beautiful (which is important for having clients be engaged in the reports), very customizable to make complex data easy to ingest for the client.
In fact, you can compare TapClicks’ reports vs. Whatagraph’s below:
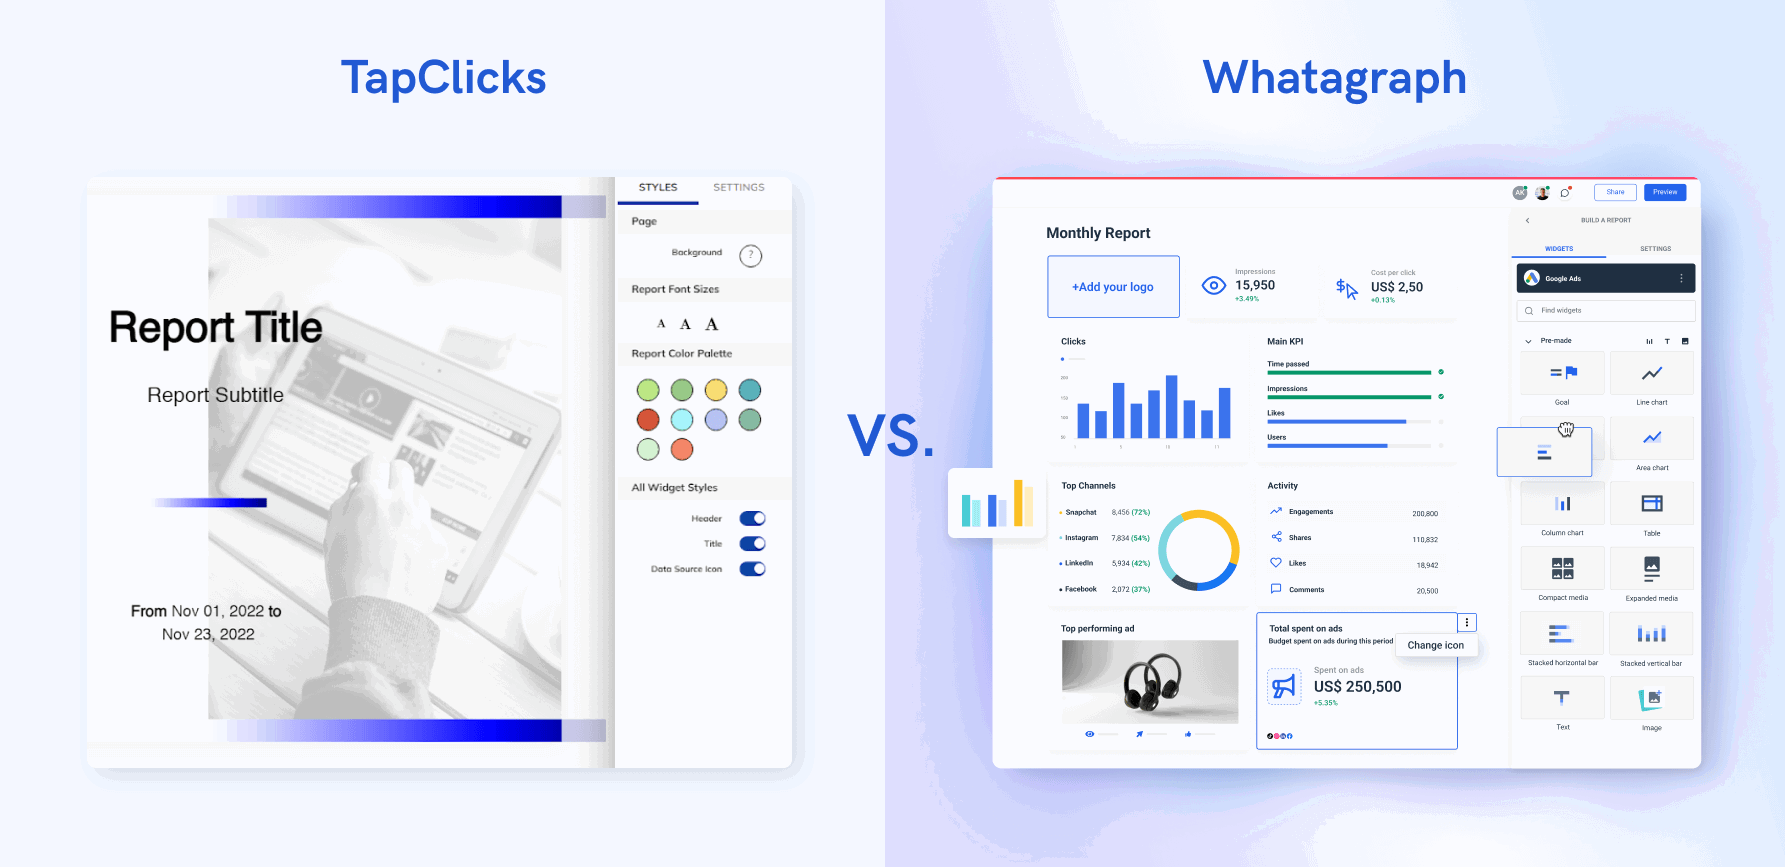 You can see how Whatagraph’s report is clean, sleek, and easy to read and understand—perfect for reporting to clients who might not understand digital marketing and metrics as much as you do.
And this is exactly what Stef Oosterik, Quality Manager at Dtch. Digitals agency loves about us.
Previously, they were using a static reporting tool with old-fashioned reports. But once they switched to Whatagraph, the agency saw a 50% decrease in client churn because clients could now easily understand the reports and the value they were driving.
Stef told us:
Thanks to Whatagraph’s attractive visuals, clients can see the professionality behind our agency. Whatagraph really helps us not only get clients on board but also keep them within our agency. Our churn rate is very, very low.
Read the full case study.
Are the dashboards interactive or static displays?
TapClicks describes its Report Studio as offering “interactive, data-driven graphics”—and technically, that’s true. Widgets can include hover states, clickable tabs, and live-updating visuals when new data is ingested.
But here’s the nuance: interactivity is baked into the graphics—not the experience.
What that means in practice is:
- You can build charts that update as data refreshes.
- You can’t click into a widget to drill down or change filters on the fly.
- Clients can’t customize their view or explore data dynamically without editing access.
So while the visuals are technically live, the dashboards function more like polished slides than interactive tools.
They’re great for top-level visibility—but if your client wants to toggle platforms, switch time ranges, or zoom into a campaign with a click? TapClicks doesn’t offer that level of flexibility out of the box.
What are your sharing options (and how automated/efficient are they)?
TapClicks gives you several ways to share reports—but the workflow depends heavily on where you build them.
Let me explain.
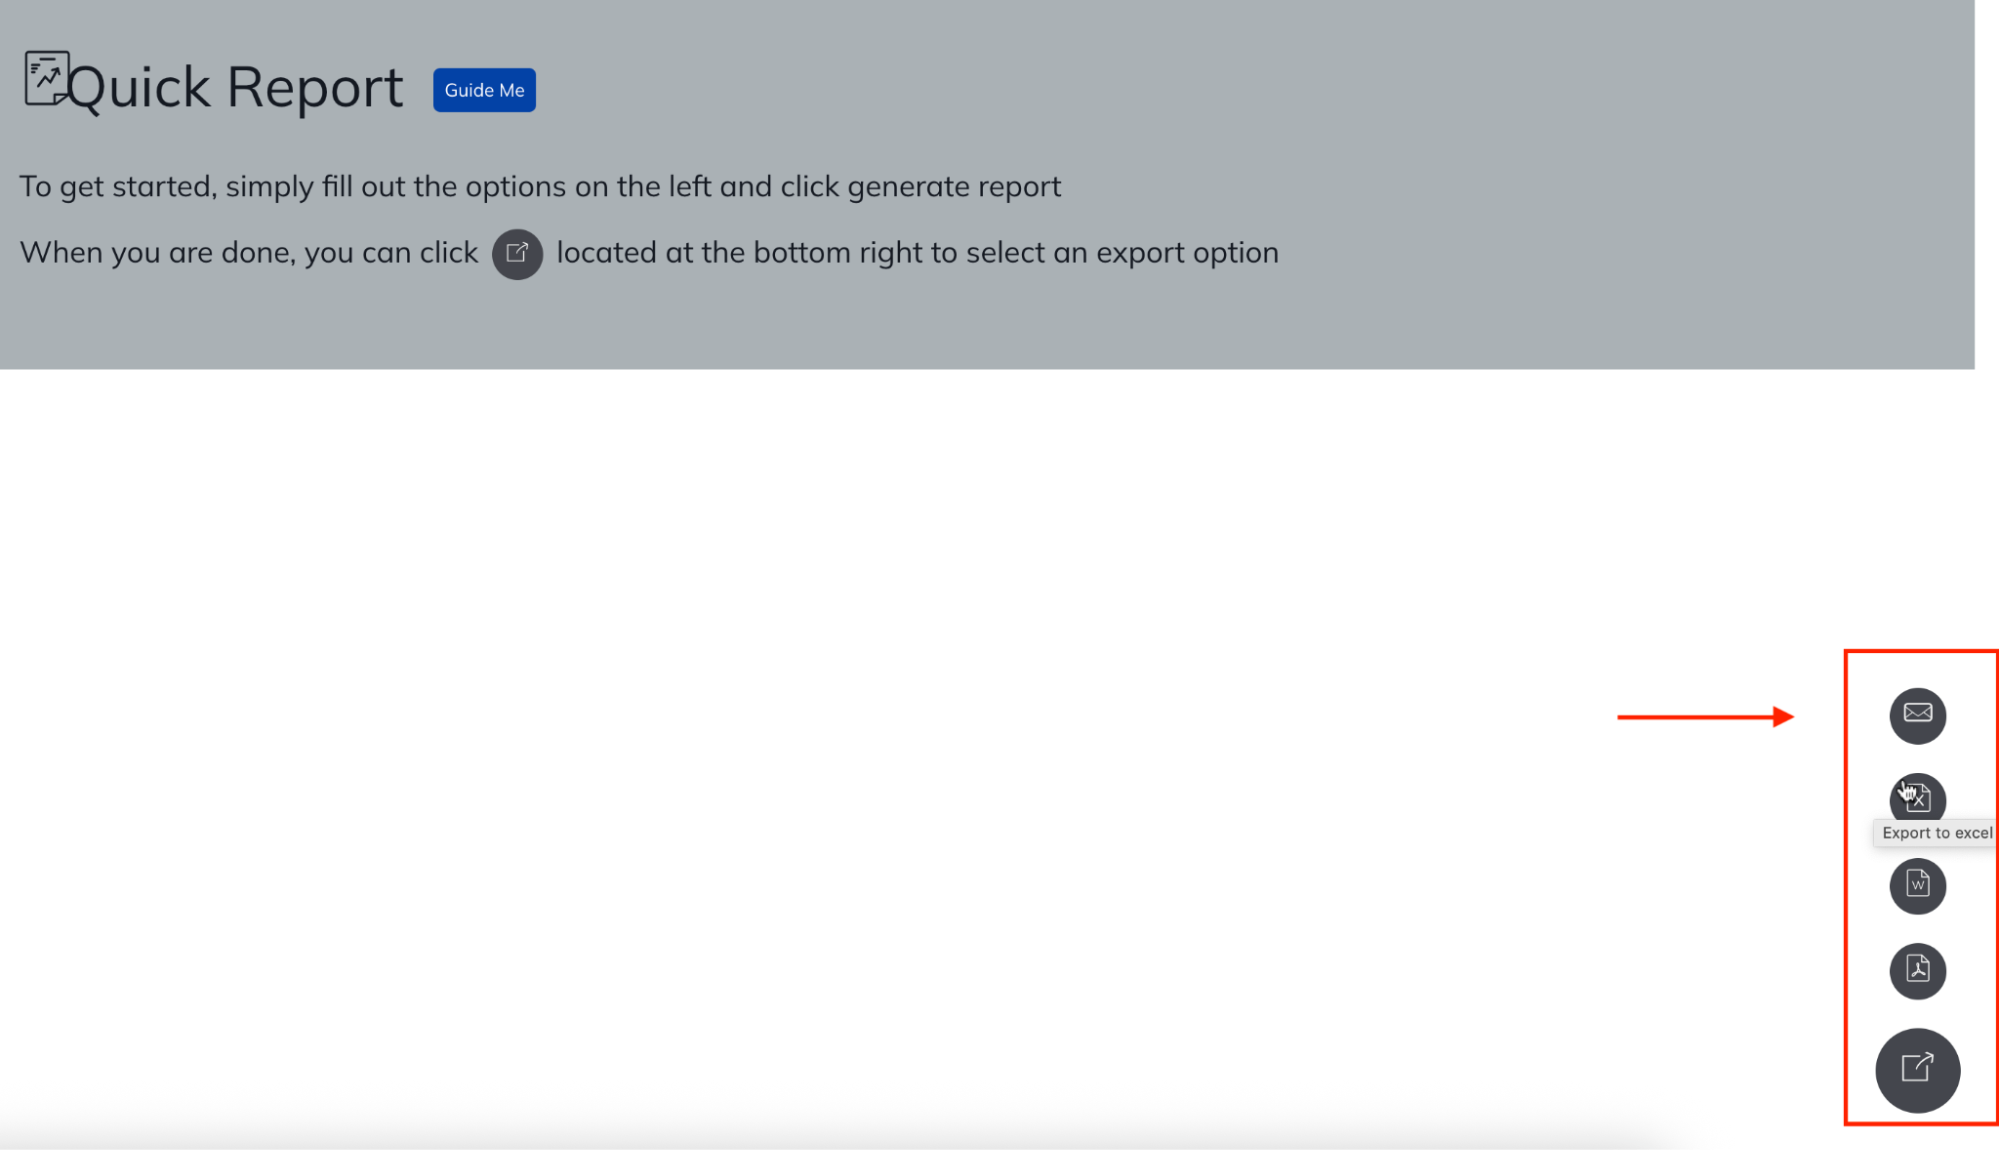
If you use “Quick Report,” you’ll see the most export options: PDF, PPT, Excel, or email. It’s a straightforward setup—just pick your format and hit download or send.
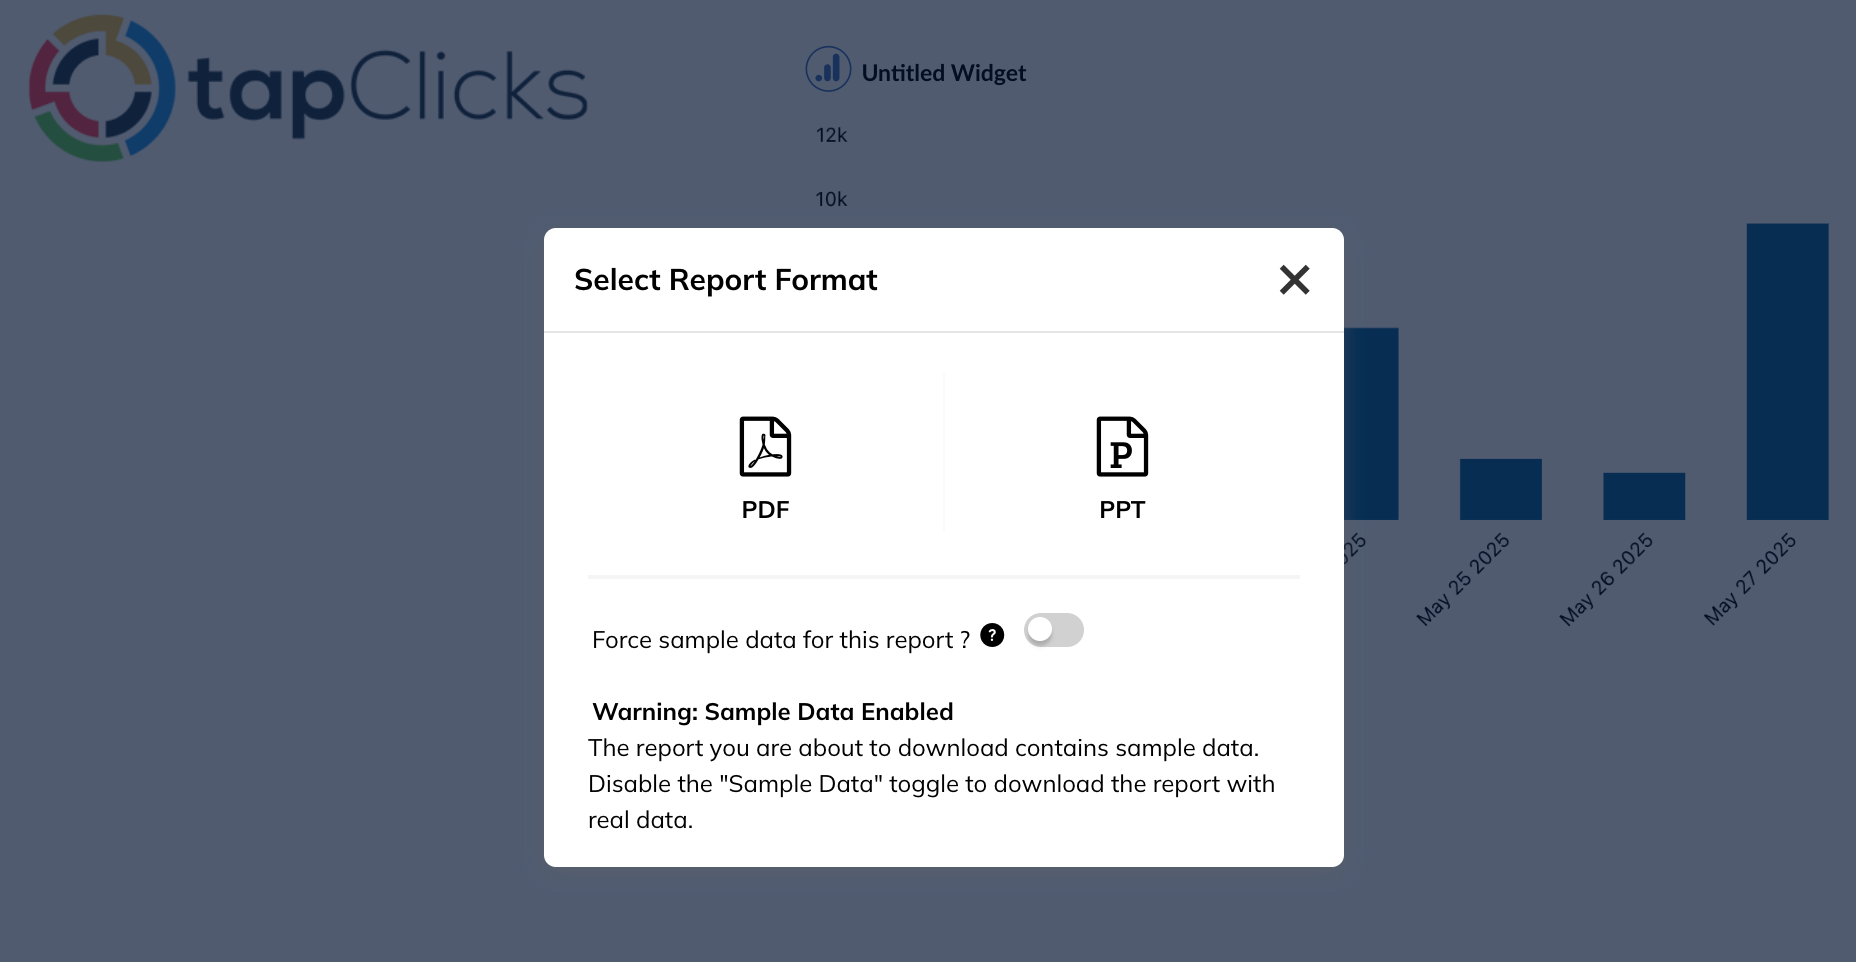
 But if you build your reports in Report Studio, you’re usually limited to just PDF and PPT. There’s no live link or web-view option, and the report is essentially frozen at the time of export.
Want to automate delivery? You can—but not from the workspace where you actually build the report. You’ll have to navigate out to a separate menu called “Report Scheduler,” then fill out a form to configure when and how often each report should go out.
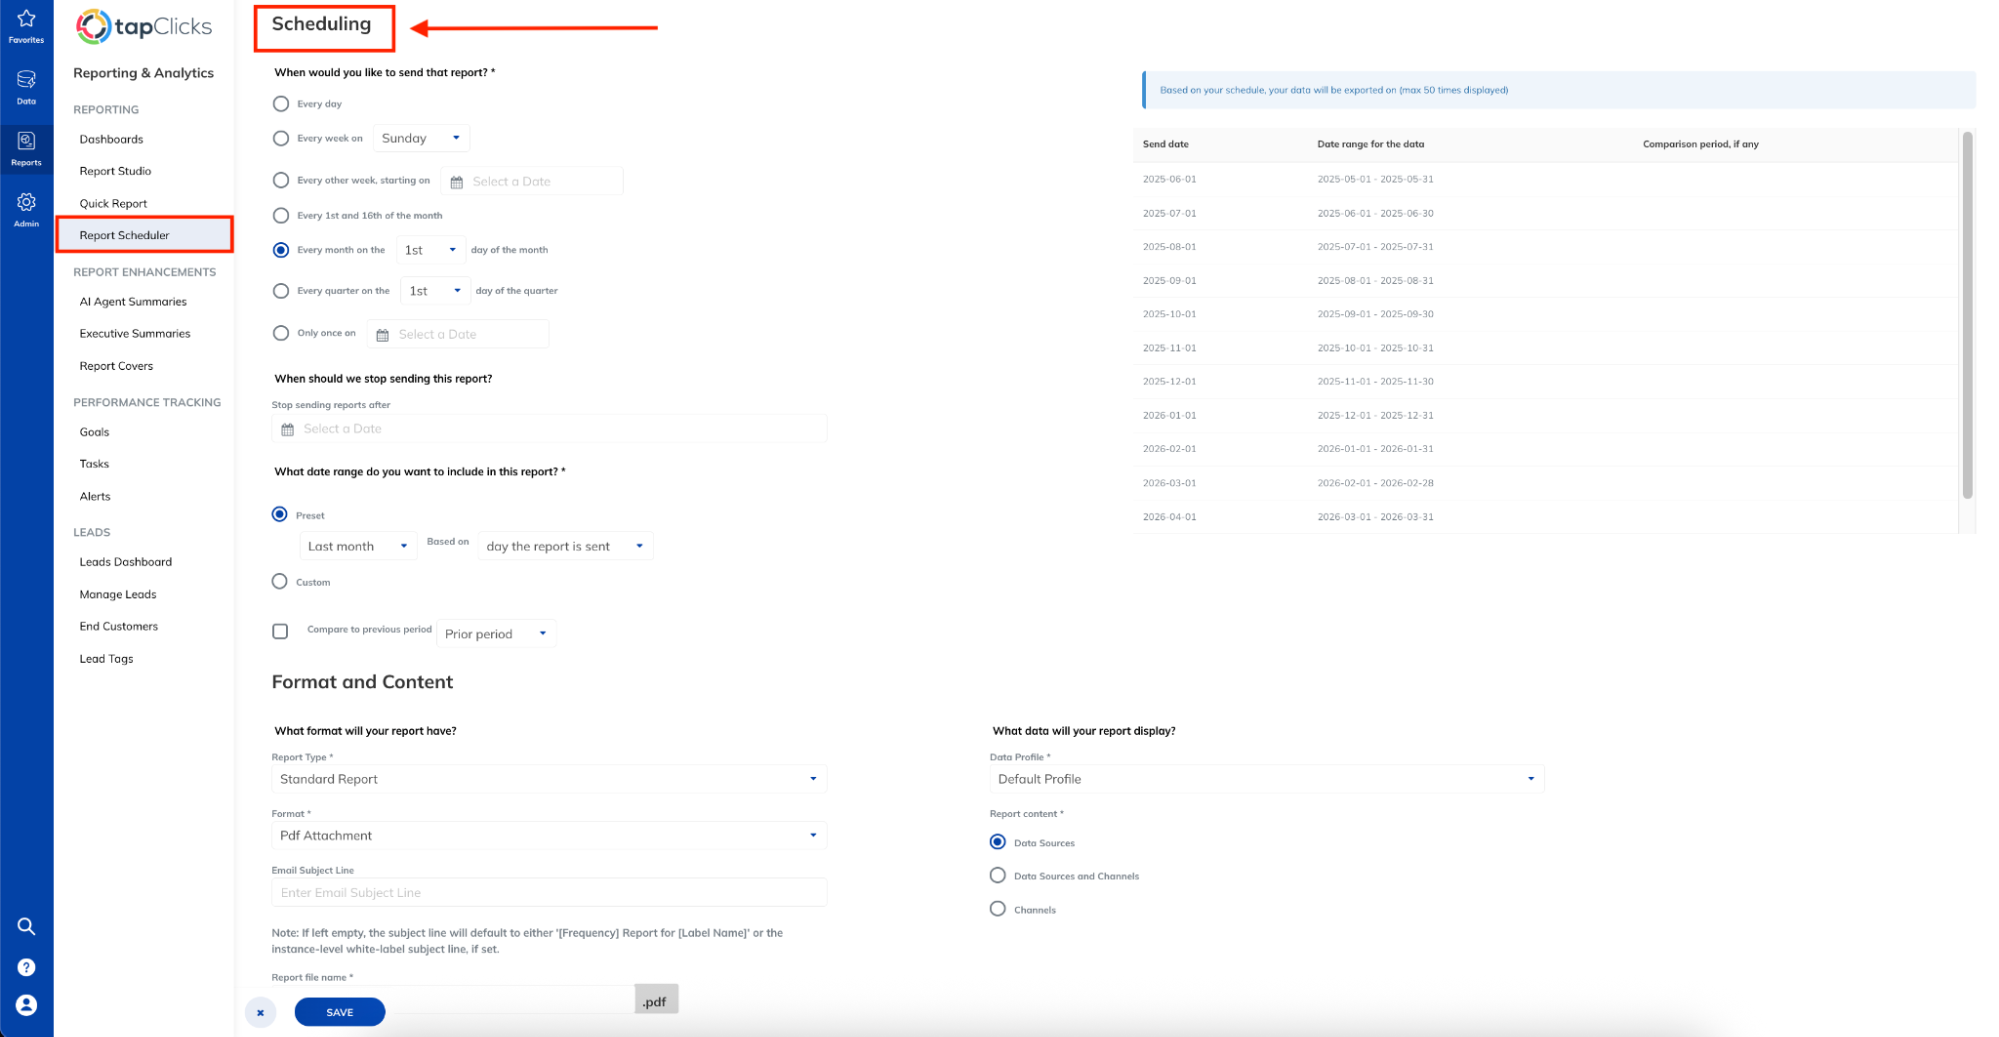
It works, but it’s not very seamless. There’s a disconnect between building the report and setting it live on a schedule. For agencies sending dozens of reports each week, that extra hop can add up fast.
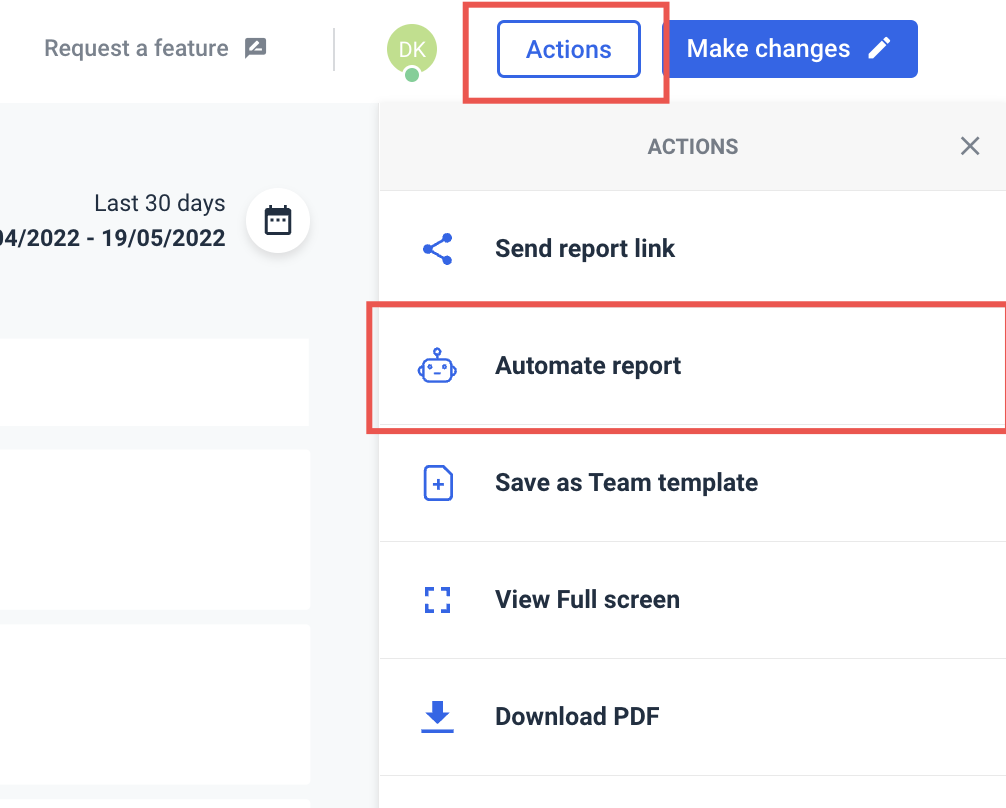
On Whatagraph, there are two helpful options to automate client reports: to review your reports before sending them, and to opt in for an email update when the report is sent. No surprises.
Plus, you can share and automate your reports from the same workspace you’re building your reports—and share them as links so your reports don’t stay frozen in time as a static PDF.
What about AI features for insights?
TapClicks has recently rolled out a set of AI-powered features under its TapInsights tier—designed to help agencies surface trends faster and get more strategic with their data.
These include:
- AI Summary Agents that auto-generate performance narratives.
- Widget AI Executive Summary, which adds natural-language blurbs next to charts.
TapGoals with prescriptive analytics—suggesting next steps based on campaign performance. - Configurable Alerts for anomalies and threshold breaches.
- Benchmark Widgets to see how your performance stacks up against internal or external standards.
In practice, these tools still feel early-stage. The summaries are generic unless your datasets are extremely clean. The AI doesn’t yet offer much nuance or campaign-specific interpretation. And setting up things like TapGoals or Benchmarks requires quite a bit of upfront rule configuration—it’s not plug-and-play.
Also worth noting: these features are only available on the TapInsights plan, which starts at $1,399 (plus whatever TapData plan you’re on). So, if AI is the primary thing you’re after, you’ll need to budget for the top-tier plan and invest time in setup.
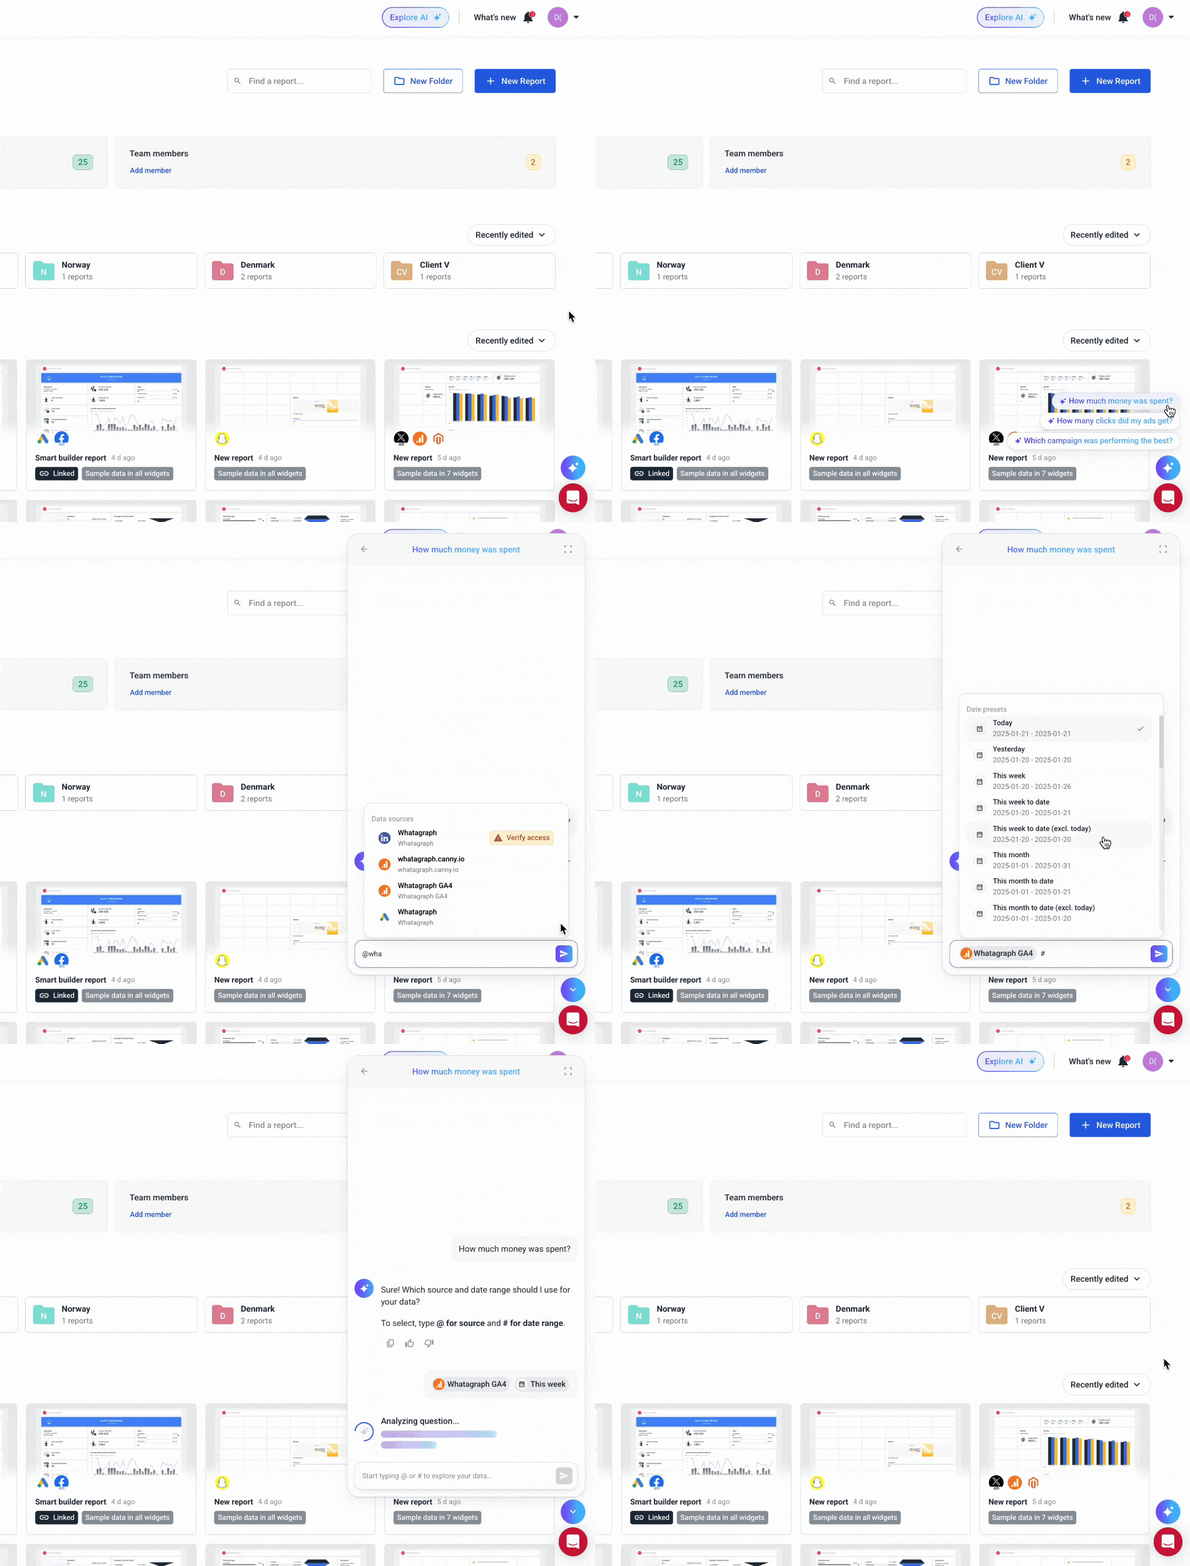
If you try Whatagraph’s AI chatbot, you can actually talk to it. Ask questions about campaign performance in plain English, and it’ll surface insights instantly—without digging through filters or dashboards.
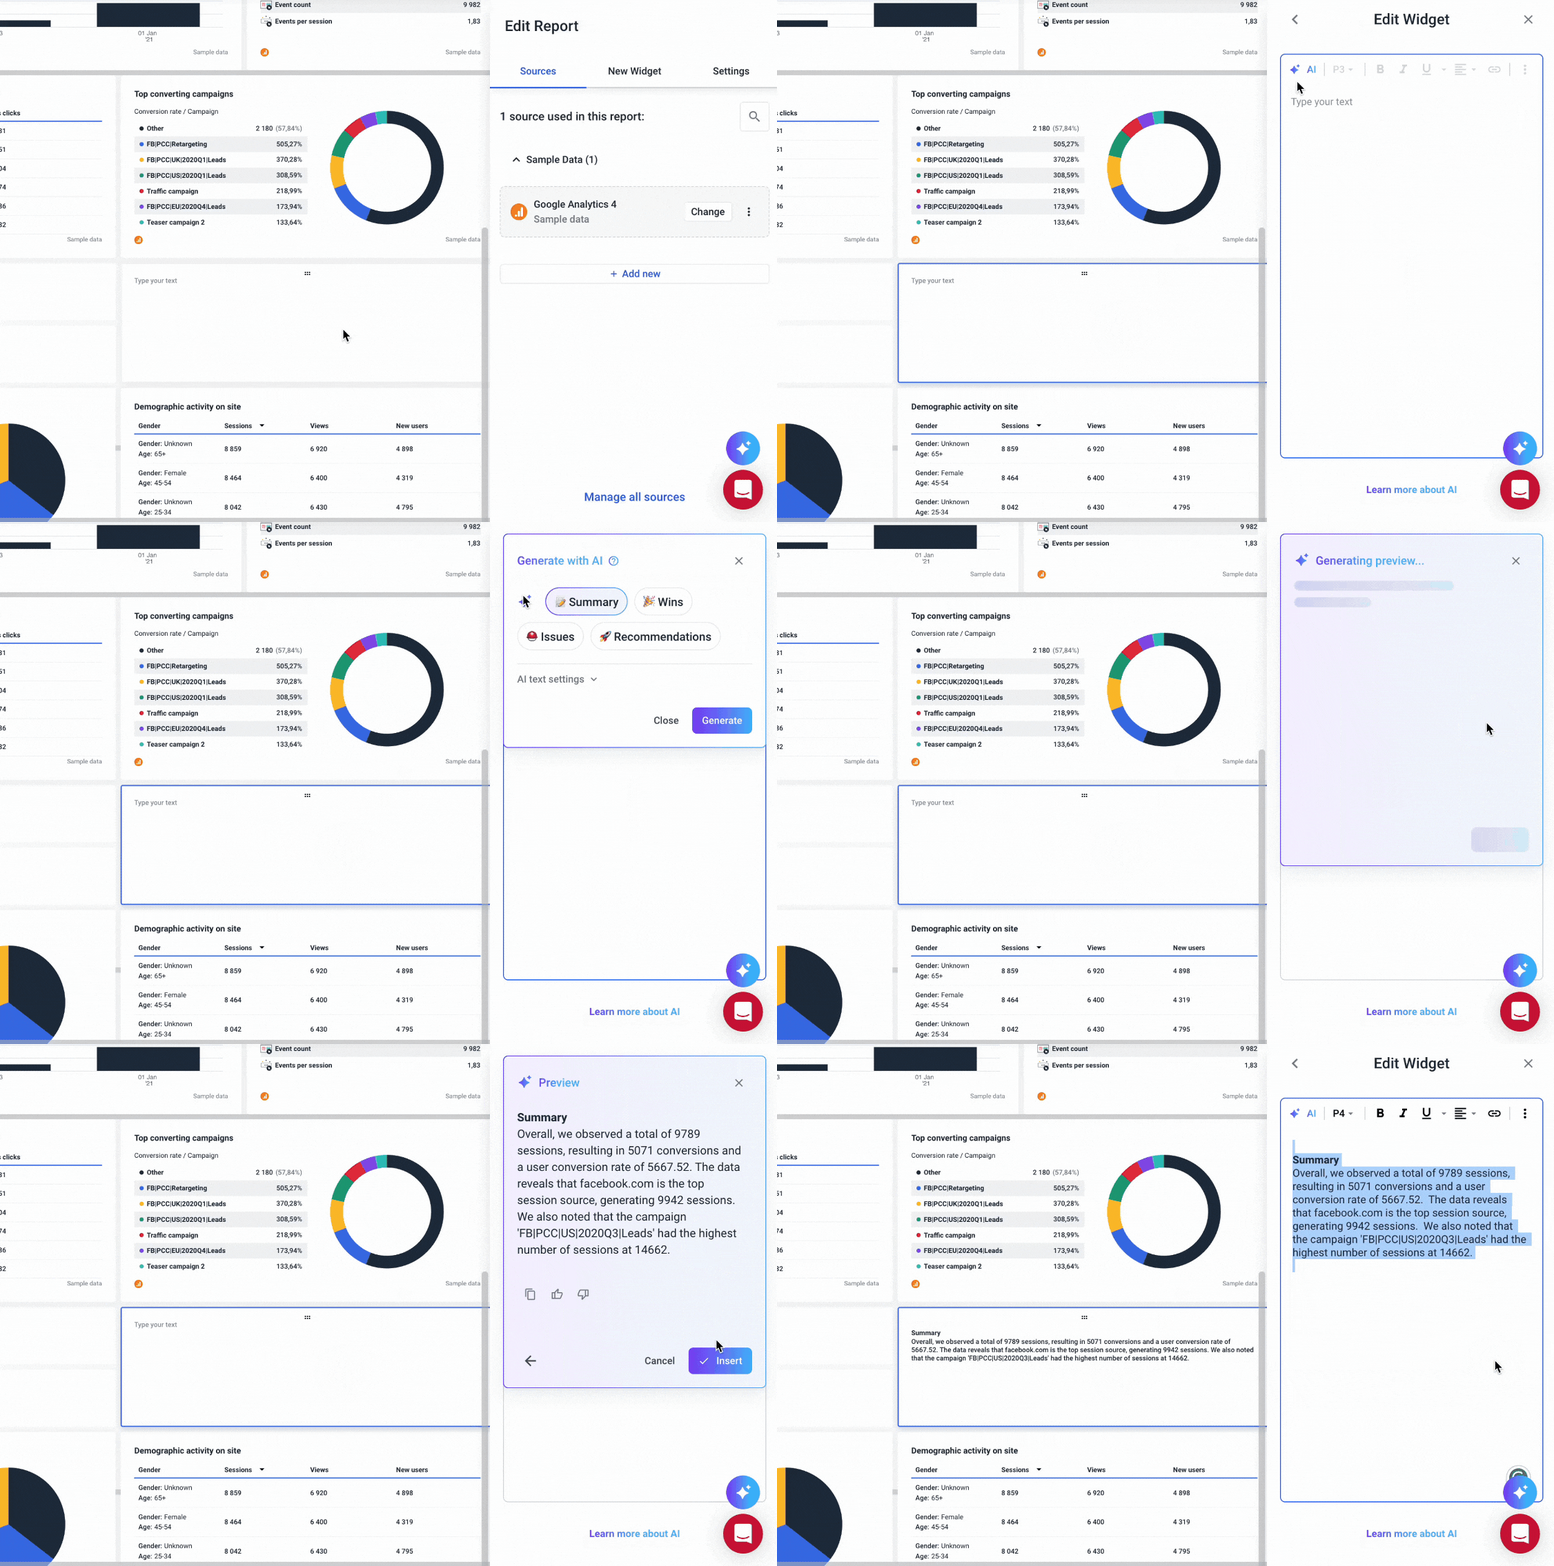
Plus, you can also ask our AI to write out performance summaries for you based on your data on a specific report page, or for the entire report. The summaries are fully customizable. You can choose:
- The content: summary, recommendations, wins, and/or issues
- The format: long or short
- The language: English, Dutch, Arabic, Danish, Finnish, French, German, Italian, Traditional and Simplified Chinese, Spanish, Swedish, Thai…the possibilities are endless really
Is there proactive monitoring?
TapClicks lets you create alerts from multiple entry points: dashboards, widgets, and goals. But each alert requires a fairly manual setup—selecting data views, assigning users, configuring rules, and toggling options across several screens.
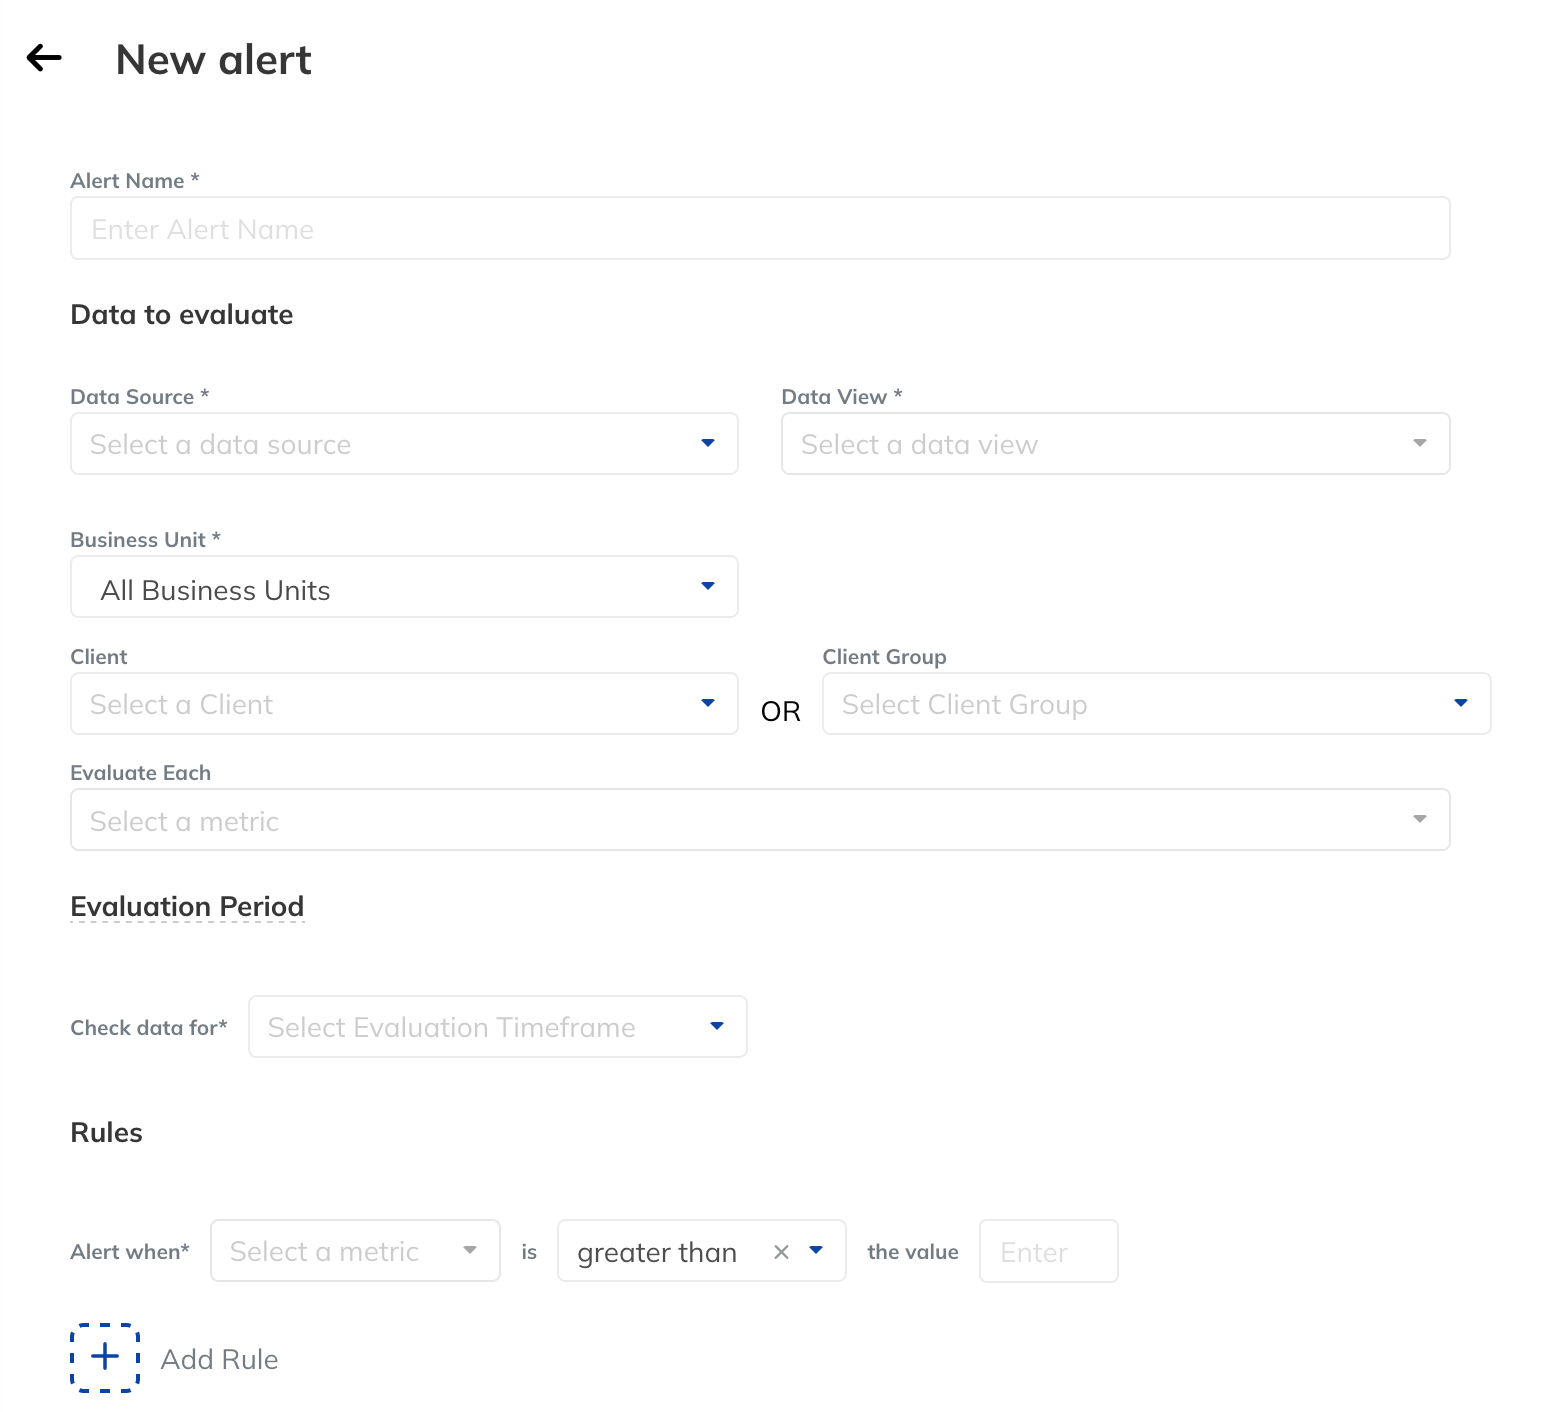
It’s powerful, yes, but process-heavy.
In Whatagraph, Goals & Alerts are built to be fast, unified, and intuitive. You can:
- Build an internal monitoring dashboard with all your clients, campaigns, channels, and KPIs in one place
- Set goals (target, limits, or ranges) for KPIs that matter most to you and your clients
- Get daily or weekly alerts of whether these goals are on or off track via email, Slack, or within Whatagraph
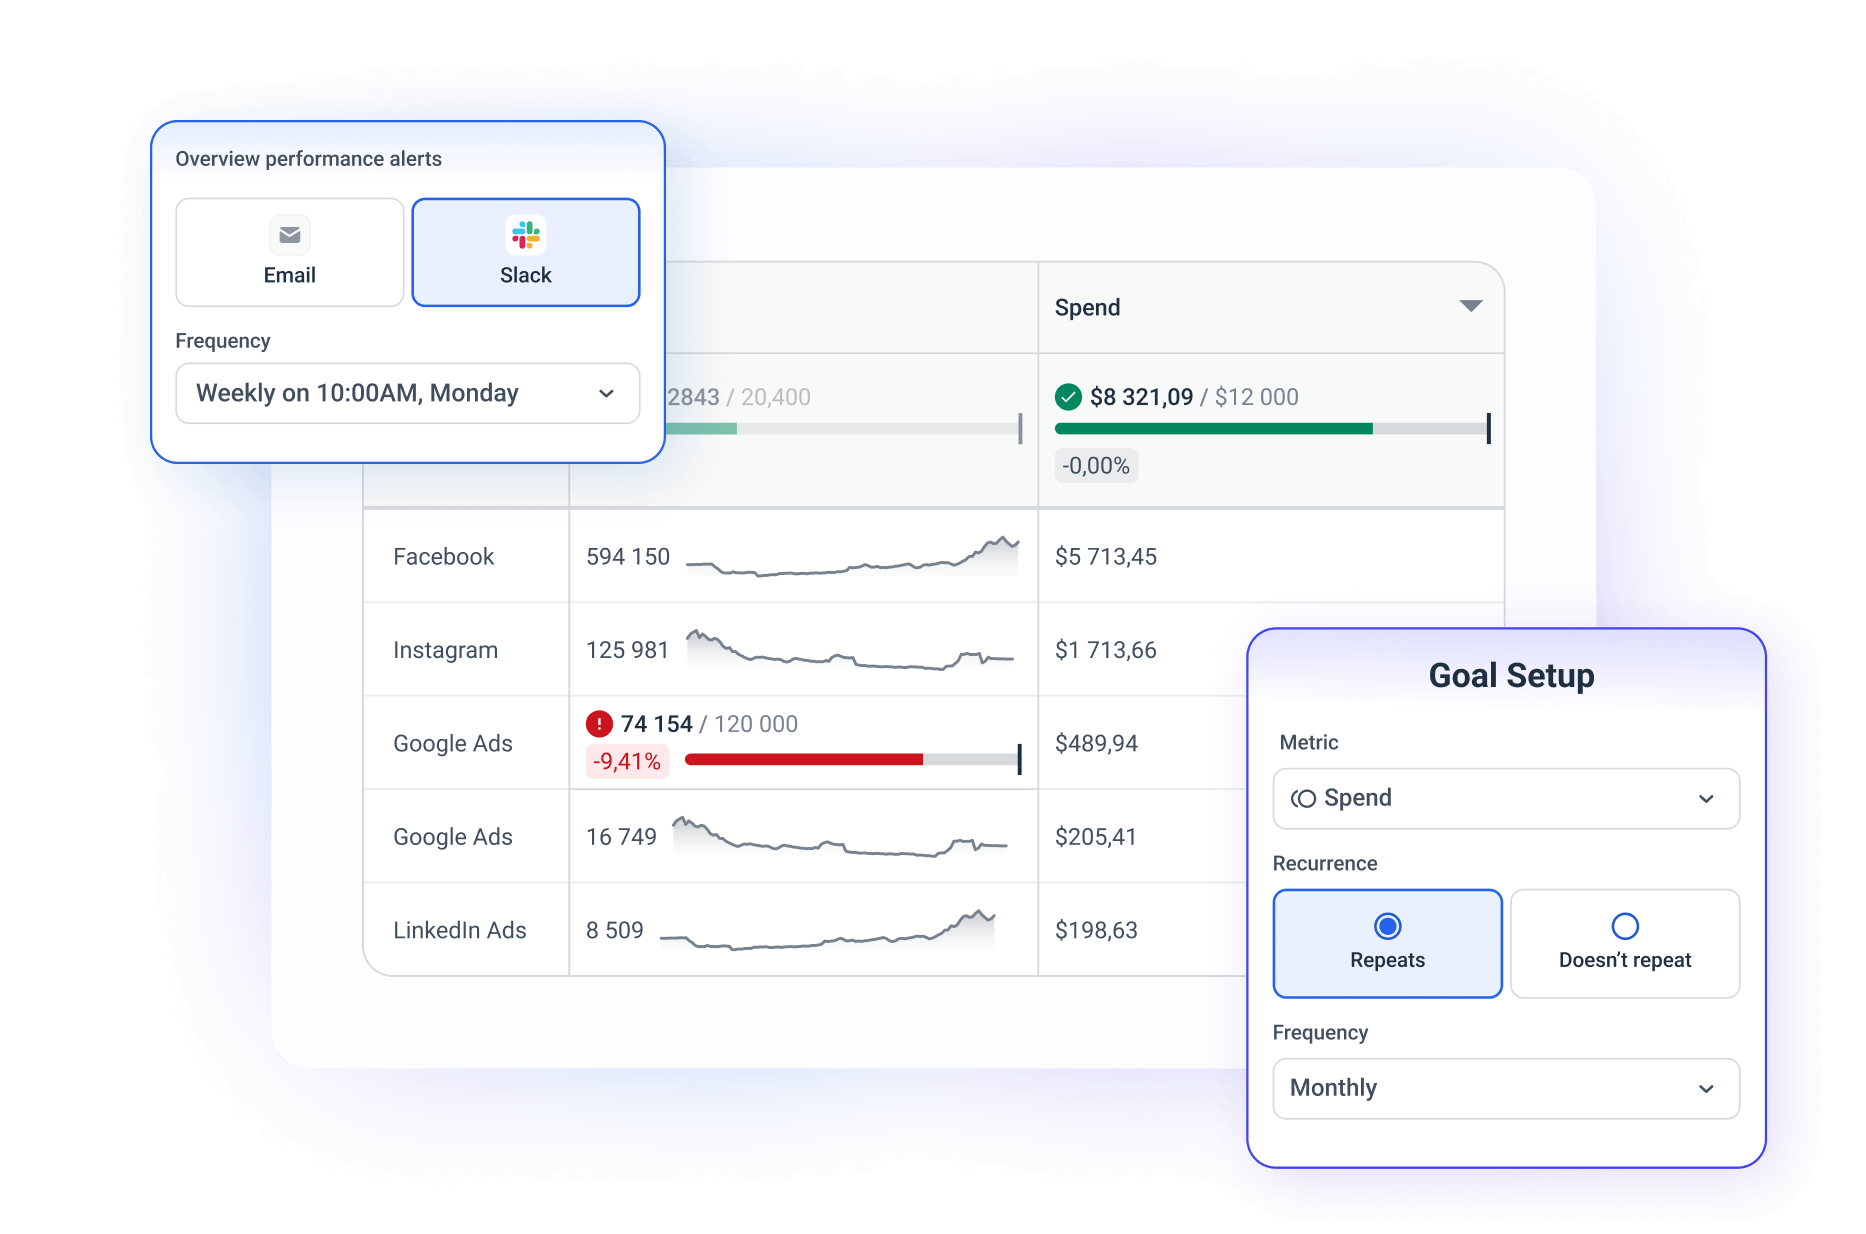 And early testers are already feeling the difference. Nico Tracewell, Media Planner at Swash Labs shared with us:
Whatagraph’s Goals & Alerts feature is exactly what we've been hoping for. It’s going to help us so much with staying on top of our campaigns and making sure we’re delivering great results for our clients.
TapClicks reports are powerful but time-consuming to build, customize, and automate—especially if you want true interactivity or AI insights.
Feature Deep Dive #5: TapClicks Security
When you’re dealing with sensitive marketing data—client spend, performance metrics, platform credentials—security is table-stakes.
According to their documentation, you’re in good hands.
How do they approach data encryption?
TapClicks uses HTTPS/TLS 1.2+ to protect data in transit. Devices and sessions are locked after inactivity, and all access is restricted by role, minimizing exposure.
Are they covering GDPR basics?
Yes.
TapClicks references GDPR-aligned practices through its access controls, data minimization (Least Privilege), and supplier risk assessments. Employees also go through NDA agreements and structured onboarding/offboarding to protect sensitive information.
Can you control who sees what (role-based access)?
Absolutely. TapClicks uses role-based access control (RBAC) principles like Need-to-Know and Least Privilege. Admins can assign data profiles, dashboards, and reports to individual users and client accounts.
If you want to take client data security a step further, Whatagraph gives you the option to secure your reports with a password, so you know that only the people who need to see the report will have access to it.
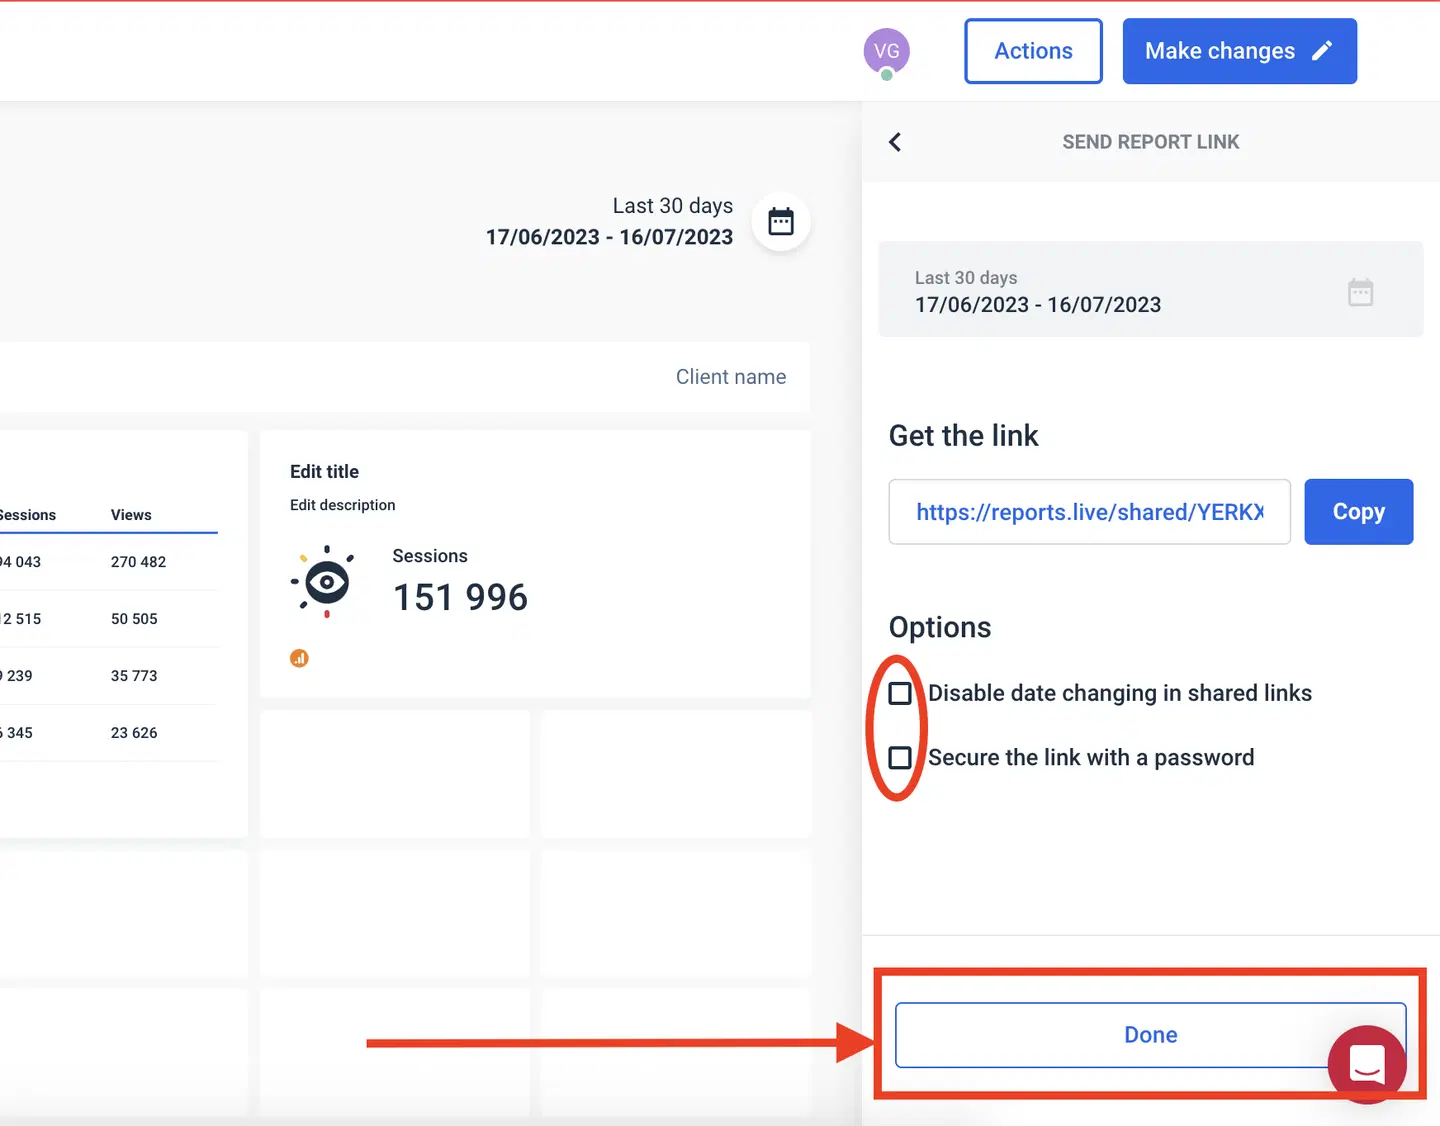
What about single sign-on (SSO)?
Yes, TapClicks supports Single Sign-On (SSO) along with Multi-Factor Authentication (MFA) and hardware token options to secure account access.
Your data is safe. TapClicks offers strong enterprise-grade security—TLS encryption, role-based access, GDPR alignment, SSO, and MFA are all covered.
Feature Deep Dive #6: TapClicks Customer Support
If you hit a snag with TapClicks—something breaks, a feature confuses you, or data integration just looks wrong—what’s their support really like?
Is there a dedicated Customer Success Manager (CSM)?
Yes—but it depends on your plan. TapClicks does offer a dedicated CSM for enterprise-level customers or those on higher-tier plans. This includes regular check-ins, onboarding help, and account-specific support. However, small businesses and lower-tier users report less access to personalized guidance.
At Whatagraph, every plan comes with a dedicated Customer Success Manager—no exceptions, no fine print.
Our customer service is why users like Patrick Cronin LOVE us:
…they not only take continuous feedback and add new features based on it but one time they went way above and beyond for our agency and completely re-worked their API so we could get some specific valuable data in our reports. Don't think I've ever seen a software willing to go so above and beyond…
Is there quick live chat?
No.
TapClicks doesn’t currently offer a responsive live chat option on its main platform interface. Most support interactions happen via email or through their ticketing system. This can lead to delays during urgent issues, especially when clients are navigating a time-sensitive report or dashboard issue.
In contrast, at Whatagraph, we offer 18/5 live chat (with human support) that replies within 4 minutes and resolves most issues within 4 hours.
What are the main ways to get help?
- TapClicks Knowledge Base: Most SaaS companies, TapClicks included, maintain an online repository of help articles, how-to guides, troubleshooting steps, and frequently asked questions.
- TapClicks Academy: They offer structured ways for your team to learn how to use the platform better. (It's good to check if these trainings cover what your team needs and if there are any extra costs involved.)
- Ticket system: This is your main route to officially report an issue or ask a technical question directly to their support team from within your workspace.
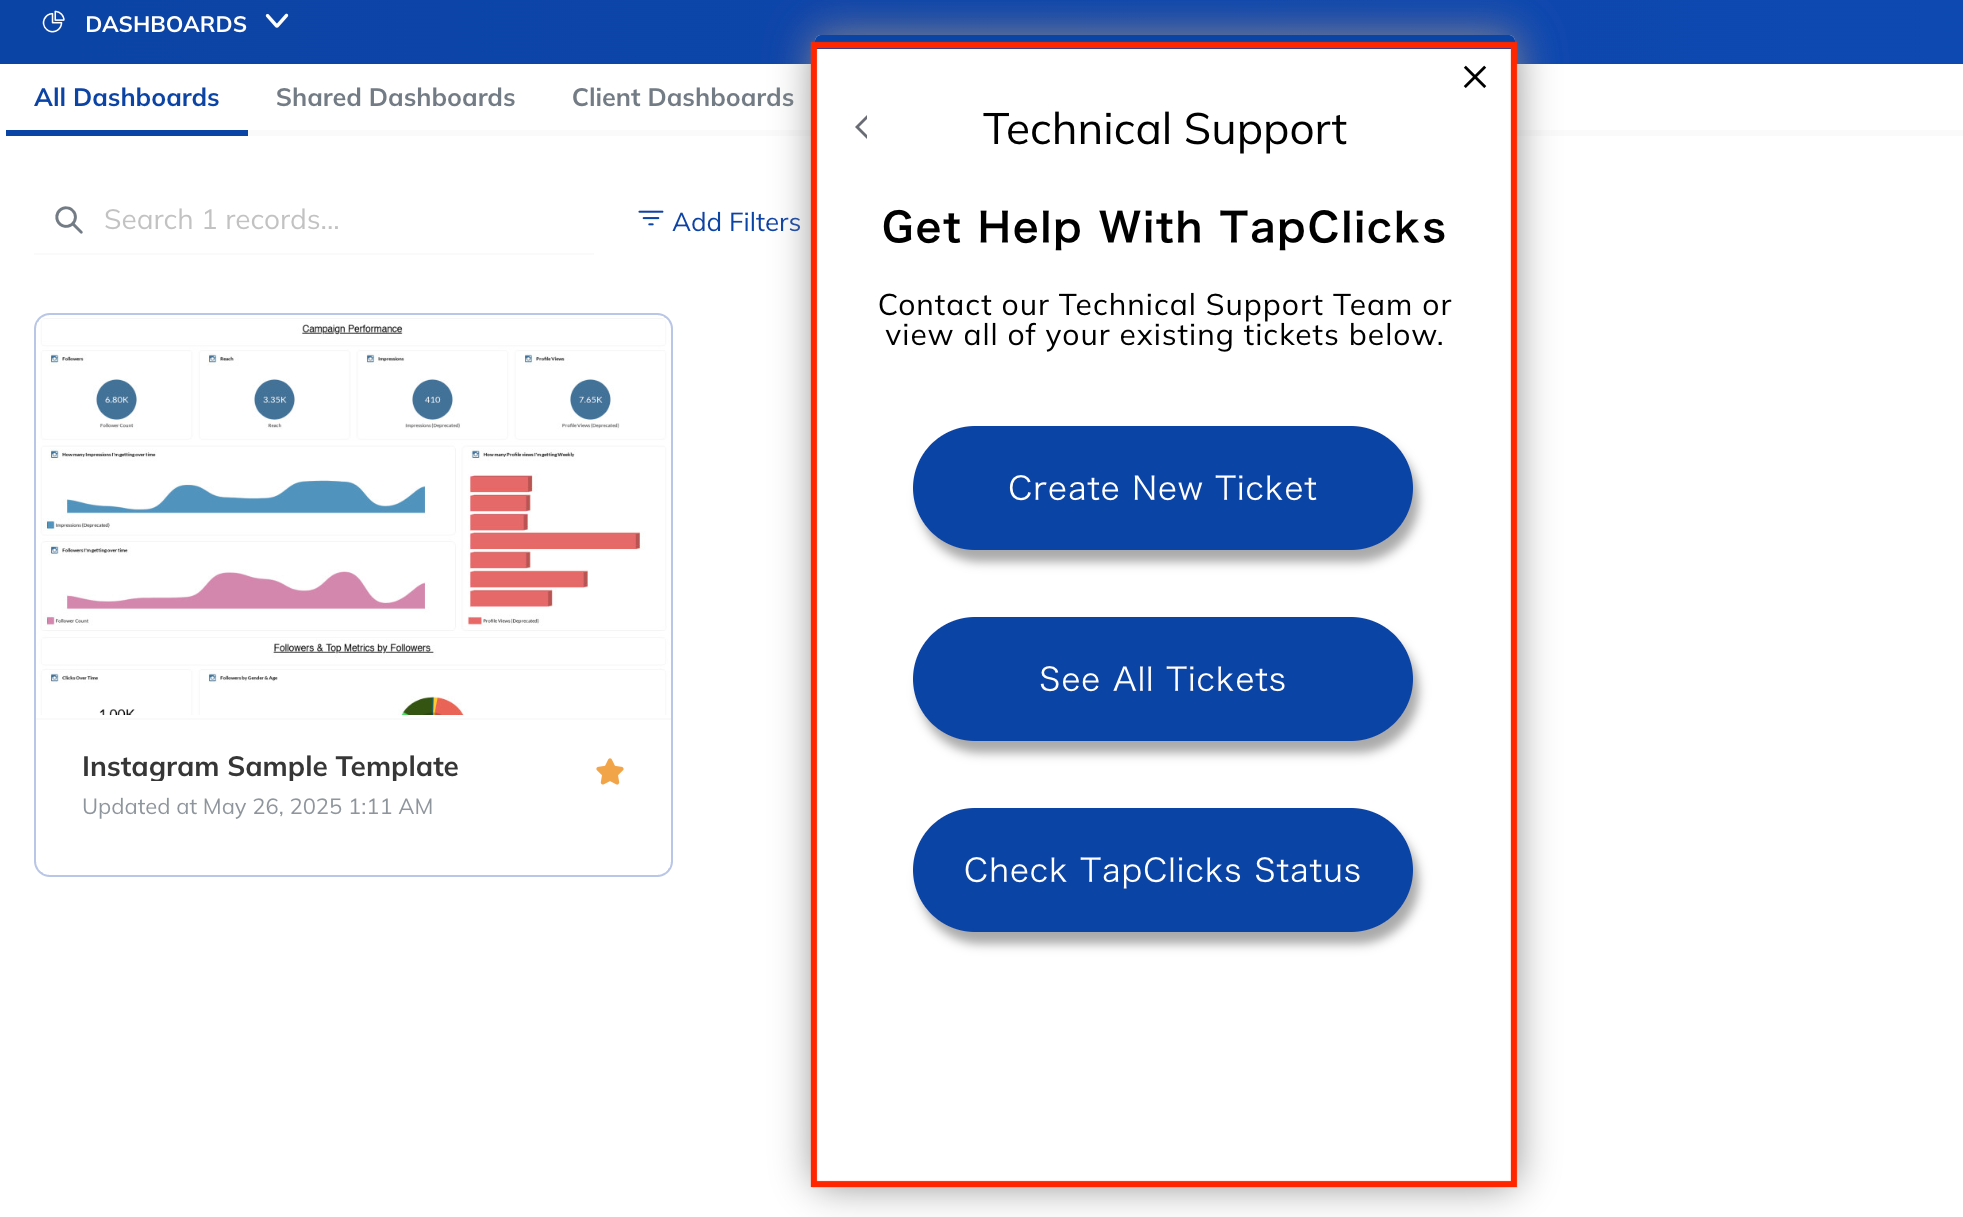
What are real users saying about their experience?
Based on Tapclicks reviews compliants online, it’s pretty clear that experiences with TapClicks support can be a real mixed bag—a tale of two very different outcomes.
One fairly recent review didn't mince words at all, stating: “Nothing I hated every aspect of working with these folks... the service is also beyond horrible and their responsiveness is slow...”
 On the flip side, other users report positive interactions.
For instance, one user found TapClicks became a valuable tool "once completing the one on one training," and crucially adds, "Whenever I run into an issue I cannot troubleshoot myself, support will promptly assist in resolving the issue."
Another user offers a more specific timeframe, noting: "Customer support gets back to you within a day or two."
For some, this might be a reasonable turnaround, especially for non-critical issues.
At Whatagraph, exceptional customer support is a pillar of who we are.
It’s why verified users leave us blush-worthy testimonials:
Apart from all the valuable things Whatagraph has in itself, throughout the years we've chatted with their support for minor issues multiple times, and they were very quick to fix everything of even make improvements based on our feedback. Stellar group of people, these.
TapClicks offers decent support—if you’re on a high-tier plan. Lower-tier users often face delays, no live chat, and impersonal ticketing systems.
Final Verdict: When to Use TapClicks and When to Switch
Choose TapClicks if:
- You’re a large enterprise or agency with a dedicated operations team.
- Your reporting needs are highly customized, and you’re willing to invest serious time into setup and maintenance.
- You’re managing a high volume of client accounts and need advanced permissions, TapOrders, or layered business units.
- You can budget for premium add-ons like TapInsights or TapAnalytics to unlock AI features and deeper data modeling.
Consider switching to Whatagraph if:
- You want faster, easier reporting that doesn’t require 100+ clicks just to get client-ready.
- You value flexible data blending, clean visualizations, and quick filtering—without connector limits or platform workarounds.
- You want support that doesn’t hide behind forms—live chat replies in under 4 minutes, plus a dedicated CSM on every plan.
- You need to scale reporting across multiple clients, teams, or brands—without building each dashboard from scratch every time.
TapClicks gives you control. Whatagraph gives you control, ease of use, and speed.
Book a call with us to experience a reporting tool that works with you—not against you.

