


What is a Snapchat Ads reporting tool?
A Snapchat Ads reporting tool pulls your campaign data out of Snap Ads Manager and turns it into clear, shareable reports - in one place, without the manual work.
Without one, you're logging into Snapchat Ads Manager separately from every other platform, exporting CSVs, and manually piecing together a picture of how your campaigns are actually performing. For agencies running Snapchat alongside Meta, TikTok, and Google Ads, that process adds up fast.
Snapchat (Snap Inc) is also becoming harder to ignore as a paid channel. It now reaches 946 million monthly active users, and recent cross-platform data shows a 7.5% ROAS improvement on Snapchat while most other platforms declined. That makes it increasingly important to report on it properly - not just track it inside Ads Manager.
A solid Snapchat Ads reporting tool handles the heavy lifting for you:
- Connects directly to Snap Ads Manager and pulls data automatically
- Blends Snapchat data with other paid channels so you're comparing performance without switching tabs
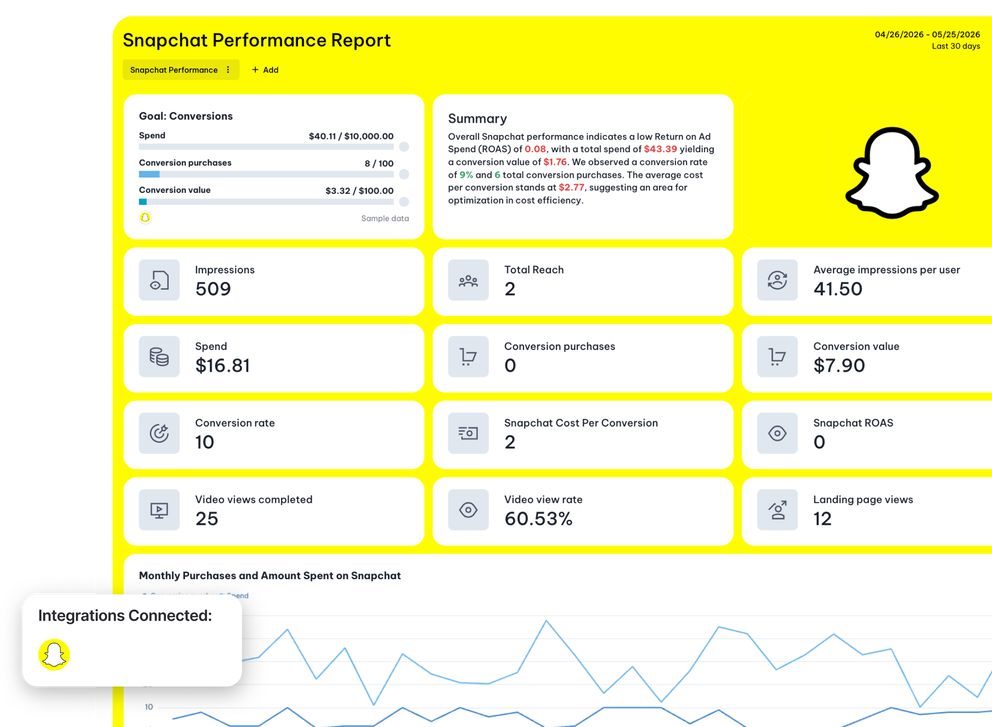
- Visualizes swipe-ups, conversions, spend, and ROAS in a way clients actually understand
- Let's you brand and deliver reports without any manual formatting
For agencies managing multiple clients, this adds up to real-time savings. Peak Seven, an advertising agency managing over 100 ad campaigns, cut their reporting time from 4 hours per report to just 1.5 hours after switching to Whatagraph - saving 63 hours a month that they now spend on strategy and client work instead.
Whatagraph took us to the next level with our clients and within our team. It allowed us to see clearly how our campaigns are performing," said Kim Strickland, Digital Marketing Specialist at Peak Seven.
With Whatagraph IQ, the Snapchat reporting process is even easier. Rather than building reports from scratch every time:
- Describe the report you need, and IQ builds it in seconds - widgets, tabs, metrics, and all
- Upload a client logo, and IQ Themes applies its branding automatically
- Ask IQ Chat a question about your Snapchat Ads data and get a plain-language answer on the spot
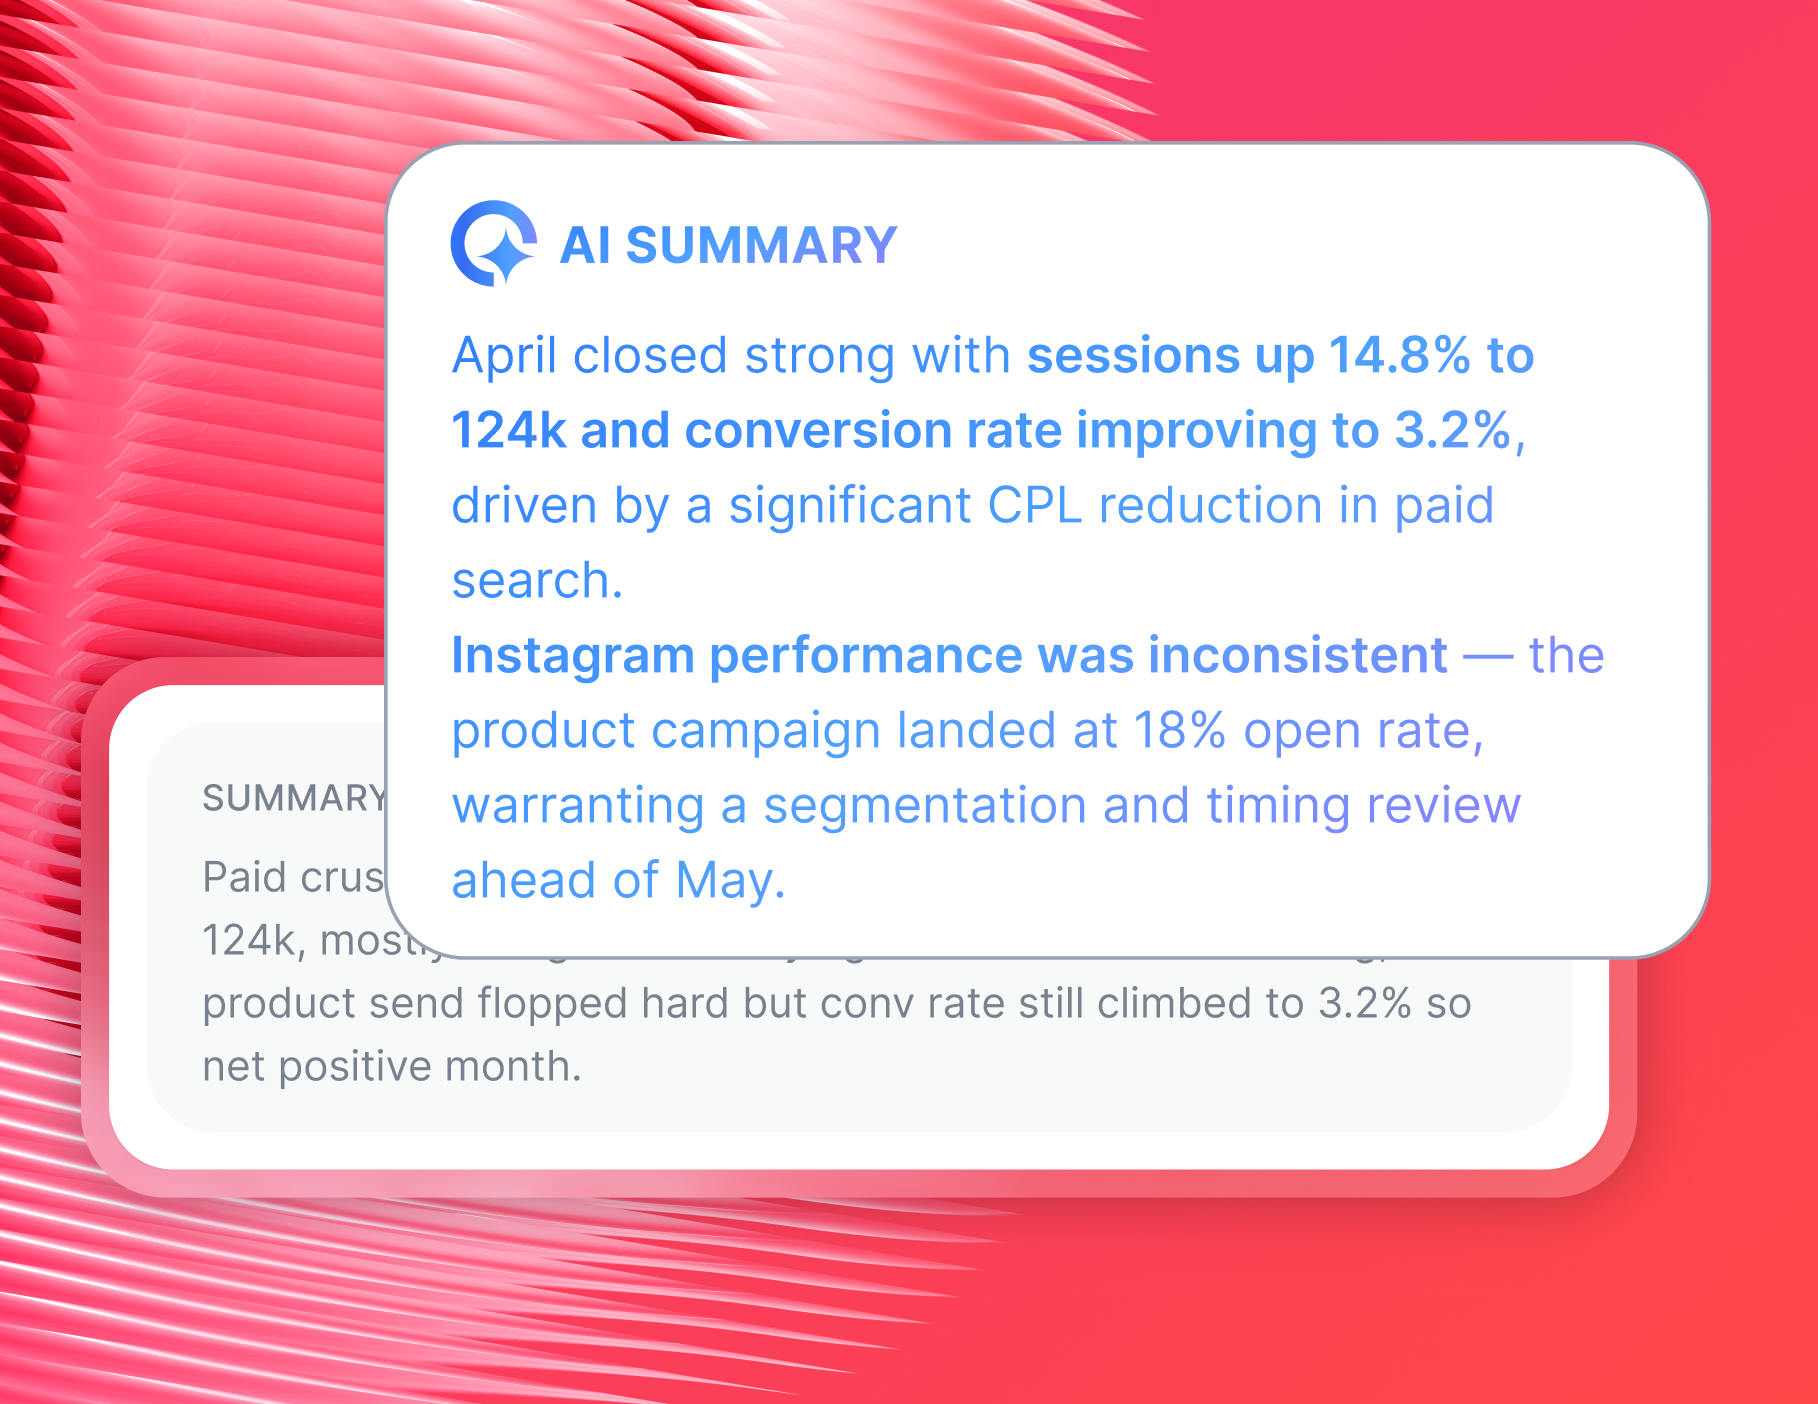
- Let IQ write performance summaries directly inside your reports, so you're not starting from a blank page every month
Whatagraph has also launched an MCP that lets you connect your data to Claude or ChatGPT and analyze your data there.
What is the best Snapchat Ads reporting tool?
There are many options for Snapchat Ads reporting - but most weren't built with agencies in mind.
The native Snap Ads Manager gives you the basics, but:
- It won't combine your data with other paid channels
- It can't send branded, white-labeled reports to clients automatically
- It offers no way to scale reporting across multiple client Snapchat accounts without manual work every time
If you're looking for Snapchat analytics tools that actually fit how agencies operate, here are the top three options:
1. Whatagraph - Best Snapchat Ads reporting tool for agencies
Whatagraph is built for performance marketers, not data teams.
It's the only platform on this list that handles everything in one place:
1. Connecting Snapchat Ads data
2. Blending it with your other paid channels
3. Building branded reports
4. Delivering them to clients automatically
With Whatagraph, every function of your Snapchat Ads reporting - from data connection to delivery - happens inside one platform.
Here's what makes it stand out for Snapchat Ads reporting specifically:
- A direct, stable native integration with Snapchat Ads - no connectors to maintain or breaks to troubleshoot
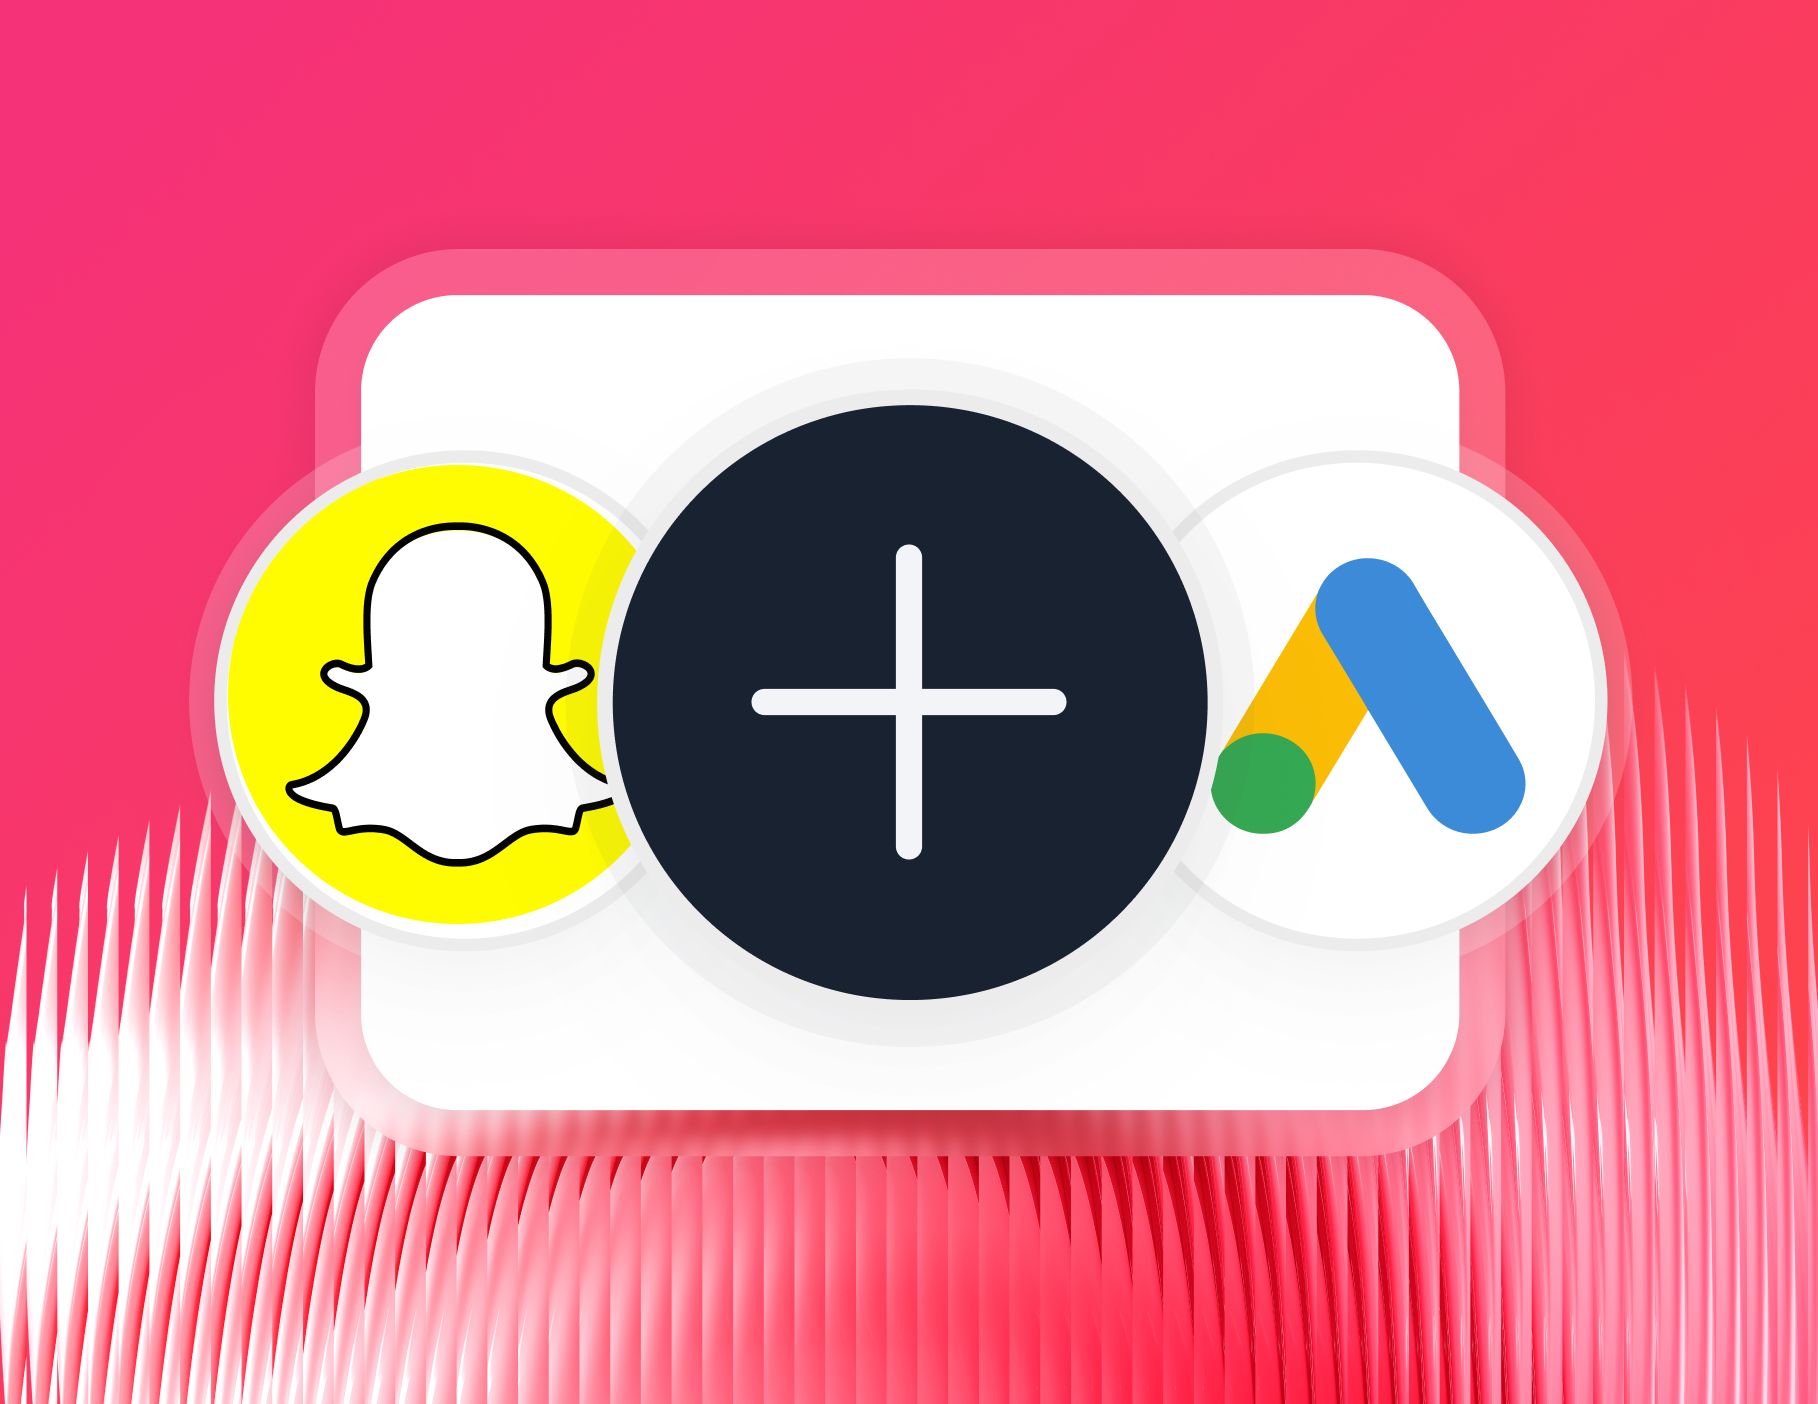
- Cross-channel reporting that puts Snapchat analytics alongside Meta, TikTok, Google Ads, and more in a single view
- 60+ integrations across paid social, PPC, SEO, email, analytics, and ecommerce
- Custom metrics and data blends across platforms - no SQL, no coding
- Automated report delivery via email or Slack, on whatever schedule works for each client
- White-label reports with your agency's branding baked in
- Live links clients can check anytime, with data that refreshes automatically
But what really separates Whatagraph from other Snapchat Ads reporting software is Whatagraph IQ - a suite of AI features that cuts down the time you spend building and analyzing reports:
✅ Build reports in seconds: Describe what you need, and IQ assembles the entire Snapchat Ads report for you - tabs, widgets, metrics, and layout. No drag-and-drop required.
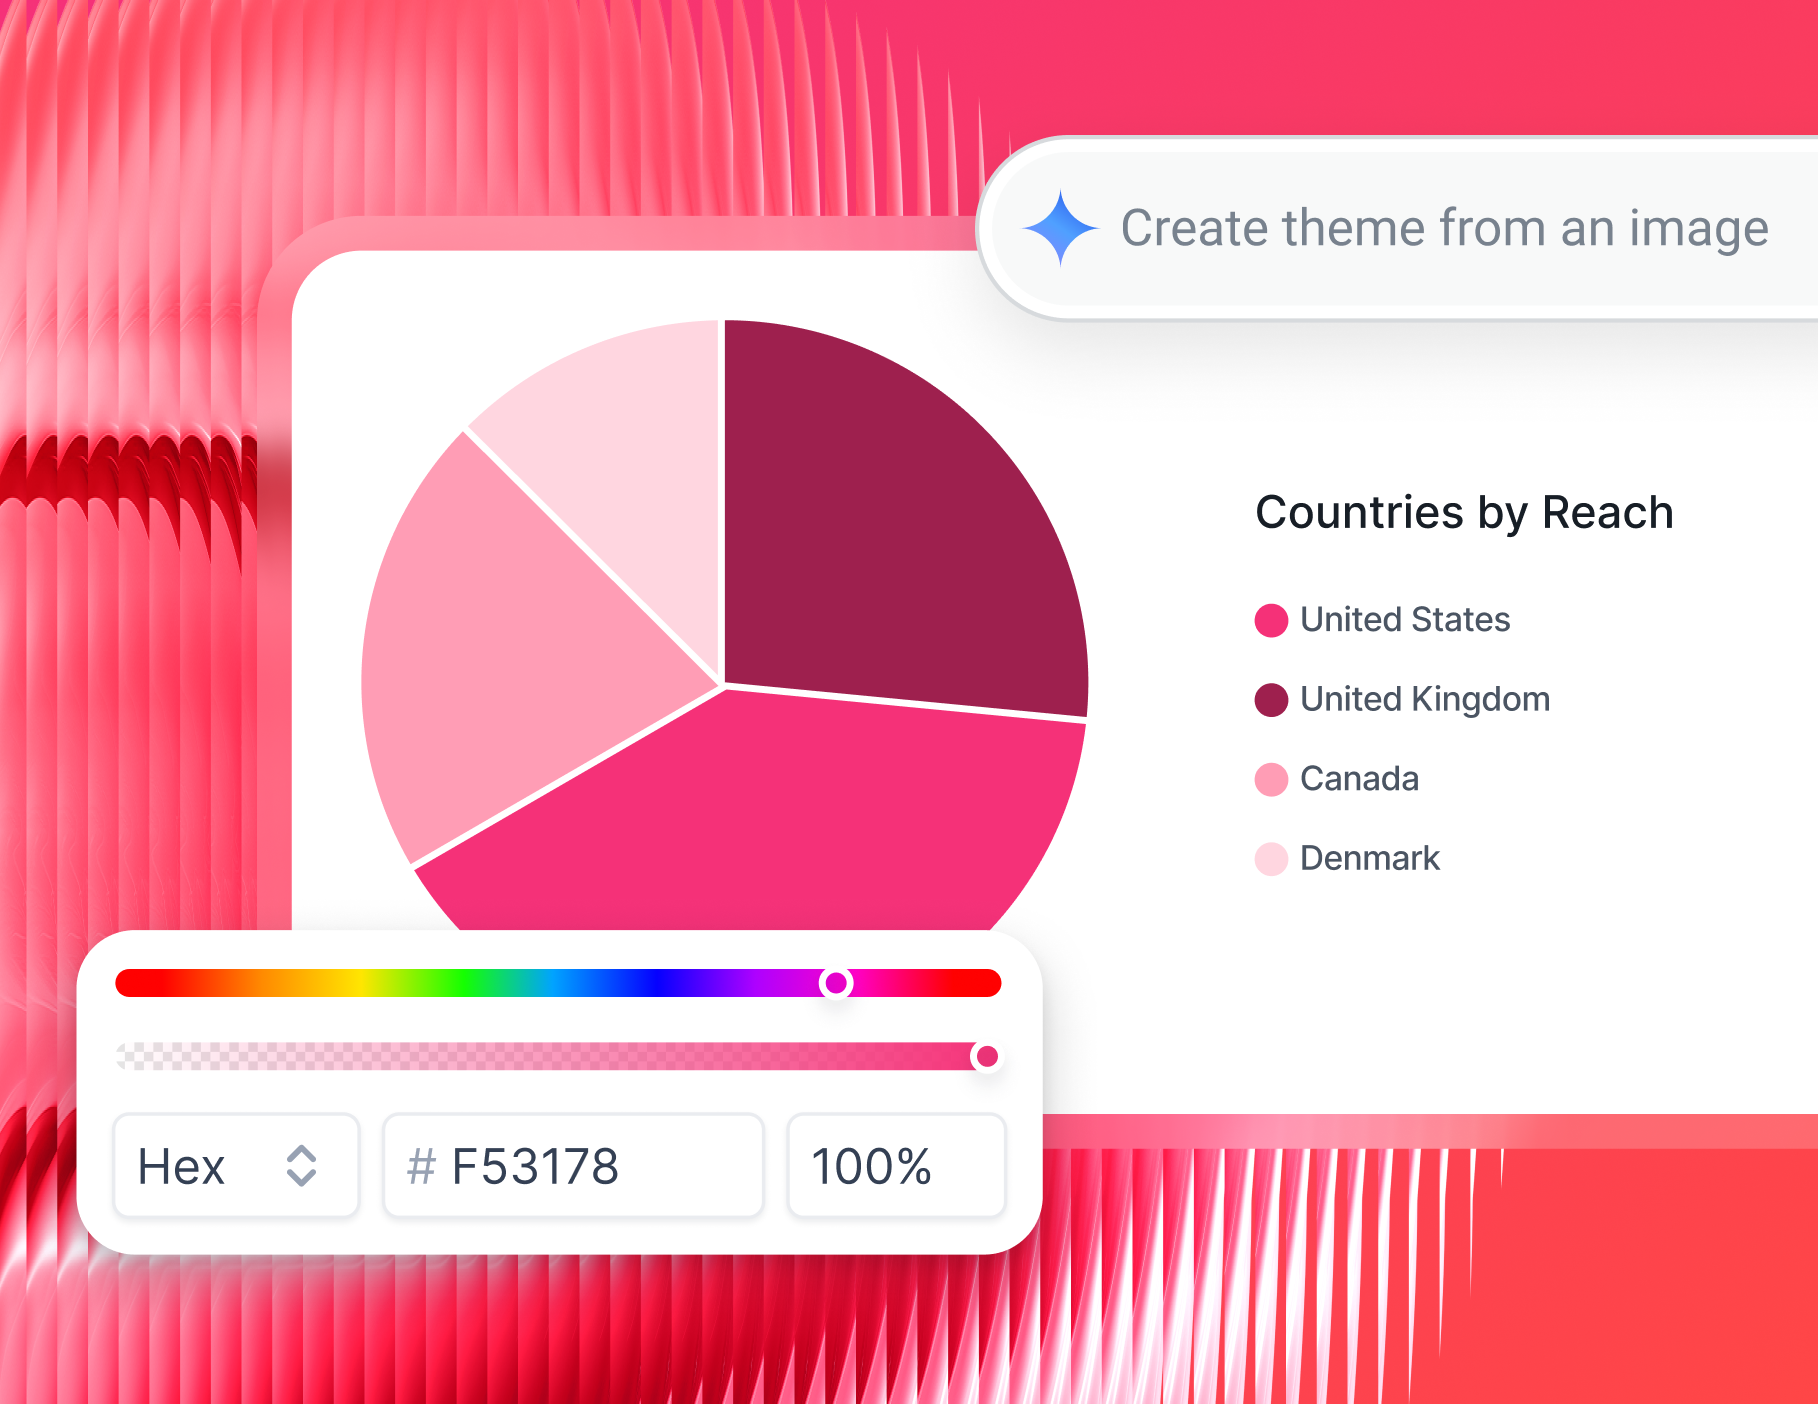
✅ Brand reports instantly: Upload a client logo or paste in a brand kit, and IQ Themes applies their colors, fonts, and style automatically.
✅ Write performance summaries without starting from scratch: IQ reads the data in your report and writes a clear, plain-language summary you can edit or send as-is. No hallucinations - it works from your actual data.
✅ Answer client questions on the spot: Ask IQ Chat things like "Which Snapchat campaign had the lowest CPA this month?" and get an immediate answer - no pivot tables, no digging through Ads Manager.
Lars Maat, the Co-Founder at Maatwerk Online, is one of the happy customers using Whatagraph IQ:
Whatagraph’s AI saves time and energy for marketing specialists. If they need to build reports themselves, it costs them negative energy. But if they can automate or speed it up with AI, it really gives them an energy boost—like ‘Hey this is working really nice. This is easy. This is going fast.'
Start free with Whatagraph today.
2. Looker Studio - Best for agencies already deep in the Google ecosystem
Looker Studio is Google's free dashboarding tool and a popular choice for agencies that run primarily Google-based campaigns. It connects natively and reliably to Google Ads, GA4, and Google Search Console, and its large library of templates makes it relatively quick to spin up a basic report.
Key features:
- Free to use with Google's native data sources
- Large selection of pre-built report templates
- Wide range of charts and visualization types
- Shareable via link or embedded on a site
Bottom line: Looker Studio works well if Snapchat is a secondary channel and Google data is your main focus. For agencies that use Snapchat Ads alongside multiple other platforms, third-party connector dependency and maintenance overhead add up fast.
3. AgencyAnalytics - Best for SEO-focused agencies adding paid social reporting
AgencyAnalytics is a client reporting tool built specifically for marketing agencies, with a clean interface and a strong set of SEO auditing features. It connects to 80+ data sources and makes white-labeled reporting relatively straightforward.
Key features:
- White-label reporting with custom branding
- 80+ integrations, including Snapchat Ads
- Built-in SEO audit and rank tracking tools
- Live client dashboards
AgencyAnalytics can be a solid option if SEO is your core service and Snapchat Ads reporting is a smaller, supplementary need. For paid-media-first agencies, the data blending limitations are likely to be a sticking point.
How do I automate Snapchat Ads reporting for clients?
Automating Snapchat Ads reporting doesn't have to mean wrestling with connectors, scheduling manual exports, or rebuilding the same report every month from scratch.
With Whatagraph, you go from raw Snapchat Ads data to a delivered, branded client report without any of that. Here's a simple tutorial of how it works:
1. Connect your Snapchat Ads account
Start by connecting Snapchat Ads directly inside Whatagraph. Find it in the data sources menu, authenticate with your login, and your campaign data starts flowing in automatically.
No third-party connectors, no API setup, no developer required. The integration is native, stable, and always matches what you see inside Snapchat Ads Manager.
You can also bring in data from your other paid channels at the same time:
- Social Media: Meta Ads, TikTok Ads, Google Ads, LinkedIn Ads
- Analytics: Google Analytics 4, Matomo
- E-commerce: Shopify, BigCommerce, WooCommerce
- SEO: Semrush, Ahrefs, SE Ranking
- Email: Mailchimp, Klaviyo, ActiveCampaign
Everything connects the same way - a few clicks, and you're done.
2. Organize and clean your data
Once your Snapchat Ads data is connected, get it into a shape that actually makes sense for client reporting.
With Whatagraph, you can:
- Standardize metric and campaign names across platforms so nothing looks mismatched
- Blend Snapchat Ads data with other paid channels into a single, unified view
- Filter by campaign, ad set, placement, or demographic
- Apply tags and folders to organize by client, account manager, or region
Need a custom metric - like total paid social spend combining Snapchat, Meta, and TikTok?
Just ask IQ Dimensions to build it. Describe what you need in plain language, and it creates the blend for you, no formulas or coding involved.
3. Build your Snapchat Ads report
This is where most of the manual time usually goes. With Whatagraph IQ, it doesn't have to.
1. Describe the Snapchat Ads report you want - the metrics, the layout, the structure - and IQ builds the whole thing in seconds. Charts, KPIs, tabs, and all. No drag-and-drop required unless you want it.
2. Brand your report in seconds. Upload your client's logo or a brand kit image, and IQ Themes applies their colors, fonts, and style automatically across the whole report.
3. Explain results in plain English. IQ Summaries reads the data directly from your report and writes a clear performance narrative you can drop in as-is or edit before sending.
Want full manual control?
Use the drag-and-drop builder to customize every widget - labels, sizes, date ranges, currencies, color schemes, and more.
Save it as a linked template, and any edits you make to the master report sync across every client report connected to it instantly.
4. Build an internal Snapchat Ads dashboard
Client reports are one thing. Your internal view is another.
Use Whatagraph's Overviews to monitor Snapchat Ads performance across all your client accounts from one place.
You can track KPIs in real time, flag accounts that are trending off-target, and set up goal widgets so you know at a glance which campaigns are pacing toward targets and which need attention.
Slice your overview by client, account manager, campaign type, or region. It gives your team the context they need to act fast, without having to dig through individual reports.
5. Add AI-written summaries and insights
Raw Snapchat Ads data doesn't tell the story on its own - and clients shouldn't have to interpret it themselves.
IQ Summaries reads the data directly from your report and writes a clear, plain-language performance narrative you can drop in as-is or tweak before sending.
No hallucinations, no generic copy - the summary is written from your actual campaign numbers.
"Reporting with human input is 1000x more valuable than an auto-scheduled report. Context and action plans matter more than the numbers, and most clients don't open or understand reports without that context," says Martin Sandgaard, Co-Founder of AdsToGo.
IQ Summaries give you that human context layer - fast. And if a client asks a follow-up question, IQ Chat can answer it instantly from the data in the report, without you having to dig back into Ads Manager.
6. Automate delivery and sharing
Once your Snapchat Ads report is ready, set it and forget it.
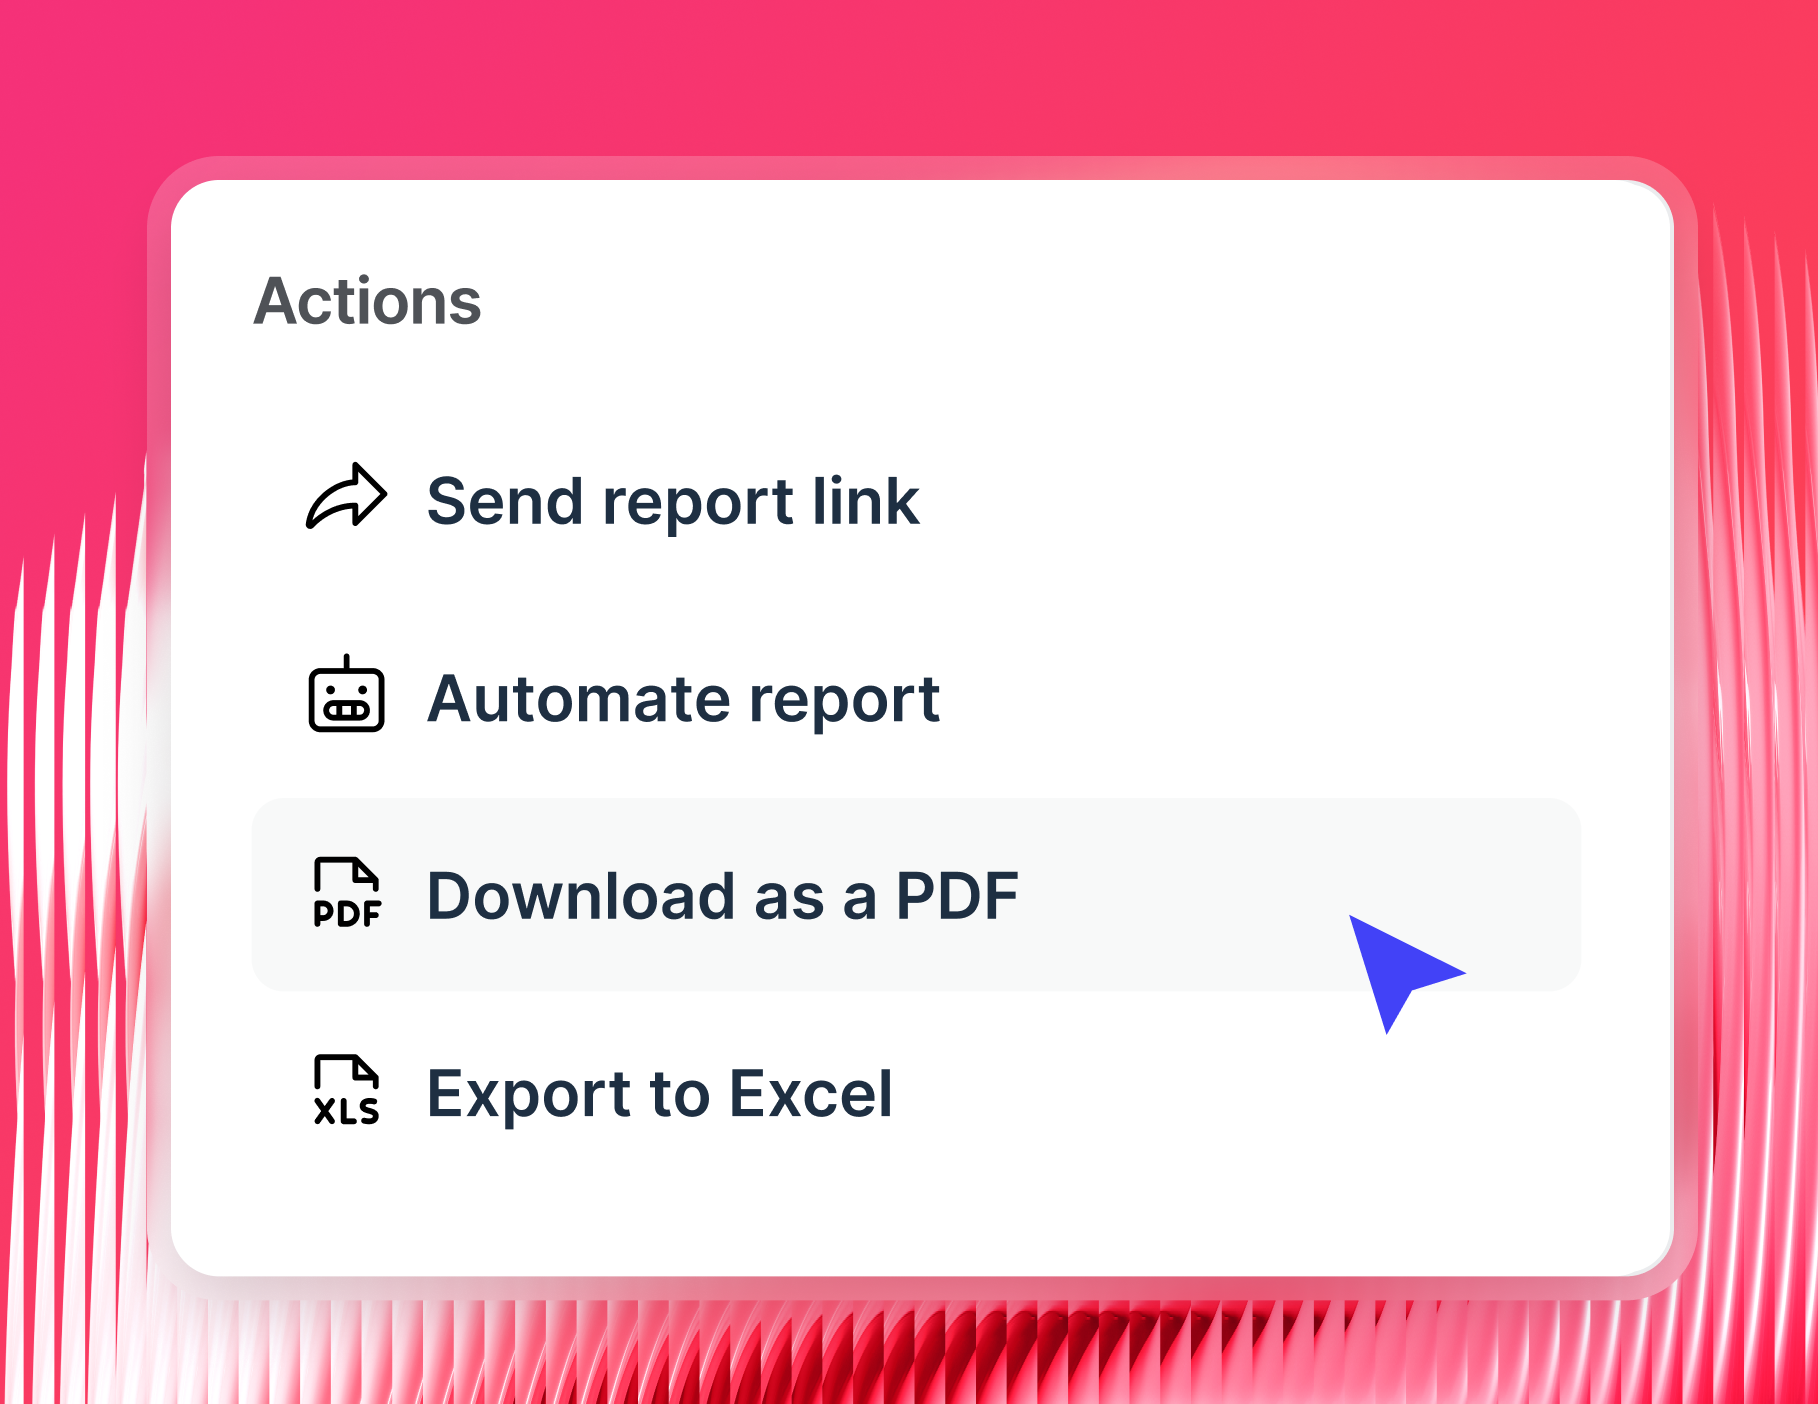
- Automated emails: Schedule recurring delivery by email or Slack - pick the exact date, time, and cadence for each client
- Live links: Share a link clients can open anytime - data refreshes automatically, no login needed
- PDF or CSV exports: Download a static version for archives, presentations, or offline use
- BigQuery and Looker Studio: Send raw data to BigQuery for storage or pipe it directly into Looker Studio if that's part of your workflow
Which Snapchat Ads metrics should I include in a client report?
Knowing which Snapchat Ads KPIs to include comes down to one question: what does this client actually care about? Getting that right means picking the right metrics and actually explaining what they mean.
As Chris Coussons, Founder of Visionary Marketing, puts it:
The biggest mistake agencies make is throwing too much data at clients without explaining what it means. A huge report full of metrics might look impressive, but if the client doesn't understand it, it's useless.
Here are the core Snapchat App KPIs to cover in a client report, broken down by category.
1. Spend and goal tracking
Before anything else, clients want to know how their budget is being used and whether they're on track to hit their targets. Start every Snapchat Ads report with these:
- Total ad spend: How much has been spent in the reporting period - essential context for every other metric
- Goal pacing widget: Shows how spend and key conversions are tracking against the campaign goal and timeline
- Conversion purchases: The number of purchases attributed to Snapchat Ads - your top-line result metric
A spend vs. conversion purchases chart over time is one of the most useful visuals you can include.
Before diving into the numbers, consider adding a short "Key Insights" section at the top of the report. Peter Murphy Lewis, CEO at Strategic Pete, recommends it for every client-facing report:
I start every report with a 'Key Insights' section - this is the CEO's two-minute takeaway. We include a short, data-backed summary of what's working, what's not, and what's next.
2. Conversion metrics
This is the core of any performance-focused Snapchat Ads report. These Snapchat Ads KPIs tell clients whether their campaigns are actually driving business outcomes:
- Conversion funnel: Impressions → conversion ad clicks → conversion purchases, with total conversion rate - gives a full-funnel view of where users are dropping off
- Conversion purchases from app vs. web: Shows which environment is driving results, useful for optimizing creative and targeting by placement
- Conversion page views: How many times a Snapchatter viewed a page in the client's app or website after seeing an ad
- Conversion subscribes: Tracks users who subscribed after engaging with an ad - important for subscription-based businesses
- Conversion app opens: The number of times a user opened the app after an ad interaction
- Conversion searches: Completed search actions attributed to Snapchat Ads
- Conversion sign-ups: New account or form registrations driven by campaigns
- Conversion add billing: Users who added billing information - a strong lower-funnel signal for ecommerce
When clients push back on reporting, it's usually because they can't see a direct line between ad spend and business results.
"Clients care about one thing: growth," notes Thomas Hassett, Founder of THResults. "Revenue, ROI, and progress toward their end goals matter most. Clicks and impressions? Sure, they're nice, but without the bottom line metrics, they're just noise."
3. Impression and engagement metrics
Once you've covered conversions, give clients context on how their ads are performing in terms of visibility and creative engagement:
- Impressions: Total number of times the ad was displayed - gives scale to your conversion numbers
- Conversion ad views: How many times the ad creative was actually watched - particularly relevant for video campaigns
- Conversion ad clicks: Clicks attributed to a conversion event, as distinct from general swipe-ups
- Shares vs saves: The ratio of shares to saves gives a useful read on how compelling the creative is - high saves signal content worth returning to, high shares signal virality
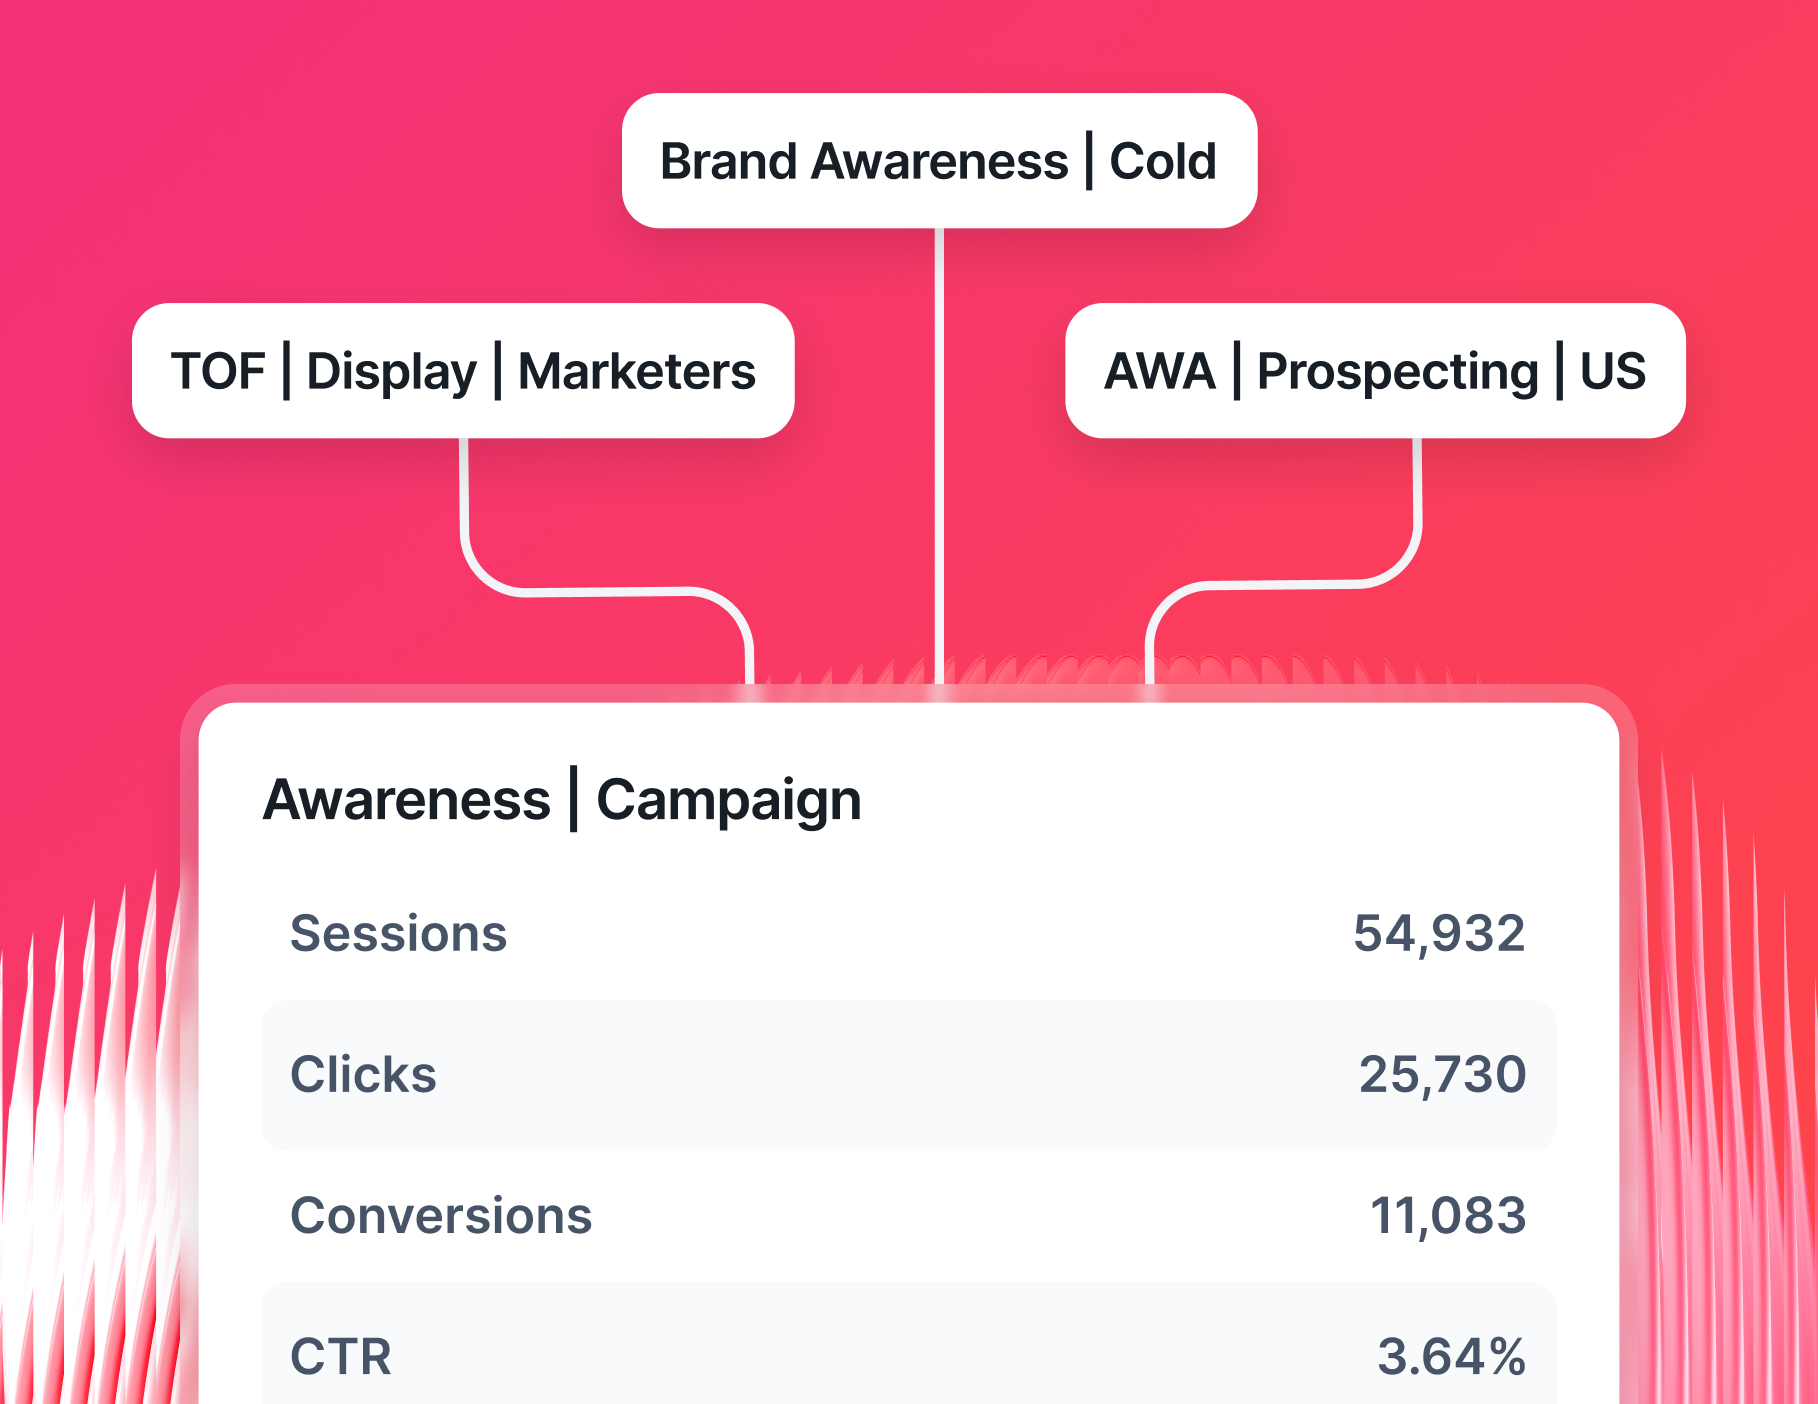
4. Campaign-level breakdown
Reporting at the campaign level helps clients understand which parts of their Snapchat Ads strategy are working and where the budget should be reallocated:
- Campaign performance table: Breaks down conversion add to cart, conversion start checkout, and conversion purchases by campaign name - makes it easy to spot top performers and underperformers at a glance
- Conversion ad views and clicks by campaign: Shows which campaigns are generating genuine ad engagement vs. passive impressions
5. Audience and app engagement metrics
For clients running app campaigns or building a Snapchat presence beyond direct-response, these metrics round out the picture:
- App opens: Total app opens attributed to Snapchat Ads - key for mobile app advertisers tracking user acquisition
- Page views: Website or in-app page views driven by ad interactions
- Subscribes: In-app subscription actions - important for content and media brands
- Searches: Search actions completed after an ad interaction - signals high intent