
What To Include in an On-site SEO Report Template
An on-site SEO report template helps you track how users interact with your website so you can improve search engine optimization, user engagement, and conversions. These dashboards bring together Google Analytics, Google Search Console, and additional data sources to evaluate your SEO performance and align results with your overall SEO strategy.
1. Summary
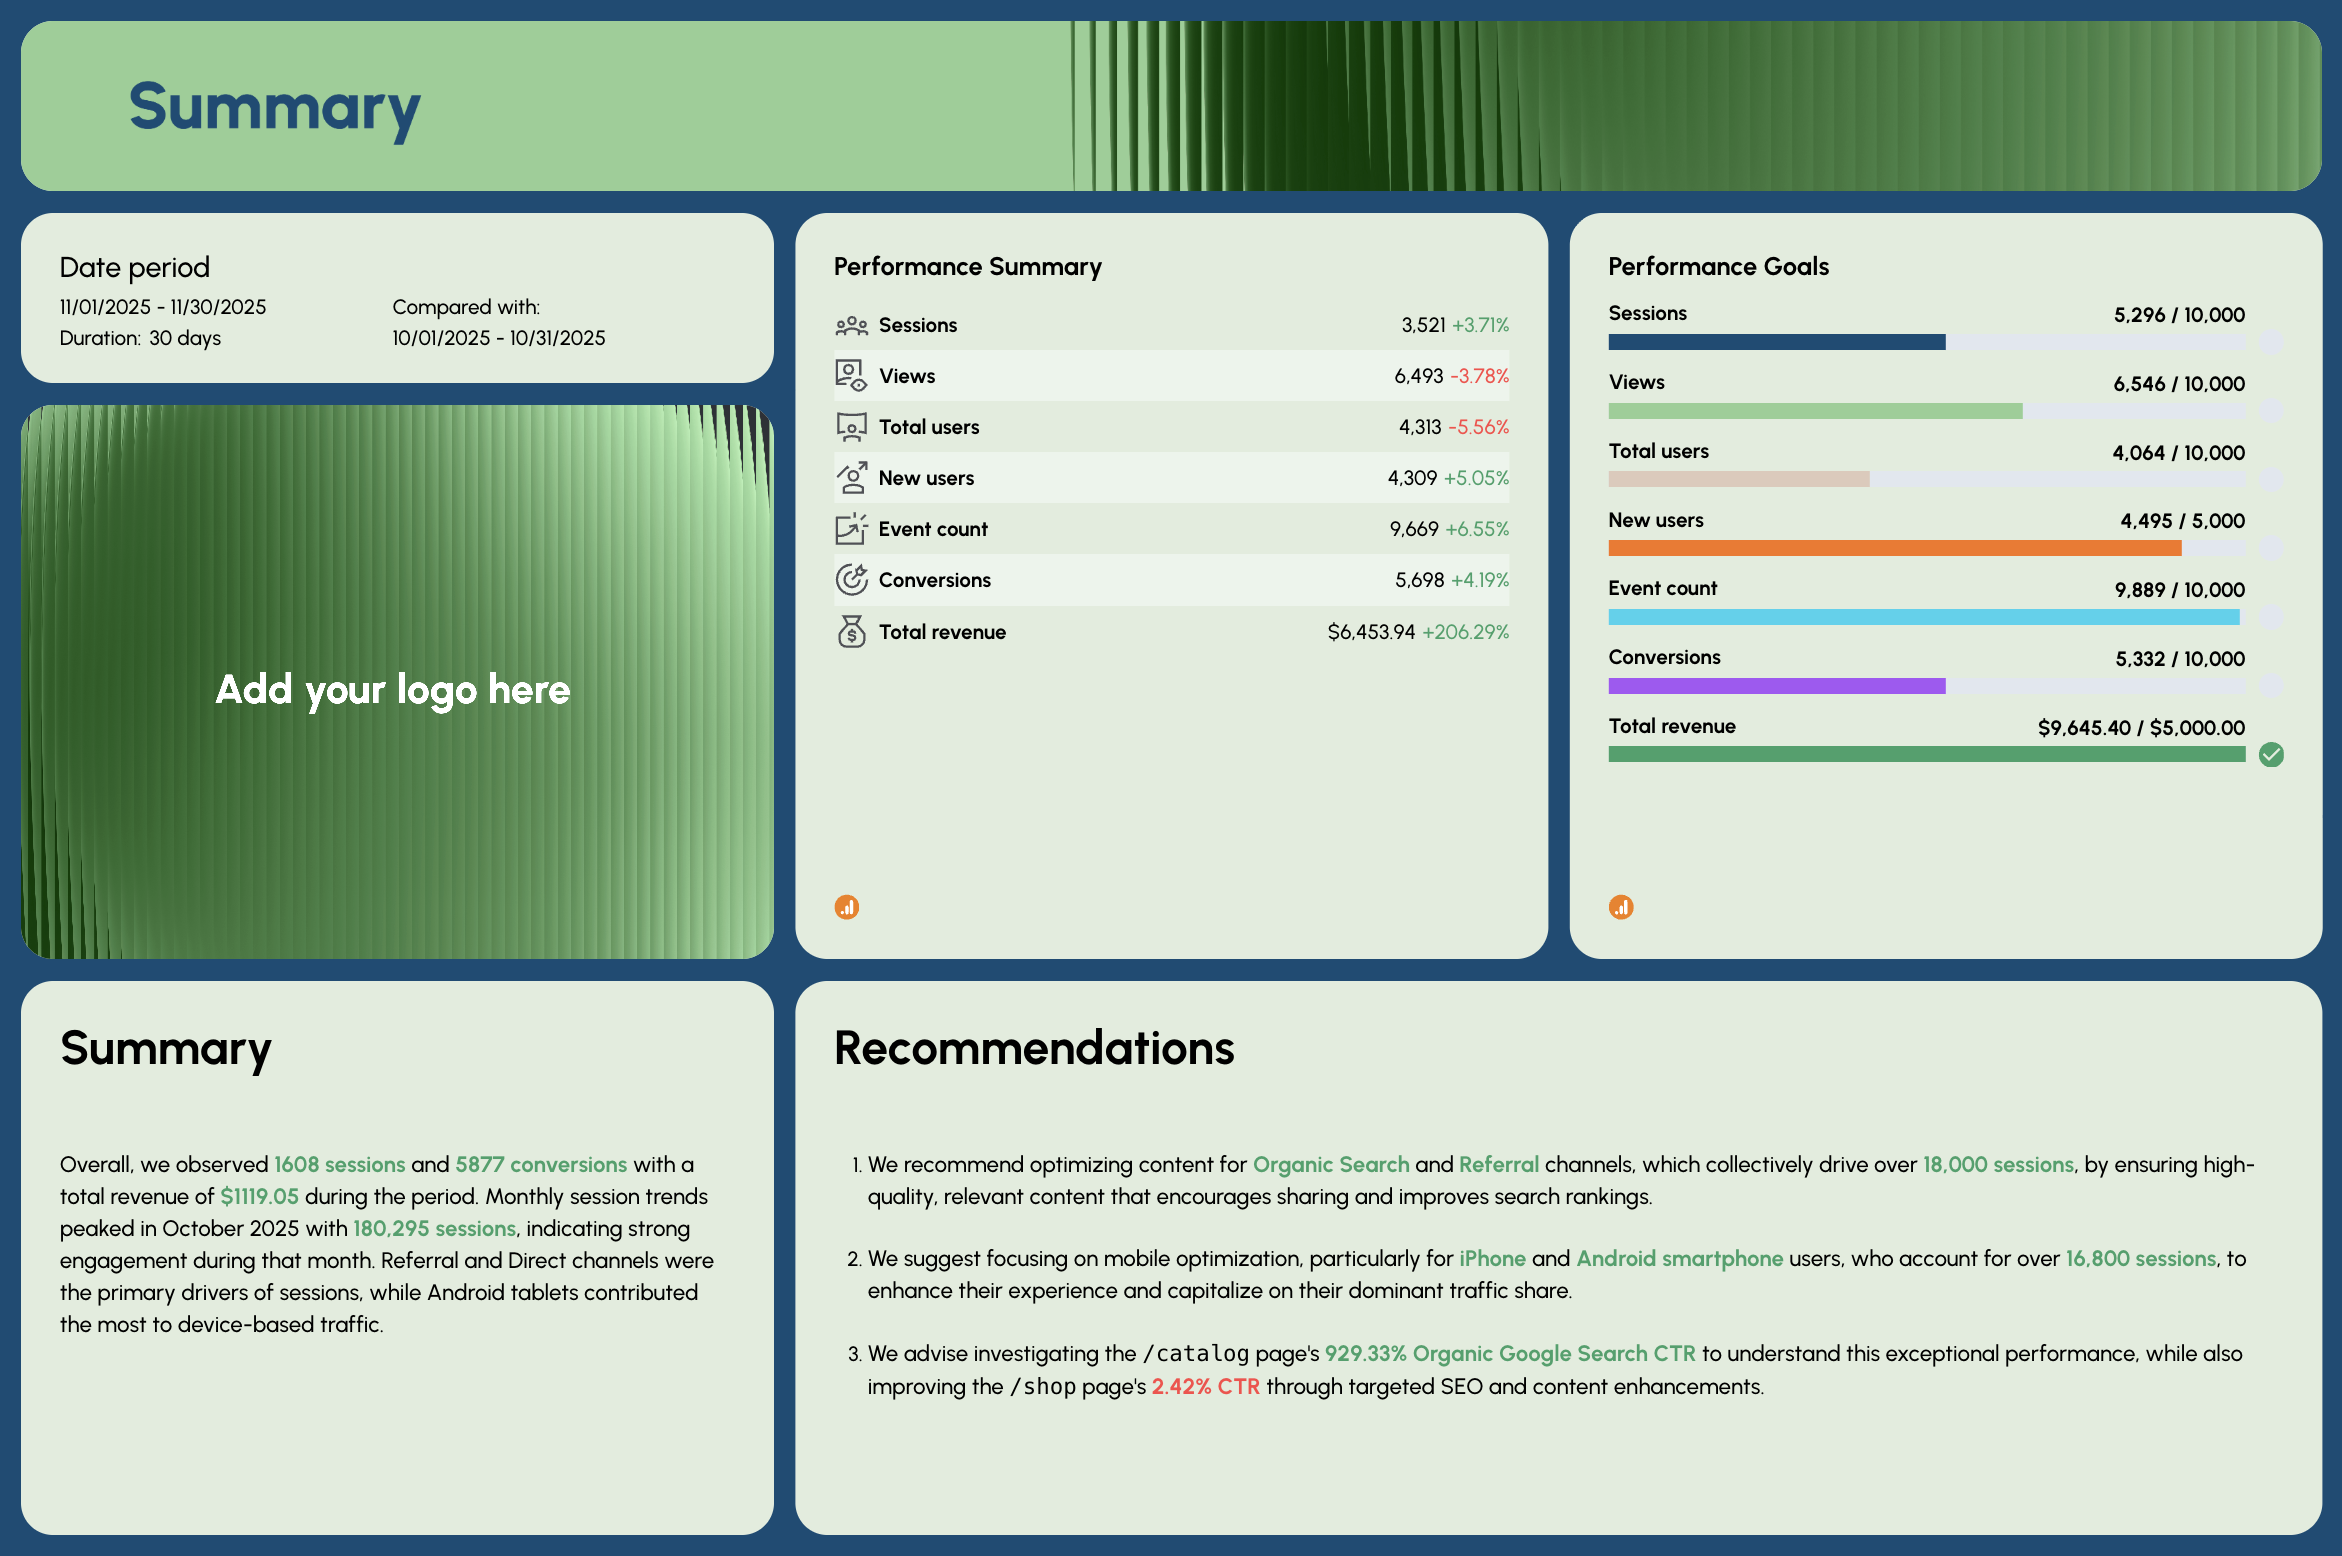 This section gives stakeholders a quick look at your overall website performance, including revenue, sessions, organic traffic, and user growth trends. It uses widgets and graphs to visualize progress toward key business goals.
What to include:
- Sessions, views, and total users
- New users
- Conversion rate and total revenue
- High-level recommendations
- Goals vs. actuals
Why it matters
- Shows whether your current SEO campaigns are working
- Helps marketing teams make informed decisions
- Communicates website health at a glance for client reporting
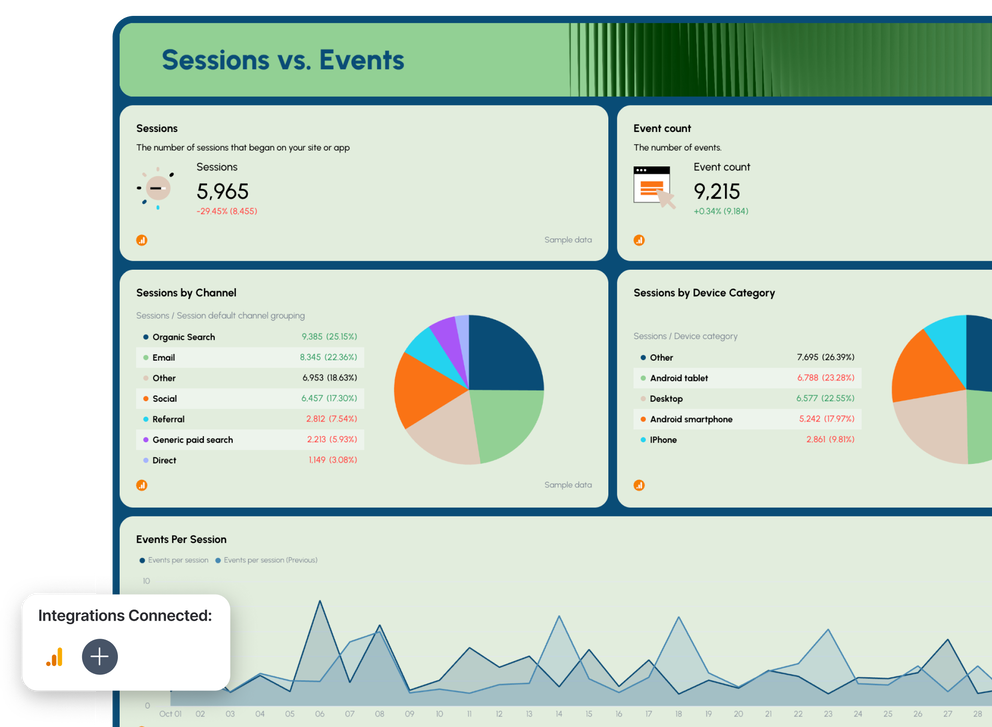
2. Sessions vs. Events
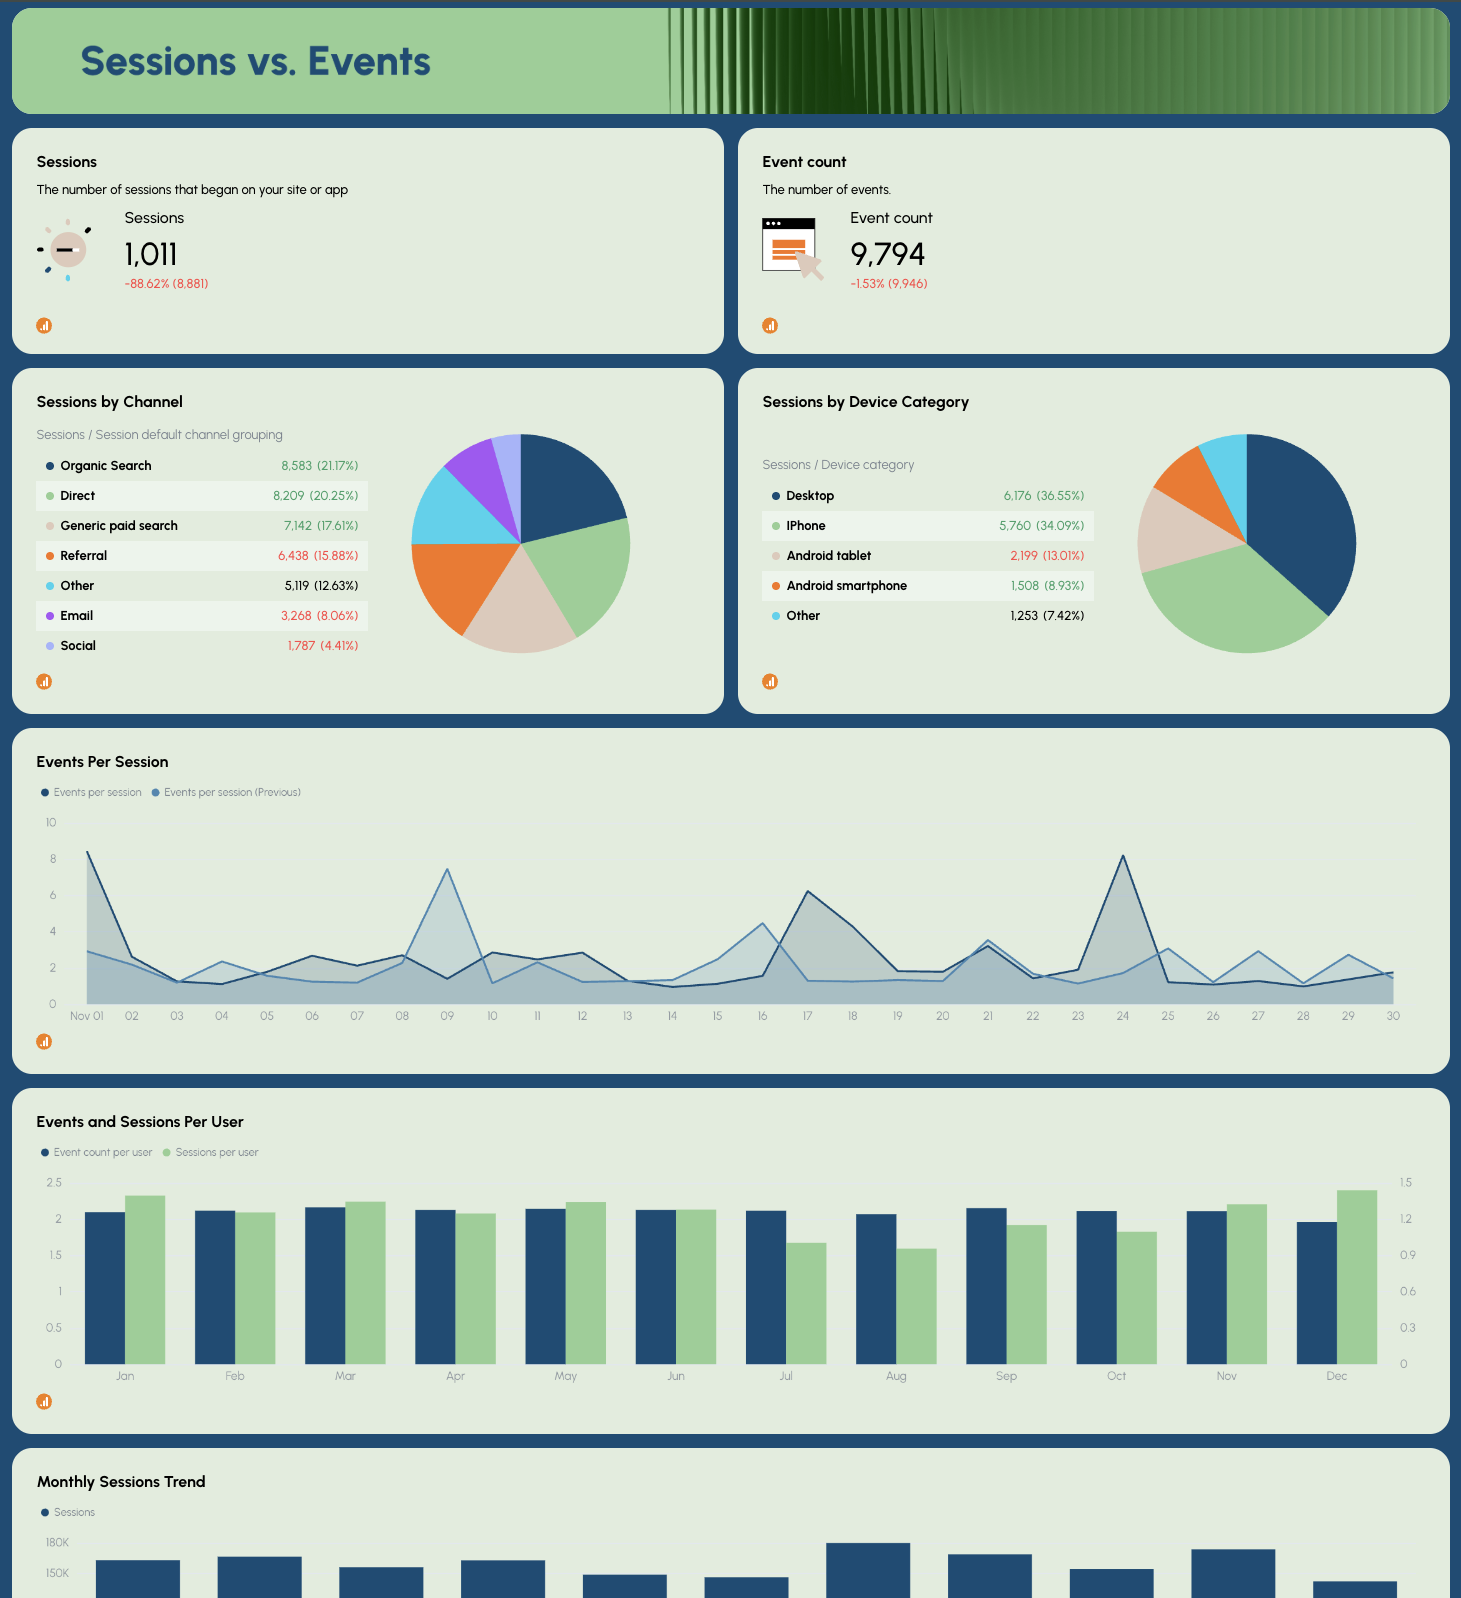
This view compares how many sessions occur vs. how many events users trigger, giving insight into onsite engagement.
What to include:
- Sessions by channel
- Sessions by device category
- Events per session over time
- Trend lines for seasonality patterns
Why it matters
- Helps diagnose bounce rate issues
- Shows which sources perform best in SERP, referral, or social media traffic
- Improves optimization efforts by focusing on high-value channels
3. Total Users vs. New Users
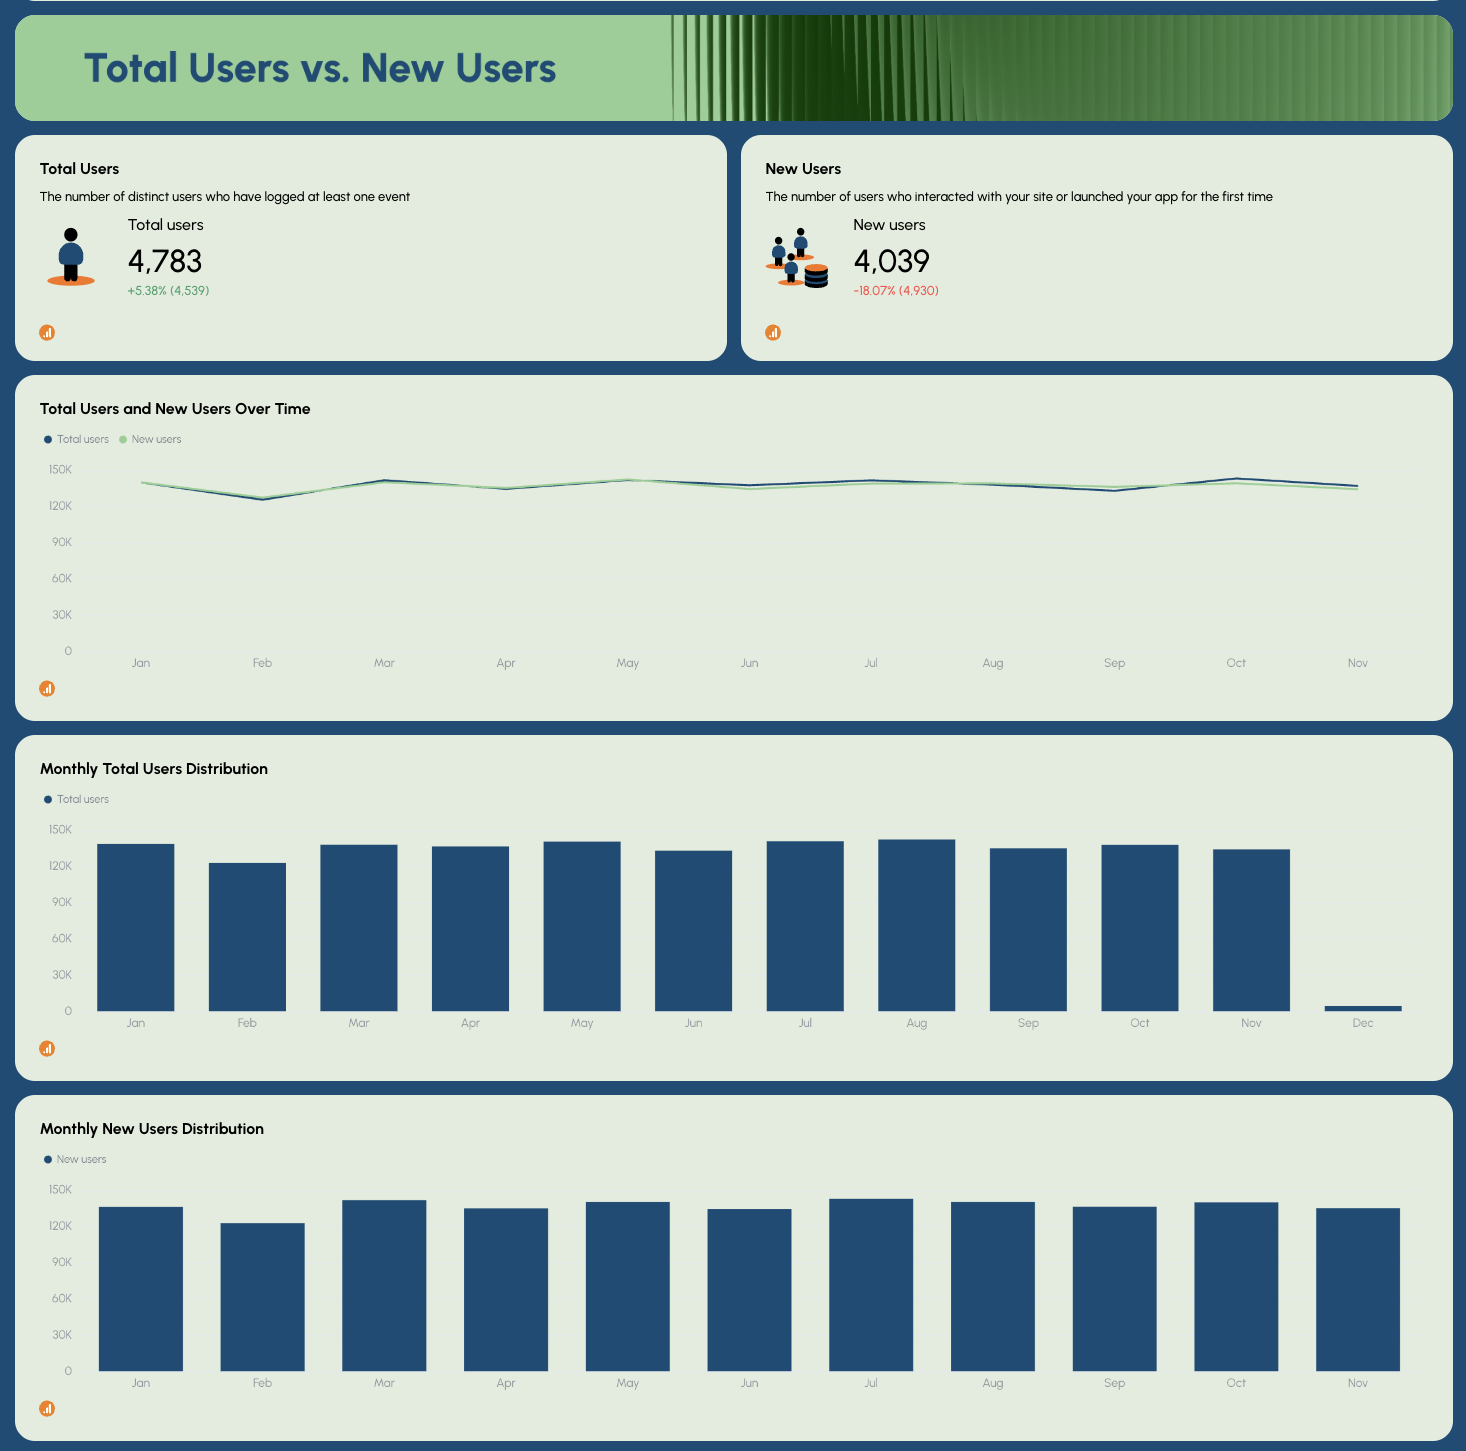
This chart helps measure growth from organic search, direct visits, or referrals.
What to include:
- Total users trend
- New users trend
- Traffic distribution by source
Why it matters:
- Highlights audience growth from local SEO, ecommerce, or brand marketing
- Reveals which channels bring in new potential customers
- Helps monitor keyword performance and demand
4. Page Performance
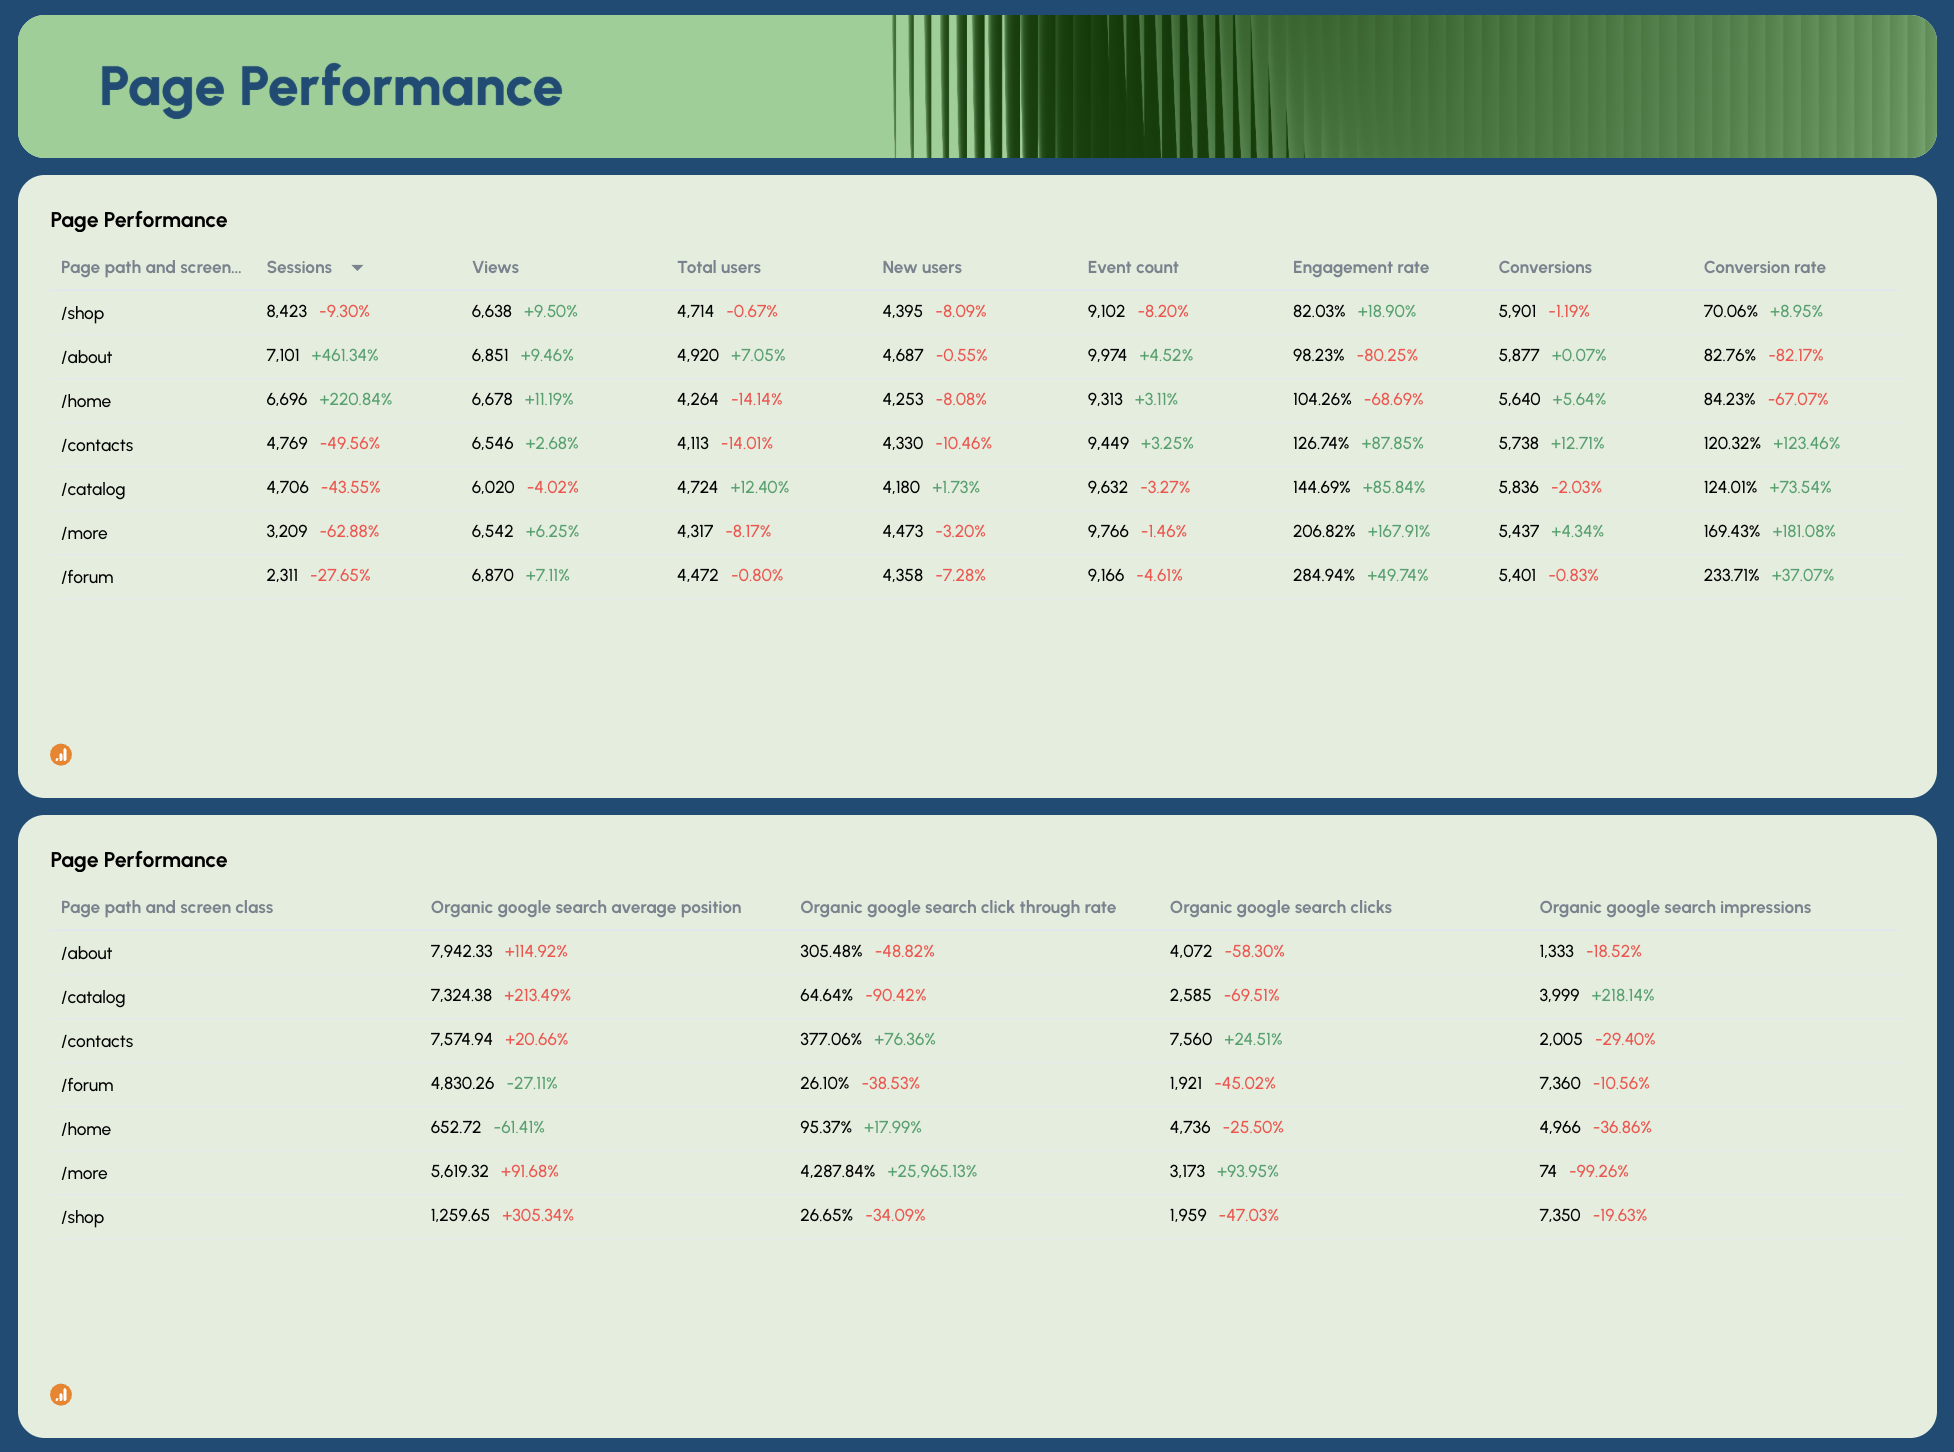
This part digs into your top landing pages, pulling CTR, impressions, clicks, and average position from GSC + engagement from GA4.
What to include:
- Page path performance
- Keyword rankings tied to pages
- Click-through rate and impressions
- On-page SEO metrics like user behavior and conversions
- Referring domains data from Ahrefs or Semrush
Why it matters:
- Pinpoints pages that need technical SEO fixes
- Supports optimization of high-impact content
- Shows whether your current SEO tools and content strategy deliver ROI
5. On-site Activity
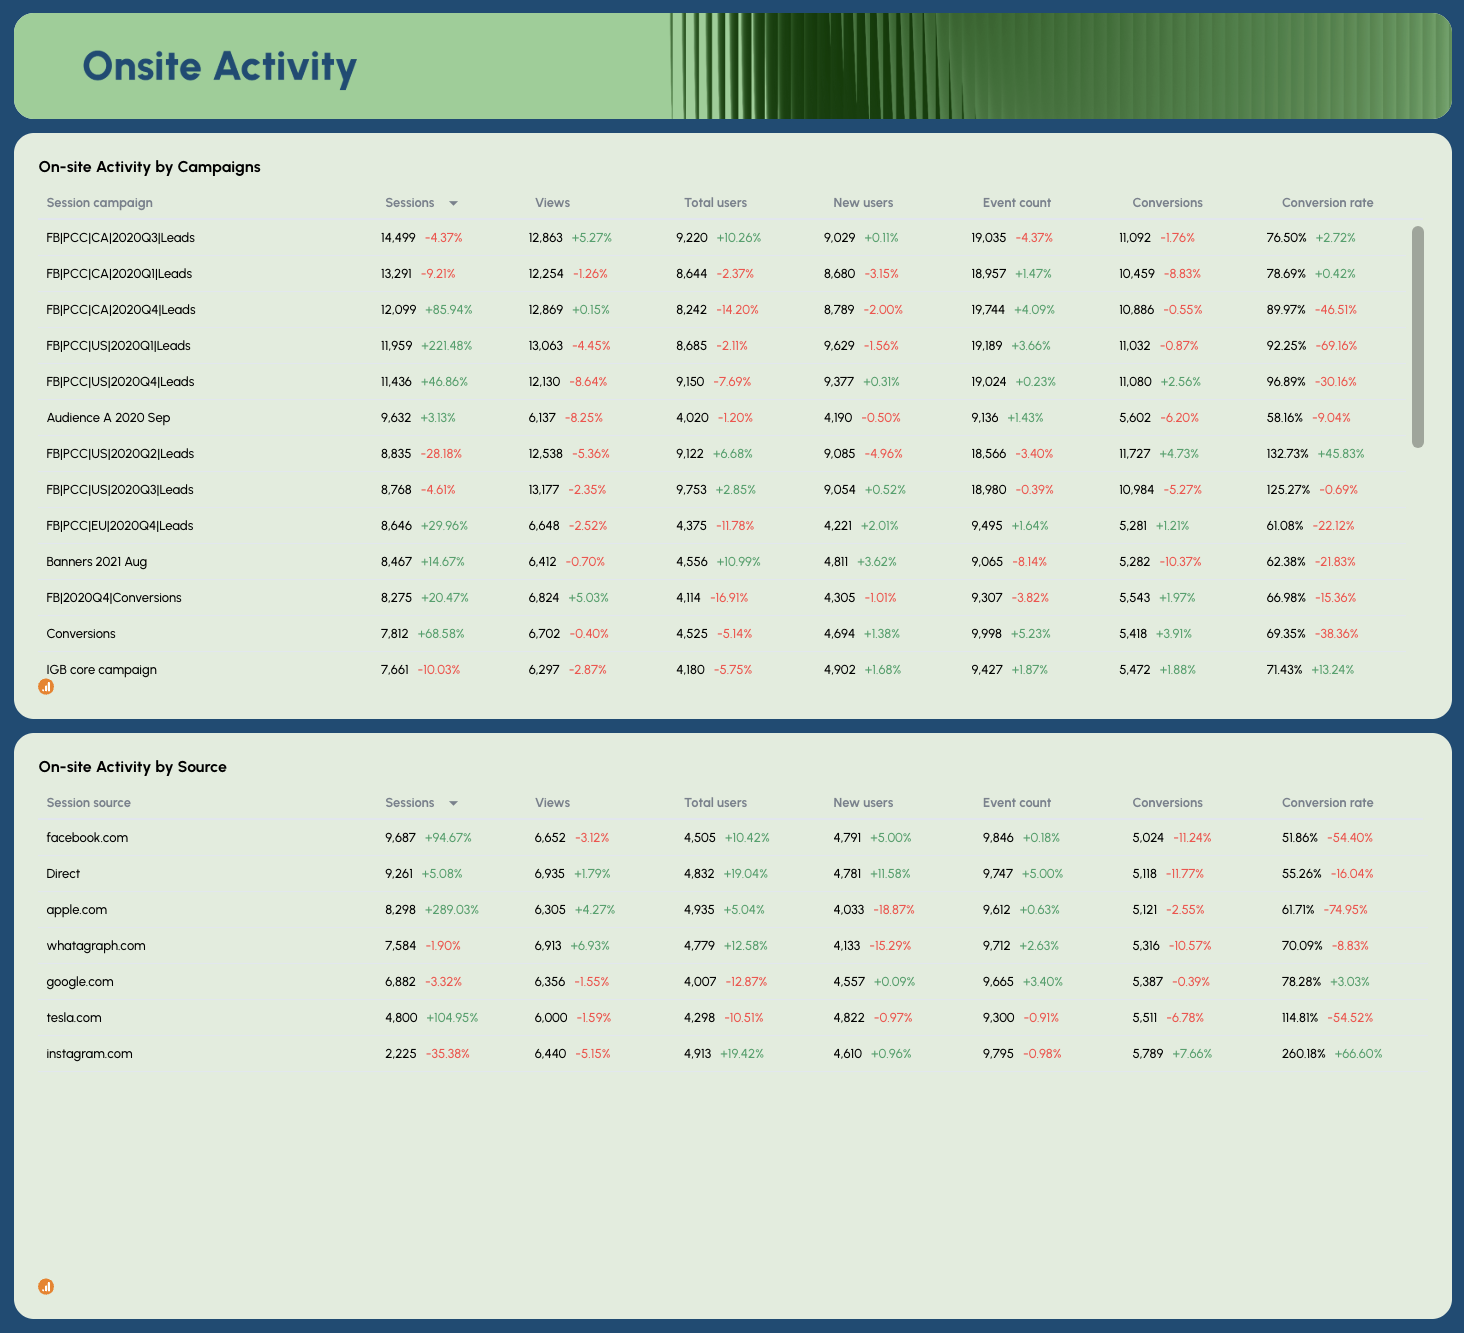
This table shows how visitors behave once they land on your site, based on campaigns and traffic sources.
What to include:
- Sessions, views, conversions by campaign
- Performance by search engines vs. referral traffic
- Backlink profile impact on behavior
Why it matters:
- Shows which campaigns drive bottom-line results
- Helps improve SEO results and reduce wasted spend
- Reveals gaps in client reporting and performance tracking
6. Geography vs. Device
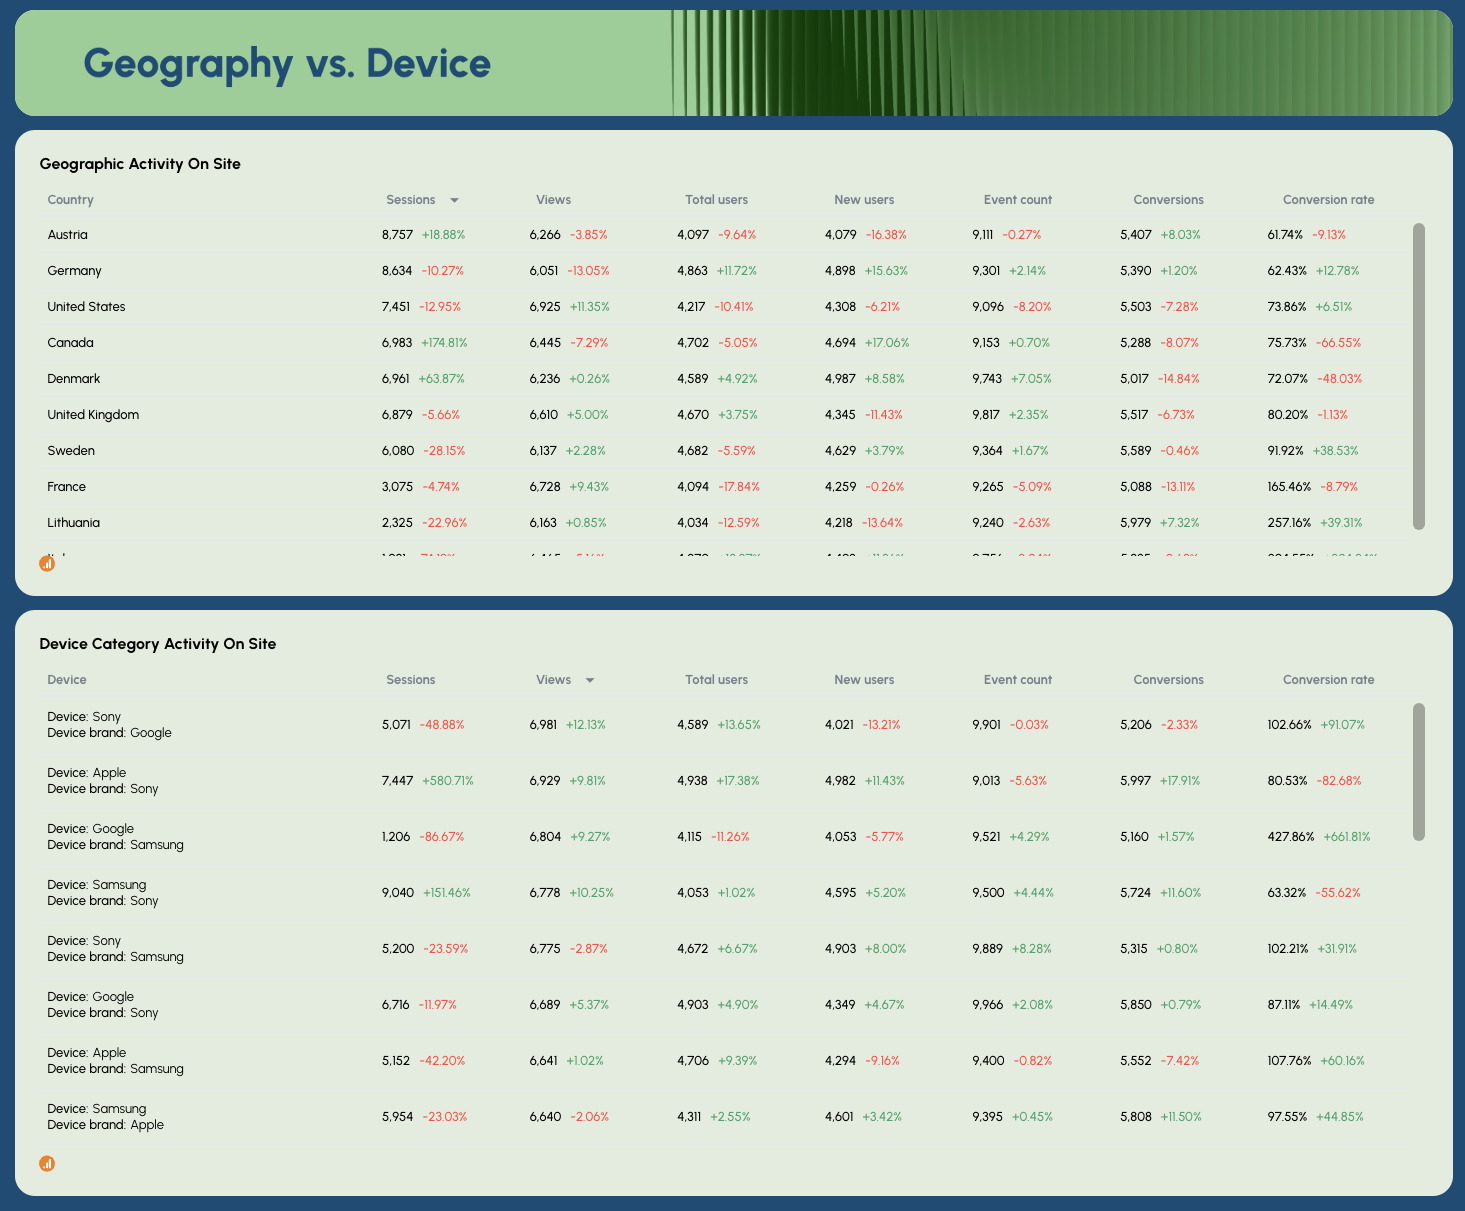
This final section compares where users come from and which devices bring the most value.
What to include:
- Country-based website traffic
- Device category breakdown (desktop vs. mobile vs. tablet)
- Engagement and conversion rate by audience segment
Why it matters:
- Improves mobile and regional optimization
- Informs expansion into strong-performing local markets
- Supports search visibility growth strategy


