Free YouTube Report Template

Skip the spreadsheets and clunky YouTube dashboards.

Connect your YouTube account automatically, visualize key metrics, and get actionable insights in seconds with this YouTube report template.

YouTube Report Template - Dashboard showing views, watch time and subscriber metrics with charts and graphs.

How to Use Whatagraph’s YouTube Report Template

Create Custom YouTube Reports in Seconds

With Whatagraph IQ, just tell us what you need, and we'll build a stunning YouTube report for you. No templates or manual setup needed.

What To Include in a YouTube Analytics Report Template?

A complete YouTube analytics report template organizes your channel’s most important results into clear, structured sections — from performance summaries to audience insights.

Below are the key sections every YouTube performance report should include:

1. Performance Summary
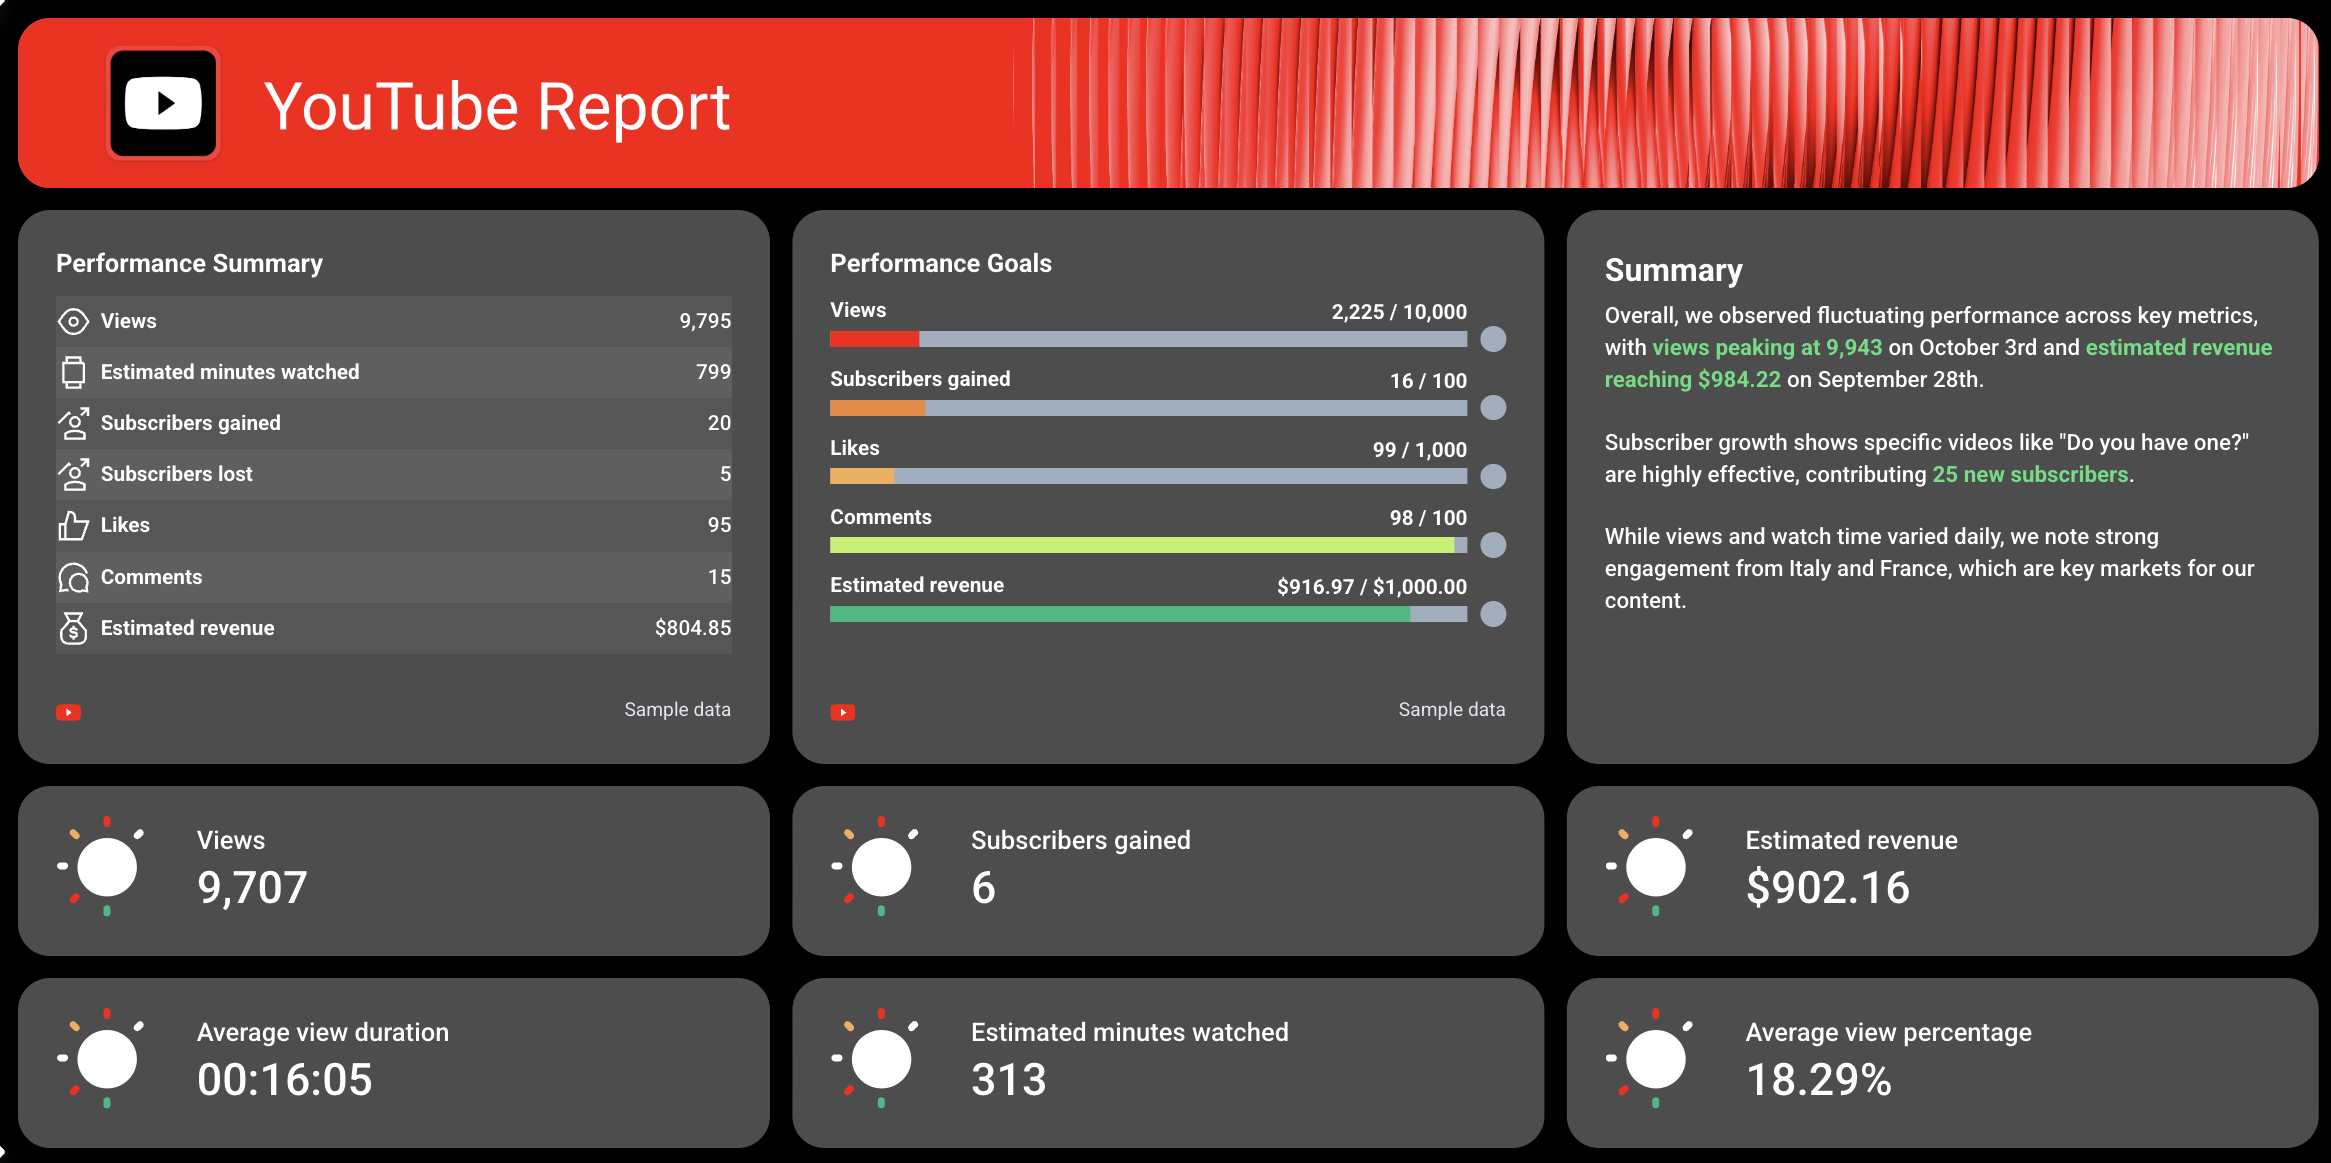
Youtube Report Template - A dashboard report with performance metrics and summaries.

Every great YouTube dashboard starts with a Performance Summary that outlines your most important KPIs.

Include:

  • A performance summary list with total views, estimated minutes watched, likes, comments, subscribers gained or lost, and estimated revenue.
  • A goal widget that visually shows how close you are to reaching your YouTube channel targets, like total subscribers, views, or earnings.
  • A written summary section powered by Whatagraph IQ, so you never have to write summaries manually. IQ automatically analyzes your YouTube data and generates insights like “top-performing videos,” “subscriber trends,” or “content improvement opportunities.”

You can also highlight key metrics such as total watch time, average view duration, and engagement rate to assess how well your video content performs over time.

2. Views & Revenue Breakdown
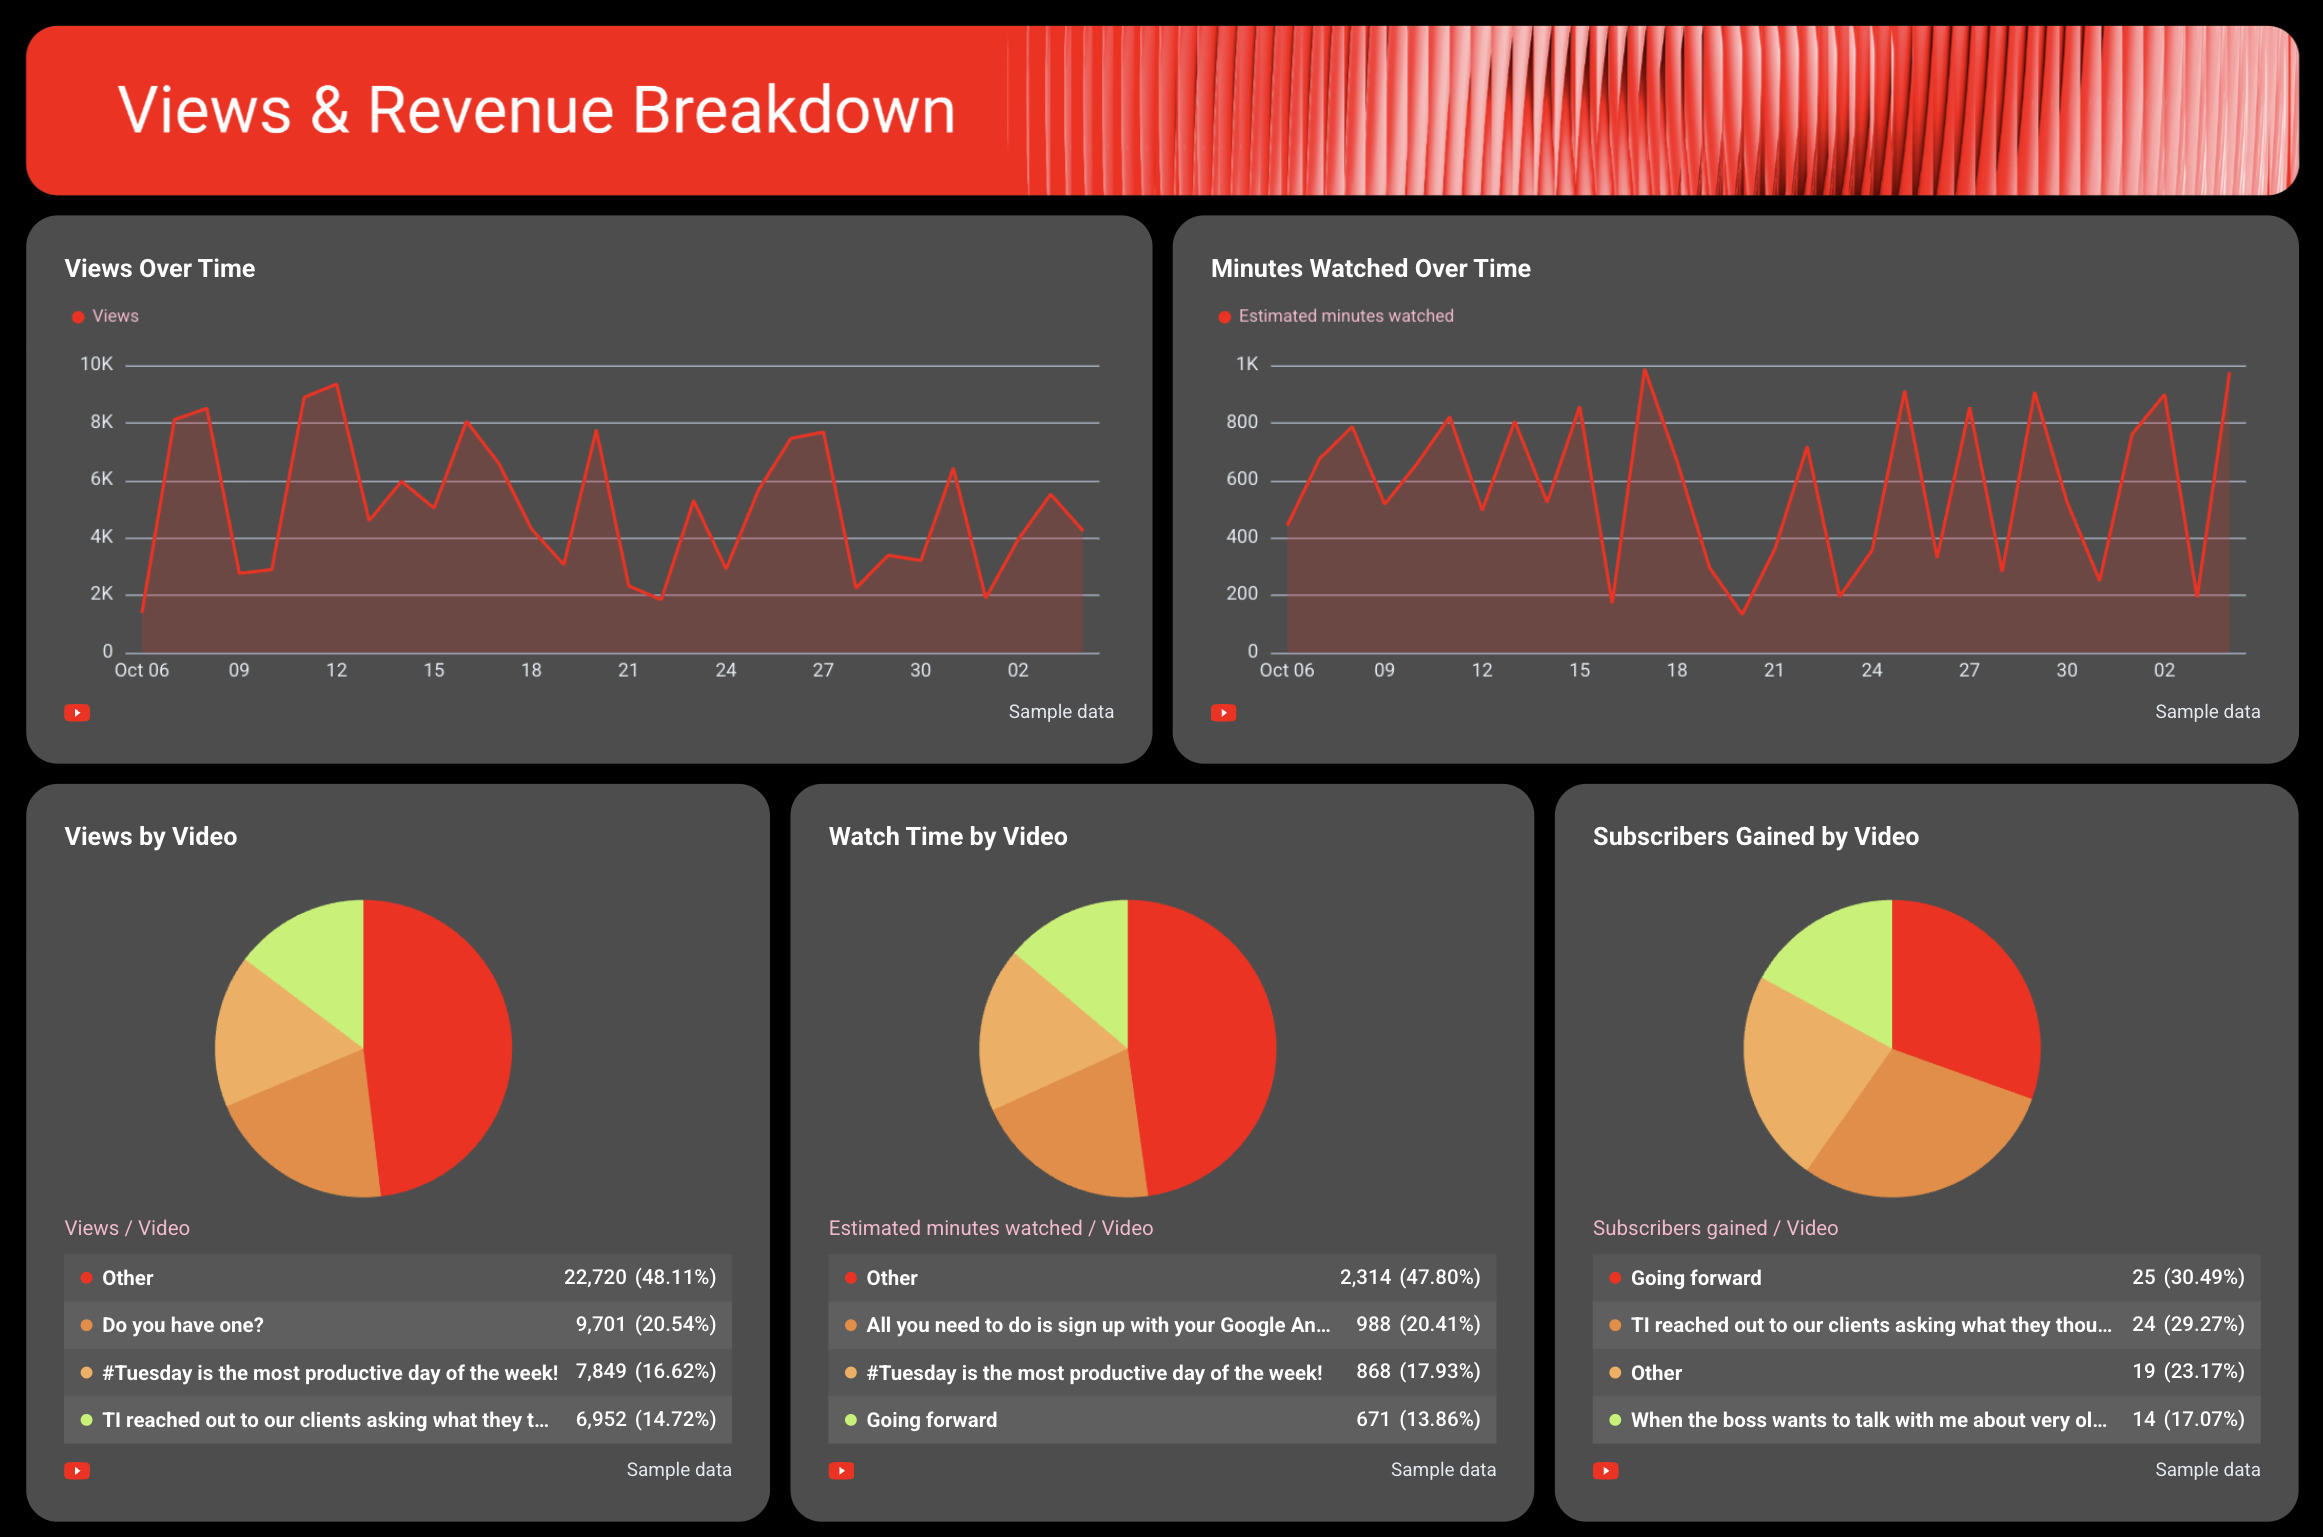
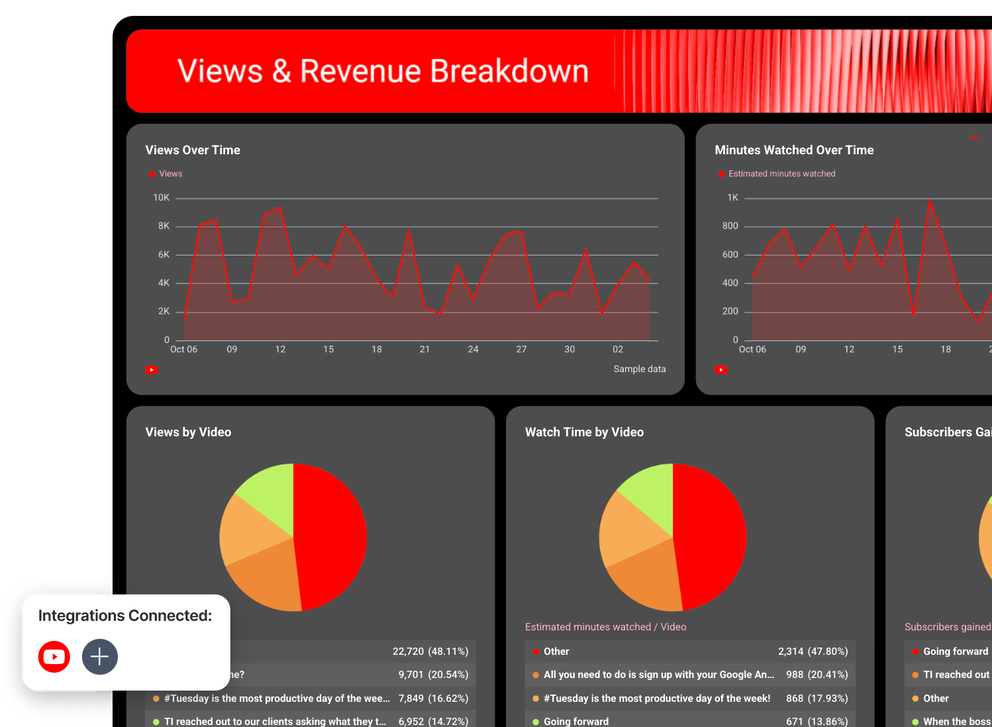
Youtube Report Template - A dashboard with graphs and pie charts showing views and revenue breakdown.

The next section of your YouTube report should focus on view and revenue trends.

Include:

  • Views over time and minutes watched over time to see audience engagement and retention patterns.
  • Breakdown of views, watch time, and subscribers gained by video to compare how each upload performs.
  • A Subscribers Gained vs. Lost trend chart to track subscriber growth.
  • Video Views vs. Average View Duration Percentage, Likes vs. Dislikes Over Time, and Views vs. Estimated Revenue Over Time graphs to visualize engagement and monetization trends.

These visualizations make your YouTube analytics clear and actionable, helping you connect performance metrics to actual growth and ROI.

3. Video Performance Breakdown
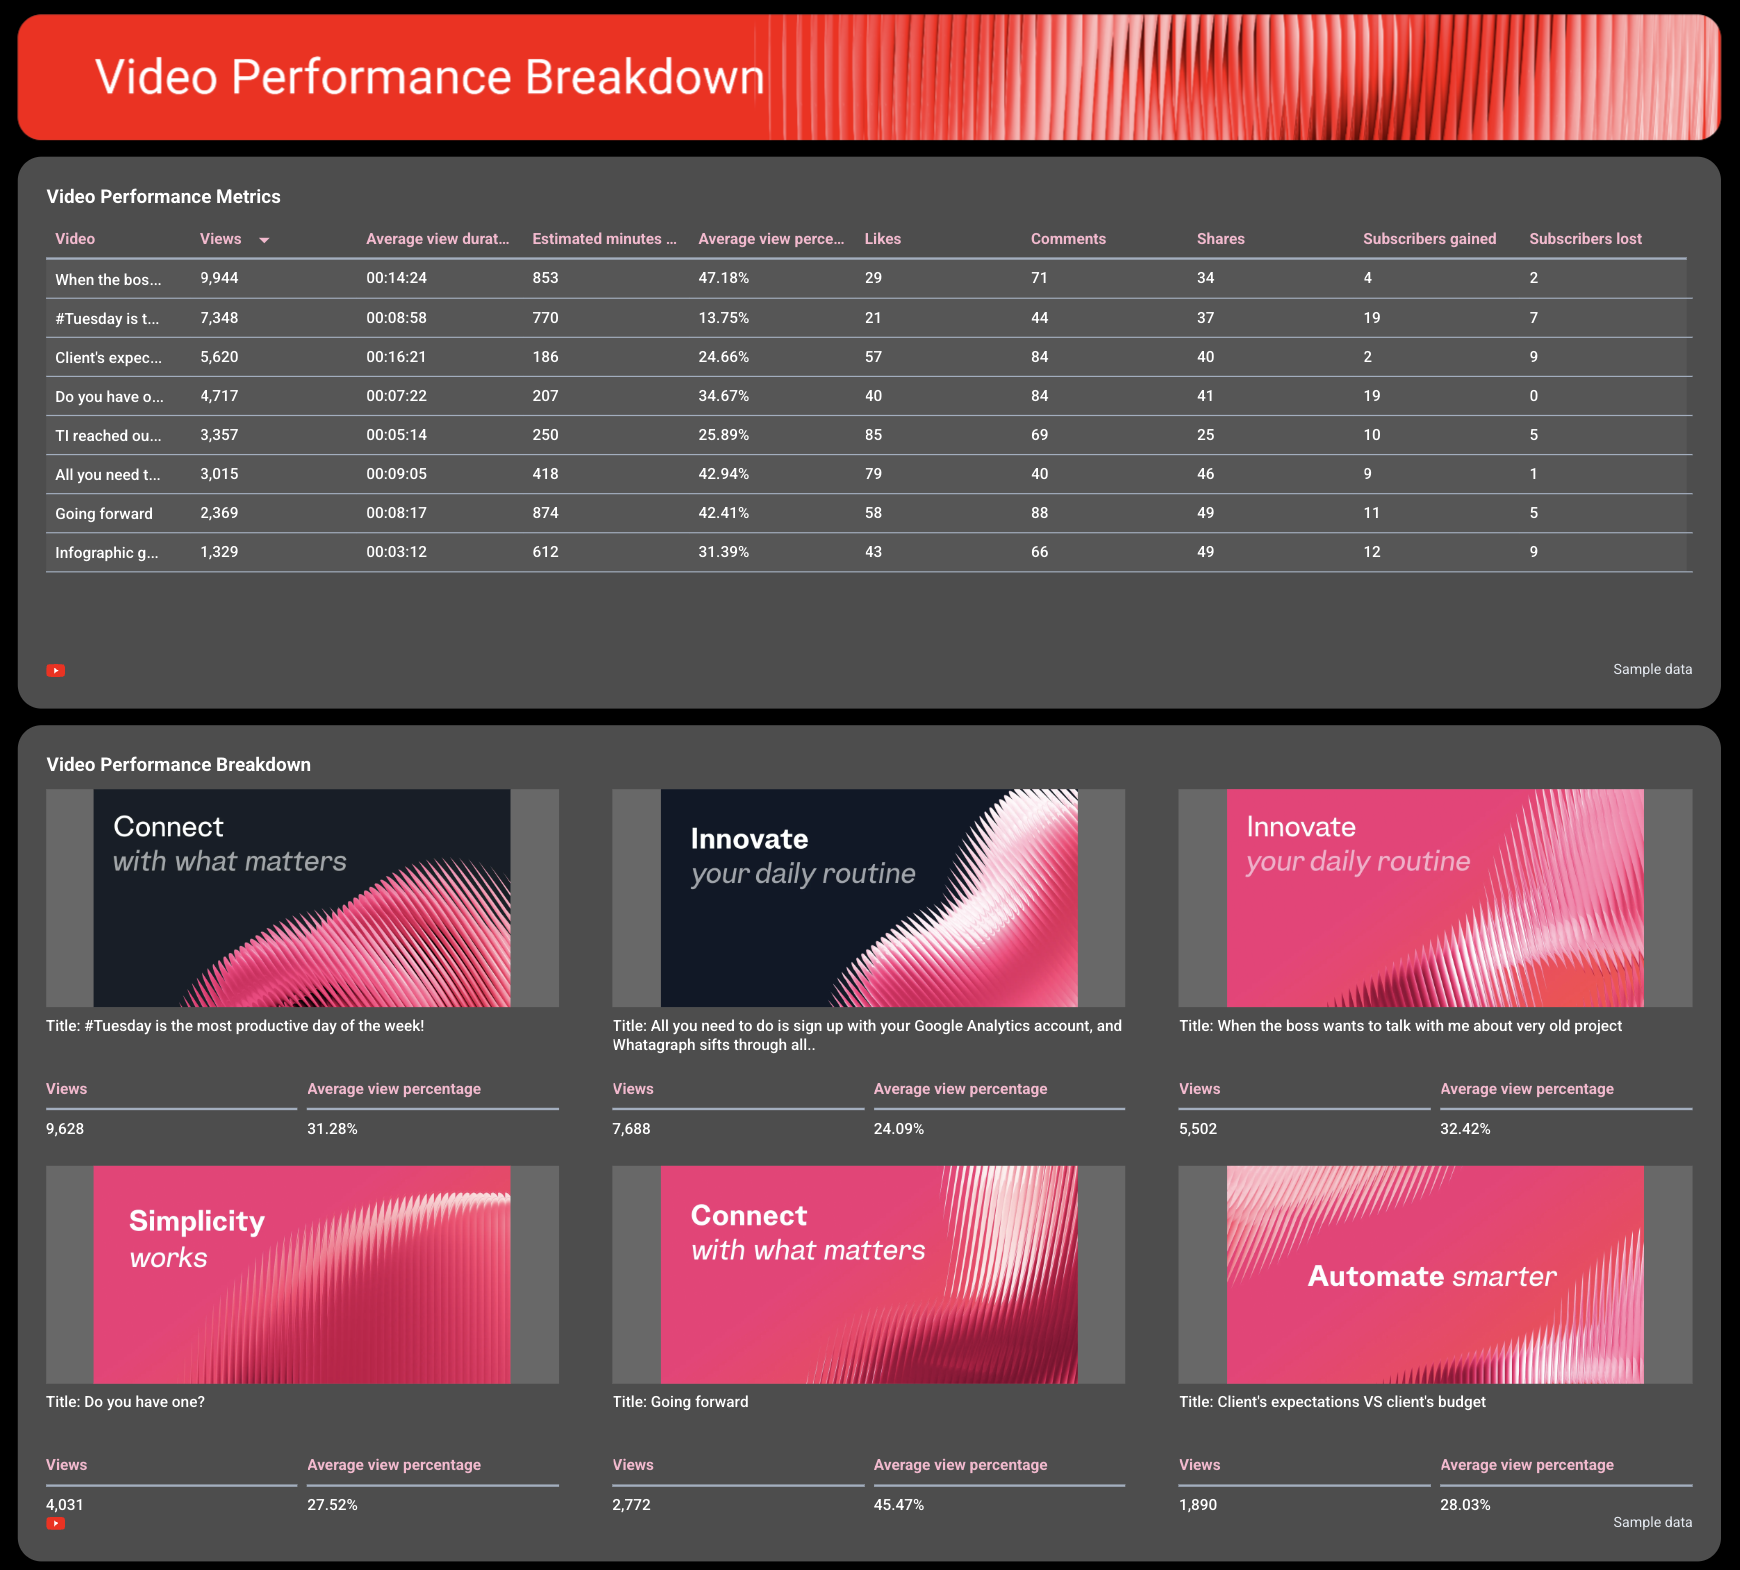
Youtube Report Template - A dashboard with video performance metrics and graphical analysis.

Your Video Performance Breakdown is the heart of the YouTube analytics report template.

Include a comprehensive table showing all your YouTube videos and key metrics for each:

  • Number of views
  • Average view duration
  • Estimated minutes watched
  • Average view percentage
  • Likes, comments, and shares
  • Subscribers gained and lost

Pair this with a carousel chart that displays video thumbnails and key data — like total views and average view percentage. This helps quickly identify which videos drive the strongest engagement metrics, improve audience retention, and contribute to higher conversion rates.

These help pinpoint which types of video content resonate most with your audience and which need optimization, and helps shape your future content strategy.

4. Engagement Breakdown
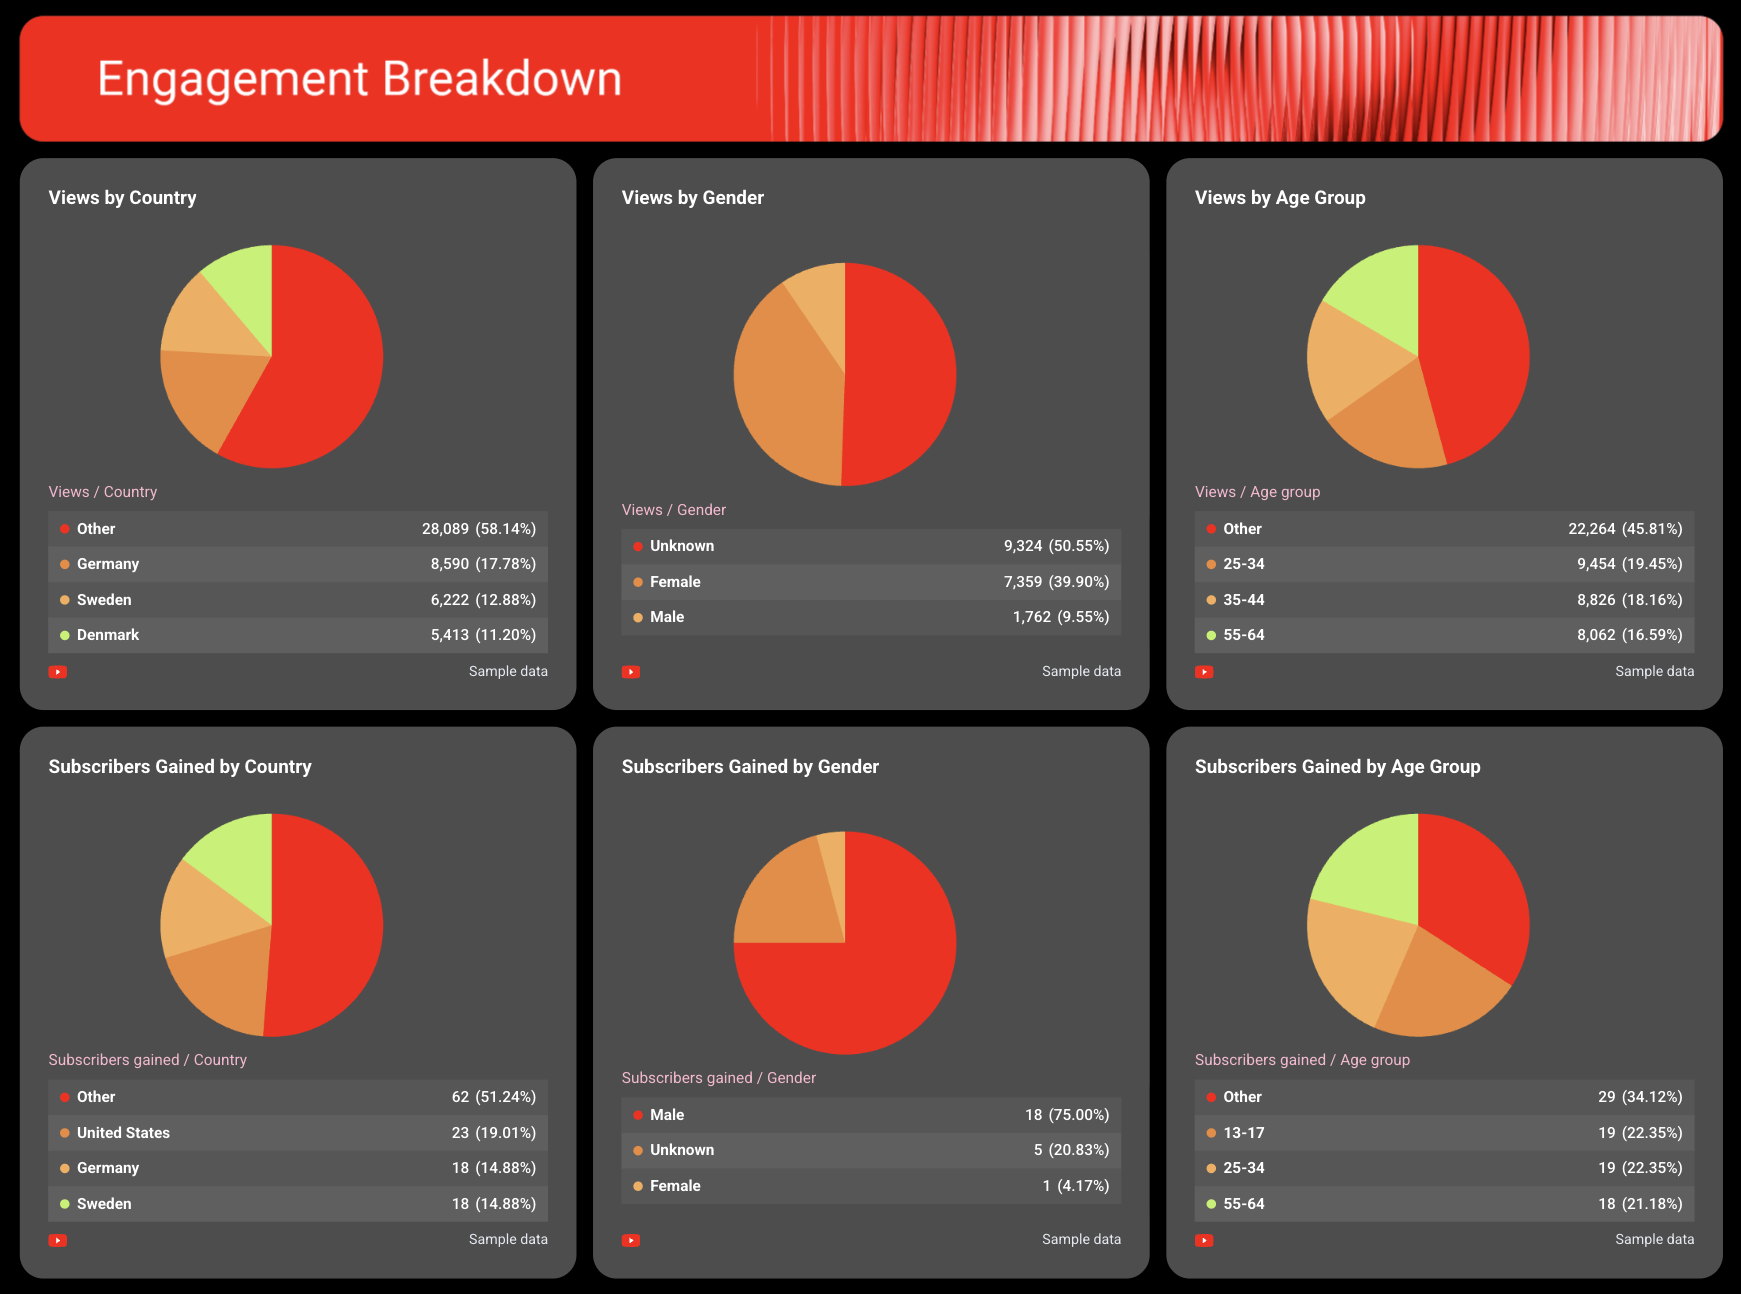
Youtube Report Template - A dashboard showing pie charts representing engagement breakdown data.

The Engagement Breakdown section visualizes your YouTube channel demographics and audience behavior.

Use pie charts to display:

  • Views by country, gender, and age group
  • Subscribers gained by country, gender, and age group

This data reveals who’s engaging with your channel and where your content resonates most. Combined with other social media insights, these demographics help refine your targeting, optimize content distribution, and improve overall content performance across marketing channels.

5. Recommendations

Youtube Report Template - Recommendations for video content creation and strategy.

End your YouTube report with recommendations and next steps.

With Whatagraph IQ, you don’t need to write this manually. IQ analyzes your connected YouTube account data and generates instant insights for a specific reporting period.

You can choose from five content types — Summary, Wins, Issues, Recommendations, or a Custom prompt — in 18 different languages.

Whatagraph IQ doesn’t “hallucinate” because it’s based on your actual YouTube data. Also, your marketing data stays safe and sound in one platform rather than being sent to external tools like ChatGPT.

You can also fully edit the text after to make sure it’s on-brand and accurate.
Connect All Your Marketing Data in One Place

Bring all your social media, paid ads, SEO, email marketing, and more into one platform with no-code, stable connectors that you don't need to babysit. 

Why Marketers Love Reporting on Whatagraph

Whatagraph's AI is saving so much time and energy for our marketing specialists. We now have more time to focus on strategic things that help both our agency and our clients grow.

Lars Maat

Lars Maat

Co-Founder @ Maatwerk Online

StarStarStarStarStar

Whatagraph took us to the next level with our clients and within our team. Our relationships with clients have been amazing, and we’ve even been able to retain them longer.

Kim Strickland

Kim Strickland

Digital Marketing Specialist @ Peak Seven

StarStarStarStarStar

Whatagraph has become an essential partner for scaling our reporting, and my teams love it because it saves so much time. We’d recommend it to any team looking to automate data reporting and use AI for insights.

Danielle Roberts

Danielle Roberts

Director of Implementation & Support @ Rentable

StarStarStarStarStar

Whatagraph is easy to use, visually attractive, and much smoother compared to tools like Looker Studio.

Stef Oosterik

Stef Oosterik

Quality Manager @ Dtch. Digitals

StarStarStarStarStar

Frequently Asked Questions

Have more questions? We answered them here.

What is a YouTube report template?

A YouTube report template is a ready-made layout that tracks your channel performance over a set period. It visualizes YouTube key metrics such as views, watch time, engagement rate, and subscriber growth — all in one shareable report.


With Whatagraph, you can use pre-built YouTube analytics report templates to automatically pull your YouTube data, highlight key metrics, and deliver insights that help you optimize your video content strategy.

How to make a YouTube report?

You can build a YouTube report in minutes with Whatagraph:


Start free and create an account.


Select the YouTube report template from the library.


Connect your YouTube account as the data source.


Customize your widgets, goals, and visualizations to match your brand.


Share or automate your reports to send on a schedule.


That’s it. No spreadsheets, no manual tracking. You’ll get a full view of your YouTube analytics, including watch time, video views, and audience engagement, updated in real-time.

Can ChatGPT analyze my YouTube channel?

Technically, yes, ChatGPT can analyze exported data from your YouTube reporting tool.


However, many marketers worry about data breaches and privacy risks when uploading raw channel data to external tools.


With Whatagraph, your YouTube report stays 100% secure. The platform connects directly to your channel via a verified API connector, ensuring no third-party access or data leaks — and you still get automated insights written by Whatagraph IQ, trained specifically for marketing data. 


We are also:


  • GDPR-compliant
  • SOC-Type II certified
  • EU data hosted
  • SSO/SAML locked
  • AES-256 encrypted

What metrics should be included in a YouTube report?

A YouTube stats report template should include:


  • Views and video views over time
  • Watch time and average view duration
  • Subscribers gained and lost
  • Engagement metrics like likes, comments, and shares
  • Audience demographics (country, gender, age group)
  • Estimated revenue and conversion rate


These performance metrics show how your videos are performing and where you can optimize your content strategy to increase reach and retention.

What other marketing channels can I connect with Whatagraph?

Apart from YouTube, you can connect all popular social media such as LinkedIn, Facebook, and TikTok, PPCs like Facebook Ads and Google Ads, e-commerce platforms like Shopify and WooCommerce, SEO tools like Ahrefs and Google Search Console, email marketing tools like Klaviyo and Mailchimp, Google Analytics 4, and CRMs like HubSpot and Salesforce.


If you can’t find the integration for your data source, connect it via a Custom API or export it to Google Sheets docs or BigQuery data warehouse and add it as a source.

Where can I find a free YouTube report template?

You can use Whatagraph’s free YouTube report template to track and visualize your YouTube analytics automatically.


It connects directly to your YouTube account, pulls your latest marketing data, and builds a fully designed report you can share with clients or teams.