WooCommerce Dashboard

Running a WooCommerce store? How do you track its performance? You can use the WooCommerce admin dashboard, but is it engaging enough? Would any stakeholder outside the industry know how to read it? Use our WooCommerce dashboard to monitor and share essential e-commerce metrics such as total sales, order status, refunds, and revenue in a way everyone can understand. Pull data directly from your WooCommerce account to our dashboard and use the insights to optimize the performance of your or your client’s online store.

WooCommerce Dashboard for Marketers
Trusted by 1,000+ marketing agencies around the world
Whatagraph image
Whatagraph image
Whatagraph image
Whatagraph image
Whatagraph image
Whatagraph image
Whatagraph image
Whatagraph image
Whatagraph image
Whatagraph image
Whatagraph image
Whatagraph image

Analyze and share your e-commerce store performance with one WooCommerce analytics dashboard

Monitor all your WooCommerce metrics and e-commerce KPIs in one place

Want to know how your online store is performing? Try Whatagraph and analyze all sales campaigns and marketing performance. Highlight your campaign results in a custom WooCommerce dashboard to quickly identify ad effectiveness. Effortlessly combine WooCommerce analytics with data from your other e-commerce, email, or web analytics platforms to get the full picture of your marketing and sales efforts. Unify names of ad sets or group countries in tiers. Gauge real-time performance data to recognize key trends and customer behavior patterns.

Monitor all your WooCommerce metrics and e-commerce KPIs in one place

Spend less time visualizing e-commerce insights

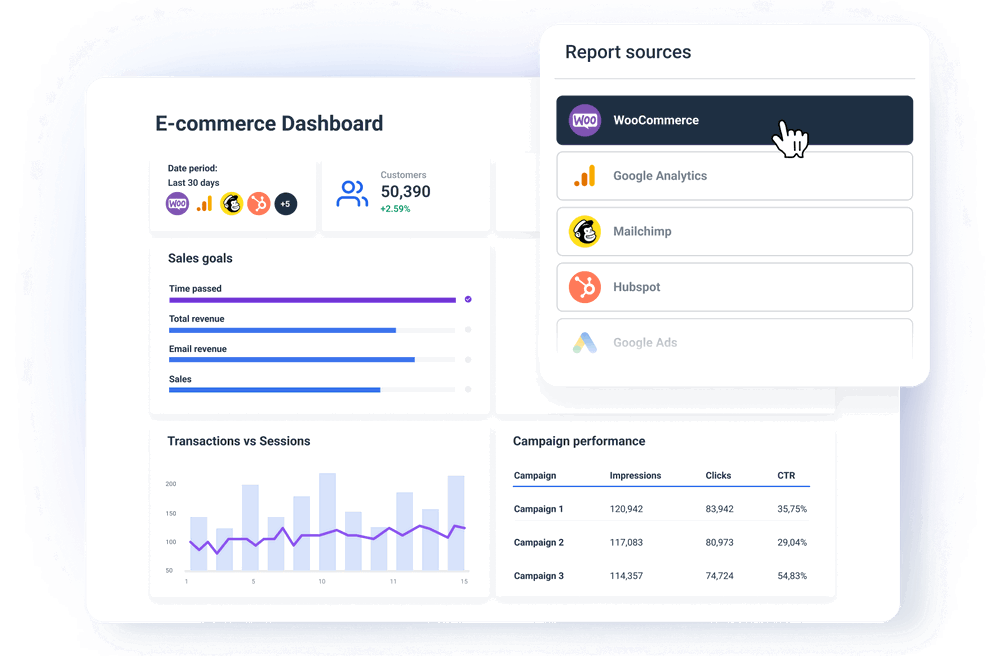
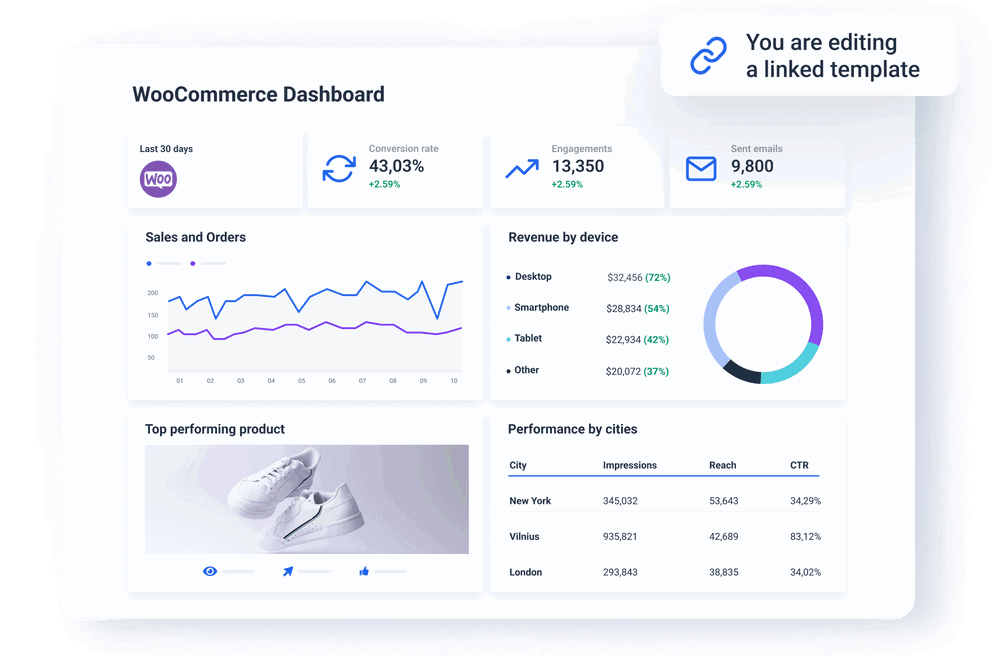
No more setting up WooCommerce plugins or add-ons or downloading Excel spreadsheets to analyze performance. Pick our WooCommerce dashboard and evaluate each online store's performance by campaigns, channels, locations, devices, and other metrics. Once you connect your WooCommerce account, the dashboard populates with the latest data. Use the data to immediately determine how different channels or campaigns are performing. Adjust your sales efforts based on real-time data. Quickly adapt the dashboard for another client’s needs. Link multiple dashboards and edit them in bulk.

Spend less time visualizing e-commerce insights

Fully automated WooCommerce insights with Whatagraph

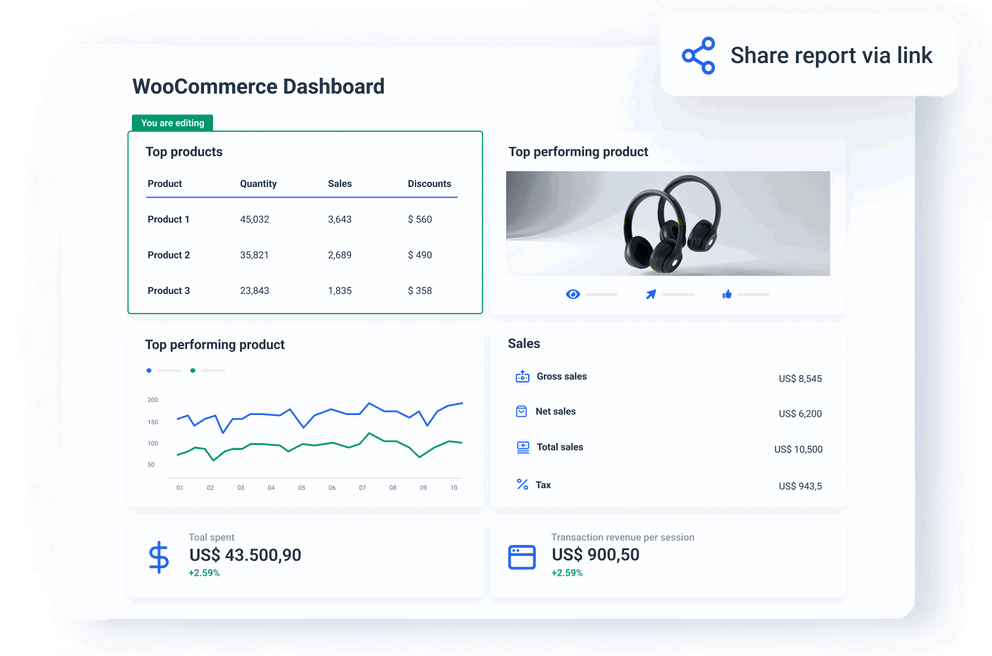
Share a live link to a WooCommerce client dashboard that updates automatically instead of gathering and sending over data whenever your clients request it. Another great feature - the dashboard is interactive. The viewers can change the date ranges, explore the data, and, if needed, secure it with a password. Quick insights into WooCommerce campaigns for faster decision-making.

Fully automated WooCommerce insights with Whatagraph

All dashboard features your agency needs

50+ data sources
50+ data sources
Create a true cross-channel digital marketing dashboard in Whatagraph. Over 50 integrations for your cross-channel marketing campaigns.
Live dashboards
Live dashboards
Securely share interactive access to your dashboard at any time from anywhere.
Cross-channel insights
Include data from different sources into the same widgets or dashboards with a few clicks. Provide a full picture of your campaigns’ success.
White-label dashboards
Customize colors and logos in each dashboard to align it with your agency’s or clients’ branding and style.

It’s good to be loved! Our clients are not shy about expressing it.

I made a switch from GDS and Sheets for reporting to Whatagraph, and I am saving literal hours each week on performance report creation. Our small firm actually managed to onboard 2 new clients as a result of all the time we saved on managing data and reporting. The customer service is also really helpful and easy to reach.

Mindaugas S., Marketing ConsultantCapterra logo for Whatagraph review

Capterra verified review by

Mindaugas S., Marketing Consultant

Having active customer support to help fix any issues was a big contributor, but we also really liked the ability to save templates and connect sources to multiple charts/widgets at once without having to edit them individually. And having the grid layout is much easier to stay consistent with than the free form setup that Data Studio has.

Nico T., Media PlannerCapterra logo for Whatagraph review

Capterra verified review by

Nico T., Media Planner

The system has standard templates that are easy and fast to use. Also you can build your own report with lightning speed. It is very easy to use, has a lot of integration, and let get started very fast.

Rasmus Bernt K., External Senior Management ConsultantCapterra logo for Whatagraph review

Capterra verified review by

Rasmus Bernt K., External Senior Management Consultant

We love Whatagraph - we would definitely recommend and our account manager is great! I love how easy this tool is to use, everyone on the team finds it much more user-friendly than other dashboards. Integration was easy, we sent some example reports to the team who duplicated these for us. We literally had to log in and send it to our clients!

Stephanie S., Digital DirectorCapterra logo for Whatagraph review

Capterra verified review by

Stephanie S., Digital Director

We are showing our clients the work that we're doing for them and this is incredibly important for our clients ROI. They want to see results and having a tool like Whatagraph that can show data from virtually every source we use is hugely important.

John S., SEO StrategistCapterra logo for Whatagraph review

Capterra verified review by

John S., SEO Strategist

The tool is easy to use; you do not need to have development resources. Even my junior project managers are capable of making campaign reports in minutes. There are a lot of pre-made templates you can use as well as many pre-made widgets.

Erman E., Marketing SpecialistCapterra logo for Whatagraph review

Capterra verified review by

Erman E., Marketing Specialist

Really easy to connect data sources within the tool. The library of report templates has been helpful. The customer support team has been responsive to all of our needs. Our team enjoys the simplicity of setting up the reports and how the data is presented.

Brent N., Director of OperationsCapterra logo for Whatagraph review

Capterra verified review by

Brent N., Director of Operations

Easy to create really beautiful graphs and reports which can help other team members to understand the most important takeaways. I especially like the automated report function, so I don't have to check on the same thing repeatedly.

Orsolya S., Online Marketing ManagerCapterra logo for Whatagraph review

Capterra verified review by

Orsolya S., Online Marketing Manager

What is a WooCommerce dashboard?

A WooCommerce dashboard is a dynamic display with all the essential key performance indicators (KPIs) that e-commerce businesses need to make informed decisions. Via user-friendly widgets and data organization features, a WooCommerce dashboard allows you to accurately connect and share the critical KPIs and metrics with clients or stakeholders and allows them to make data-driven decisions fast.
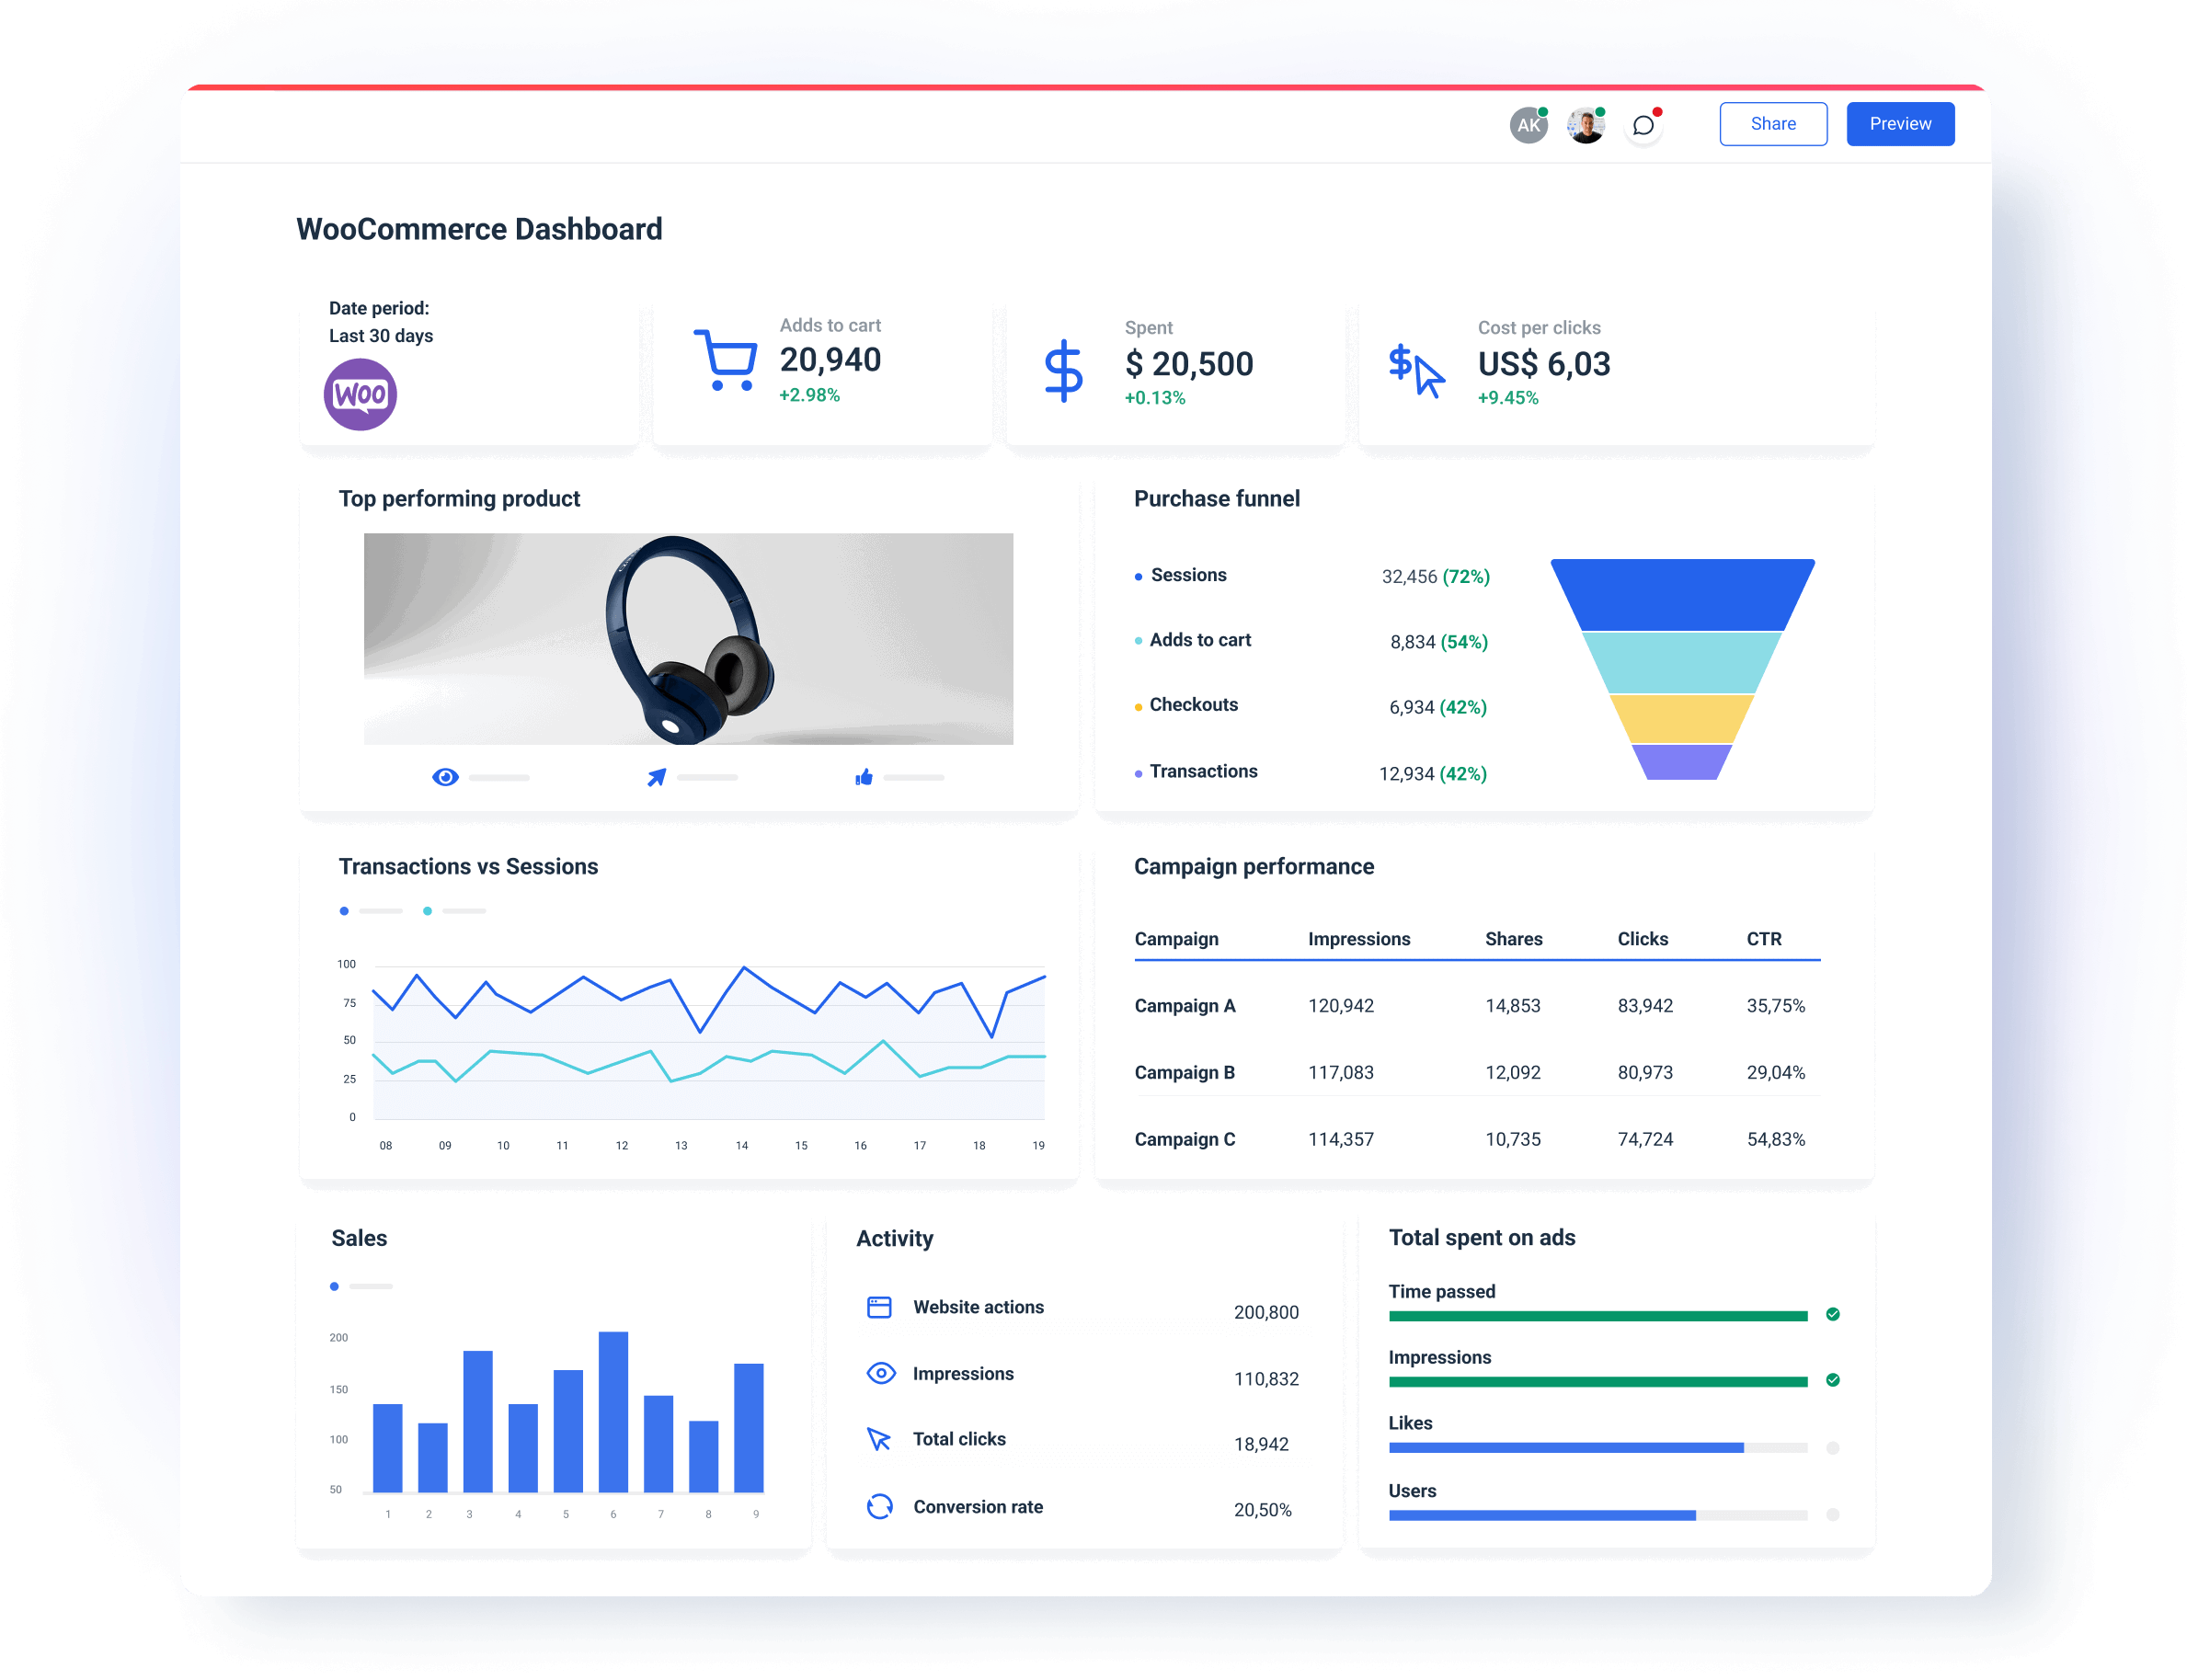
WooCommerce Dashboard in Whatagraph

What can a WooCommerce sales dashboard tell you?

Tracking WooCommerce insights can provide valuable information about various aspects of your ecommerce store's performance, customer behavior, and sales effectiveness. Here are some key insights that our WooCommerce dashboard can tell you:

Sales performance: WooCommerce insights can provide detailed information about your store's sales performance, including total revenue, sales trends over time, and sales by product category or SKU. You can track metrics such as total orders, new customers, average order value, net sales, and conversion rates to assess the effectiveness of your sales strategies and identify opportunities for growth.

Product performance: By analyzing WooCommerce statistics, you can gain insights into the performance of individual products or product categories. This includes metrics such as best-selling products, top-selling categories, and product popularity over time. Understanding which products are performing well and which ones are underperforming can help you make informed decisions about inventory management, pricing strategies, and product promotions.

Customer behavior: WooCommerce insights can provide valuable information about customer behavior and preferences. This includes metrics such as customer demographics, purchase frequency, and average order size. By analyzing customer behavior data, you can identify trends, segment your customer base, and personalize marketing strategies to better meet the needs of your target audience.

Marketing effectiveness: Tracking WooCommerce data allows you to assess the effectiveness of your marketing efforts and campaigns. You can monitor metrics such as website traffic, referral sources, and conversion rates to determine which marketing channels are driving the most traffic and sales. This information can help you optimize your marketing strategies, allocate resources more effectively, and maximize your return on investment.

Checkout process: Insights from WooCommerce data can help you optimize the checkout process and reduce cart abandonment rates. By tracking metrics such as checkout completion rates, average order value, and payment method preferences, you can identify friction points in the checkout process and implement strategies to streamline the user experience and increase conversions.

Customer lifetime value: WooCommerce insights can provide valuable information about the lifetime value of your customers. By tracking metrics such as repeat purchase rates, average order frequency, and customer retention rates, you can assess the long-term profitability of your customer relationships and implement strategies to increase customer loyalty and lifetime value.

Overall, tracking WooCommerce insights allows you to gain valuable insights into your ecommerce store's performance, customer behavior, and sales effectiveness. By leveraging this data effectively, you can make informed decisions, optimize your strategies, and drive growth and success for your online business.
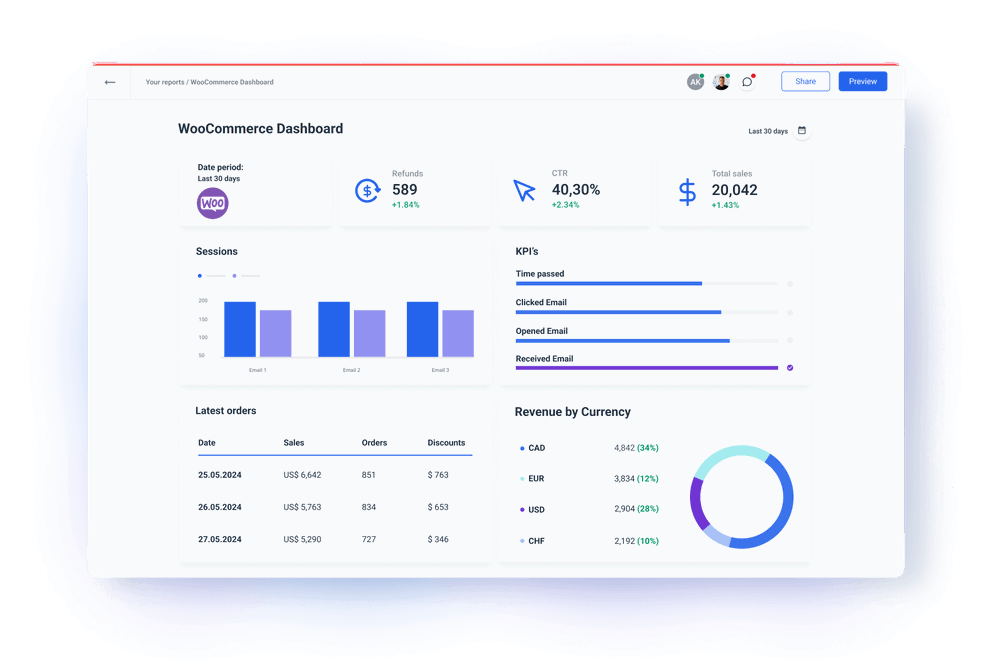
Build a WooCommerce custom dashboard in minutes

Pick from over 20 WooCommerce metrics and create standalone WooCommerce dashboards or easily combine data from different integrations and build cross-channel dashboards in Whatagraph. 

FAQs

All your questions answered. And if you can’t find it here, chat to our friendly team.

Does WooCommerce have a dashboard?

Yes, WooCommerce has a WordPress dashboard, which is normally the first thing you see when logging in. When you activate it, WooCommerce will add two dashboard widgets that give you an easy to access an overview of your store, and a third if you have a multi-site with multiple stores.


This way of tracking data is good if you manage a small online store. However, if you’re a marketing agency that needs to inform its clients on in-depth e-commerce performance, plus other marketing channels, you need an advanced WooCommerce customer dashboard that lets you add data from other sources, has an organize functionality and can automate most of the process.

Does WooCommerce have analytics?

Yes WooCommerce has powerful analytics built into the WooCommerce platform, that provides insights into an e-commerce store's performance. This analytics system is designed to help agencies and store owners gain insights into customer behavior, sales trends, and overall store effectiveness.


However, no e-commerce store is an island. If you want to see the big picture and get more context into your store’s performance by analyzing how customers get in your store, you can use Whatagraph’s WooCommerce dashboard to connect data from Google Analytics, paid ads platforms, and even SEO tools, to see which keywords give you the most visits.

What separates the Whatagraph’s WooCommerce dashboard from the competition?

The Whatagraph’s WooCommerce dashboard has several key features that make it stand out from the competition:


1. Connect, organize, visualize, and share data in one intuitive environment


2. Create stunning visualizations in a few clicks


3. No-code cross-channel isnigths and data transformation


4. Save and reuse any part of the dashboard and save a lot of time


5. Easily adapt the dashboard to different client needs