


What is ad creative analysis and how do agents help?
Ad creative analysis (also called creative performance analysis) is comparing your ads' images, videos and copy against their results to find out which creatives work and why.
Without agents, you’d need to export metrics from each ad platform, match every row to its thumbnail, and look for patterns by eye.
Agents can greatly reduce this data gathering time so you can get to insights in a fraction of the time.
An agent pulls results for every creative from each ad platform, looks at the actual ad images, and ranks them against the KPI you pick. Then it writes what the top ads have in common and how to fix the weak ones. Your team checks the findings and decides what to refresh. Once you've reviewed them, an agent can write the key findings into the client report in your brand style.
Ad creative analysis: automated vs. manual
Manual analysis still makes sense for a single platform with around 20 live ads or fewer, or a one-off review after a launch. Past that, most of the time goes to collecting and matching data instead of analyzing it. An agent does the collecting and the first read, so your time goes to the decisions.
| Manual | With an AI agent | |
|---|---|---|
| Getting the data | Export from each ad platform | Pulled from every connected platform |
| Matching images to numbers | Screenshots pasted next to rows | The agent views each ad image next to its results |
| Comparing platforms | A separate sheet per platform | One ranking across platforms, using shared naming |
| How often it runs | When someone has time | On a schedule, monthly or weekly |
| Explaining the why | Written from scratch by an analyst | Drafted by the agent, checked by an analyst |
Ad creative analysis case studies: how agencies use AI agents
Here's how one agency and our own paid team use agents for creative analysis.
GKV: finding out why a creative underperformed
GKV is a US agency where Anna Alexiadi Smyrniotaki leads analytics. Her team of two produces the monthly reporting for about 15 clients. Creative questions land on top of that, from account managers and the creative team.
Anna could already spot an underperforming creative in the numbers. Working out why took much longer. With an agent working on GKV's data, she gets the reason as well, in time to act on it. Anna said: "I would have noted that the creative is underperforming, but the agent was able to, like, figure out why, just very, very quickly in that same integration, and so we can, we can have a fix for it."
Whatagraph's paid team: catching LinkedIn creative fatigue early
Our paid team built a LinkedIn Ads creative fatigue agent with the Agent Builder, the agent that builds other agents from a plain-language request. It reads each live creative's daily results over the last 7 to 14 days and sorts every creative into one of four groups:
- Urgent: CTR down 40% or more over about eight days, or frequency above 3.5. Replace it now.
- Warning: CTR falling for three or more days in a row, with frequency between 2 and 3.5. The agent estimates how many days the creative has left.
- Healthy: CTR stable or rising, with frequency under 2.5.
- Exhausted: running for four to six weeks or more, with frequency over 5.
It ends with a rotation schedule for this week and next, plus notes on which audiences are seeing the same ads too often. The team runs it for creative health checks and before increasing budget.
How to implement ad creative analysis in Whatagraph with agents
1. Connect your data sources. Start with your ad platforms, like Meta, Google Ads, LinkedIn and TikTok, plus analytics or CRM if your KPI lives there. Whatagraph has 60+ native integrations.
If a tool isn't on the list, Origin, the pre-made agent that builds integrations in Whatagraph, can build one from the tool's API. It reads the API documentation, connects with your key, checks that real numbers come through, and publishes it as a source your team can use like any other. Only team admins can build custom integrations.
2. Build your governed data layer. Define your numbers once, so every report and agent reads the same thing. It all lives in the Data Hub, where Whatagraph stores and cleans your data.
- Custom metrics are numbers you calculate from other metrics, like CPA or ROAS.
- Custom dimensions are standard labels, like one concept name for the same creative on every platform.
- Blends join a few different channels into one view on a shared field like date.
- Source groups put sources from the same category, like all your ad platforms, into one source. That makes totals across every ad platform faster and easier to report on.
Pre-made agents can build these for you: KPI for custom metrics and dimensions, Omni for blends and Rollup for source groups.
3. Create a custom agent for ad creative analysis with this prompt. Paste it into the Agent Builder and fill in the brackets.
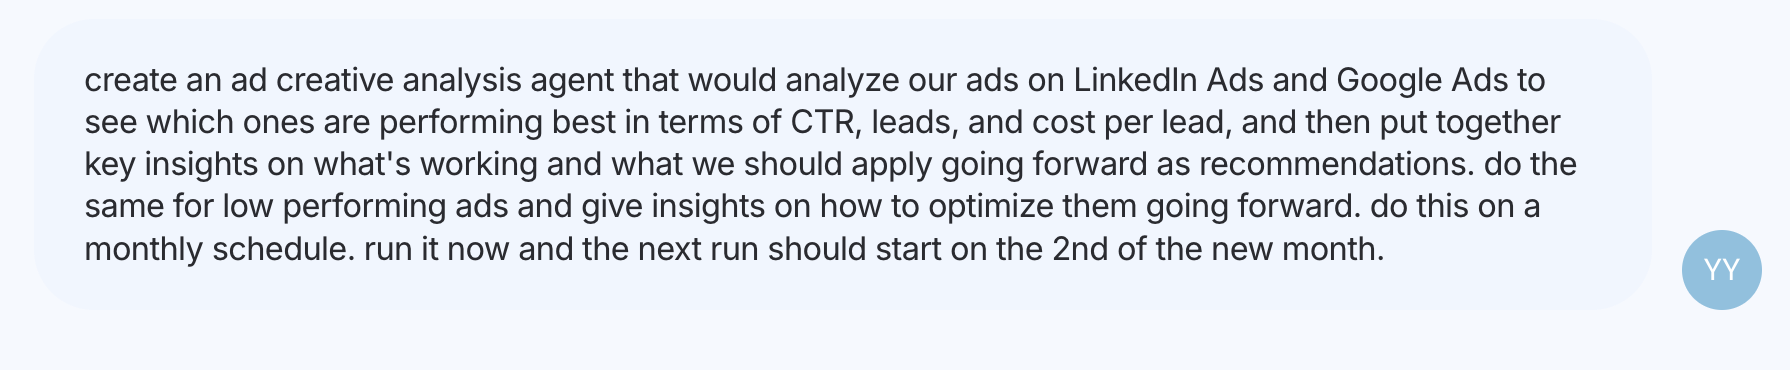
Create an ad creative analysis agent that would analyze our ads on [CHANNELS] to see which ones are performing best in terms of [METRICS], and then put together key insights on what's working and what we should apply going forward as recommendations. Do the same for low performing ads and give insights on how to optimize them going forward. Only comment on ads whose image you can see, and flag any ad with a missing preview instead of guessing. Don't pause, edit or send anything. Do this on a monthly schedule. Run it now and the next run should start on the 2nd of the new month.
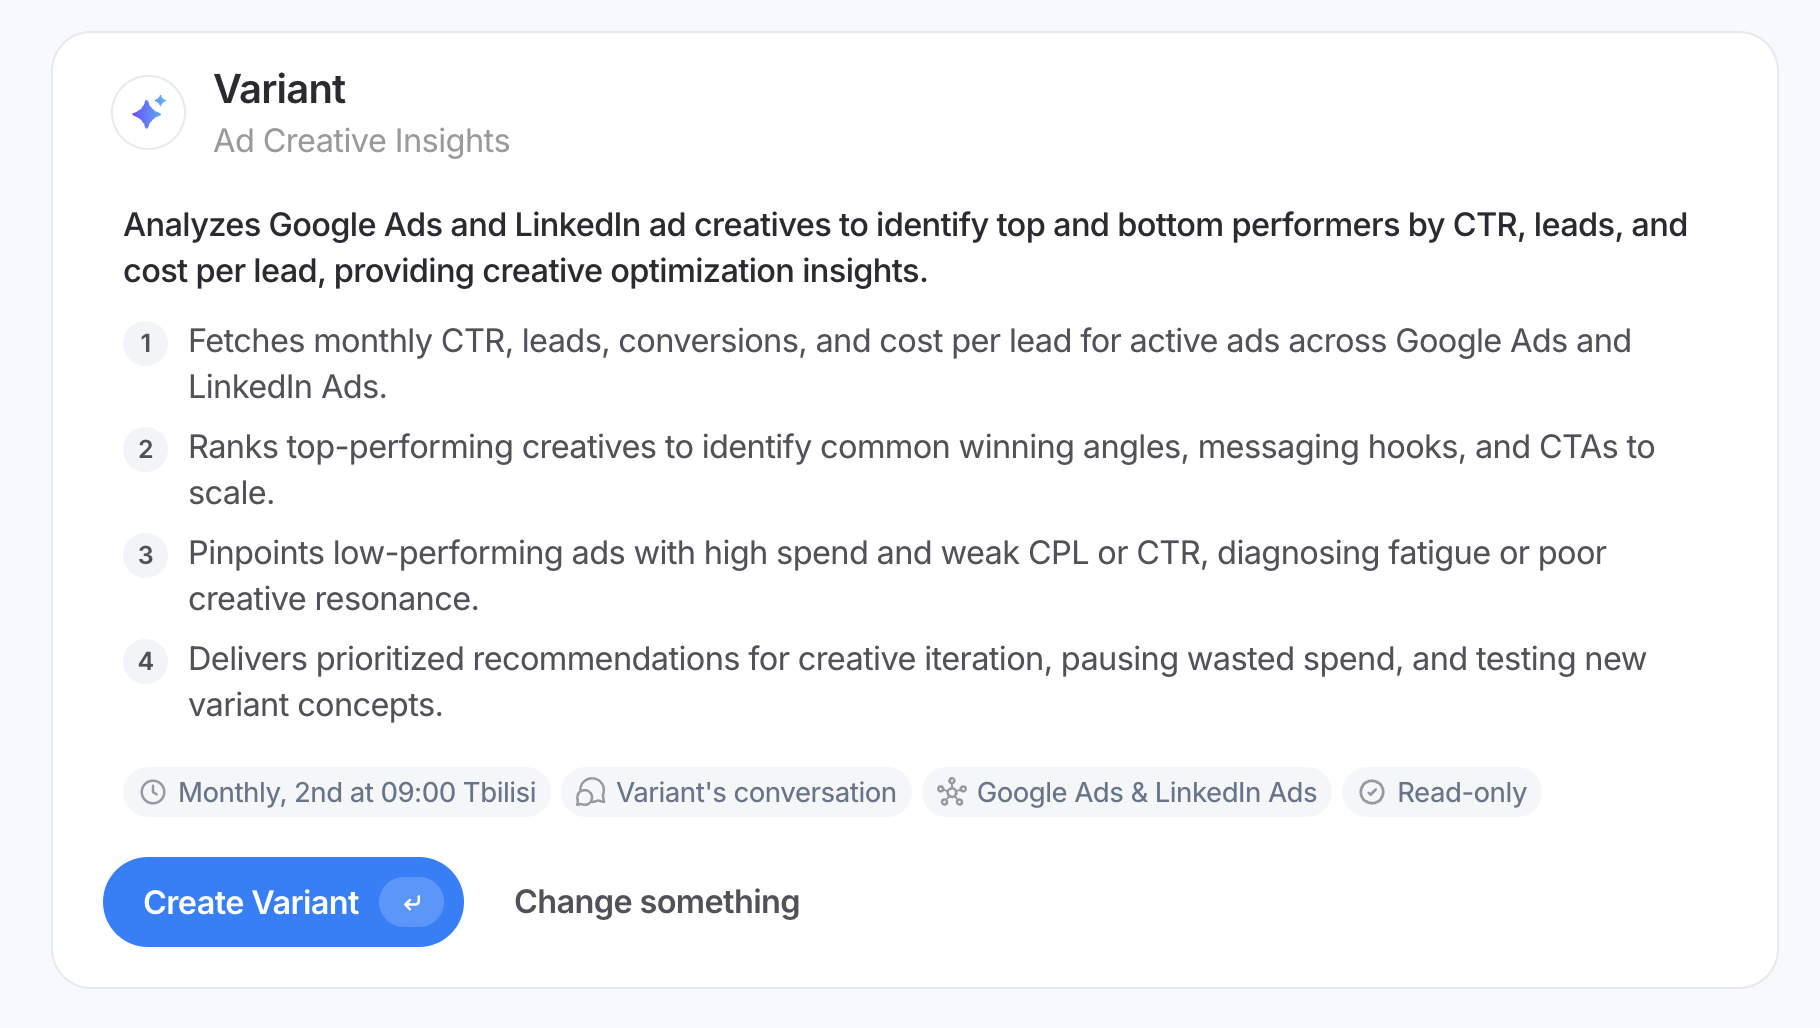
4. Approve the plan the agent comes up with. The Agent Builder proposes the agent before it builds anything: its name, what it does and how its instructions will work. Check the channels, metrics and schedule, then confirm. The first run starts straight away, so you can read the output before the monthly schedule begins.
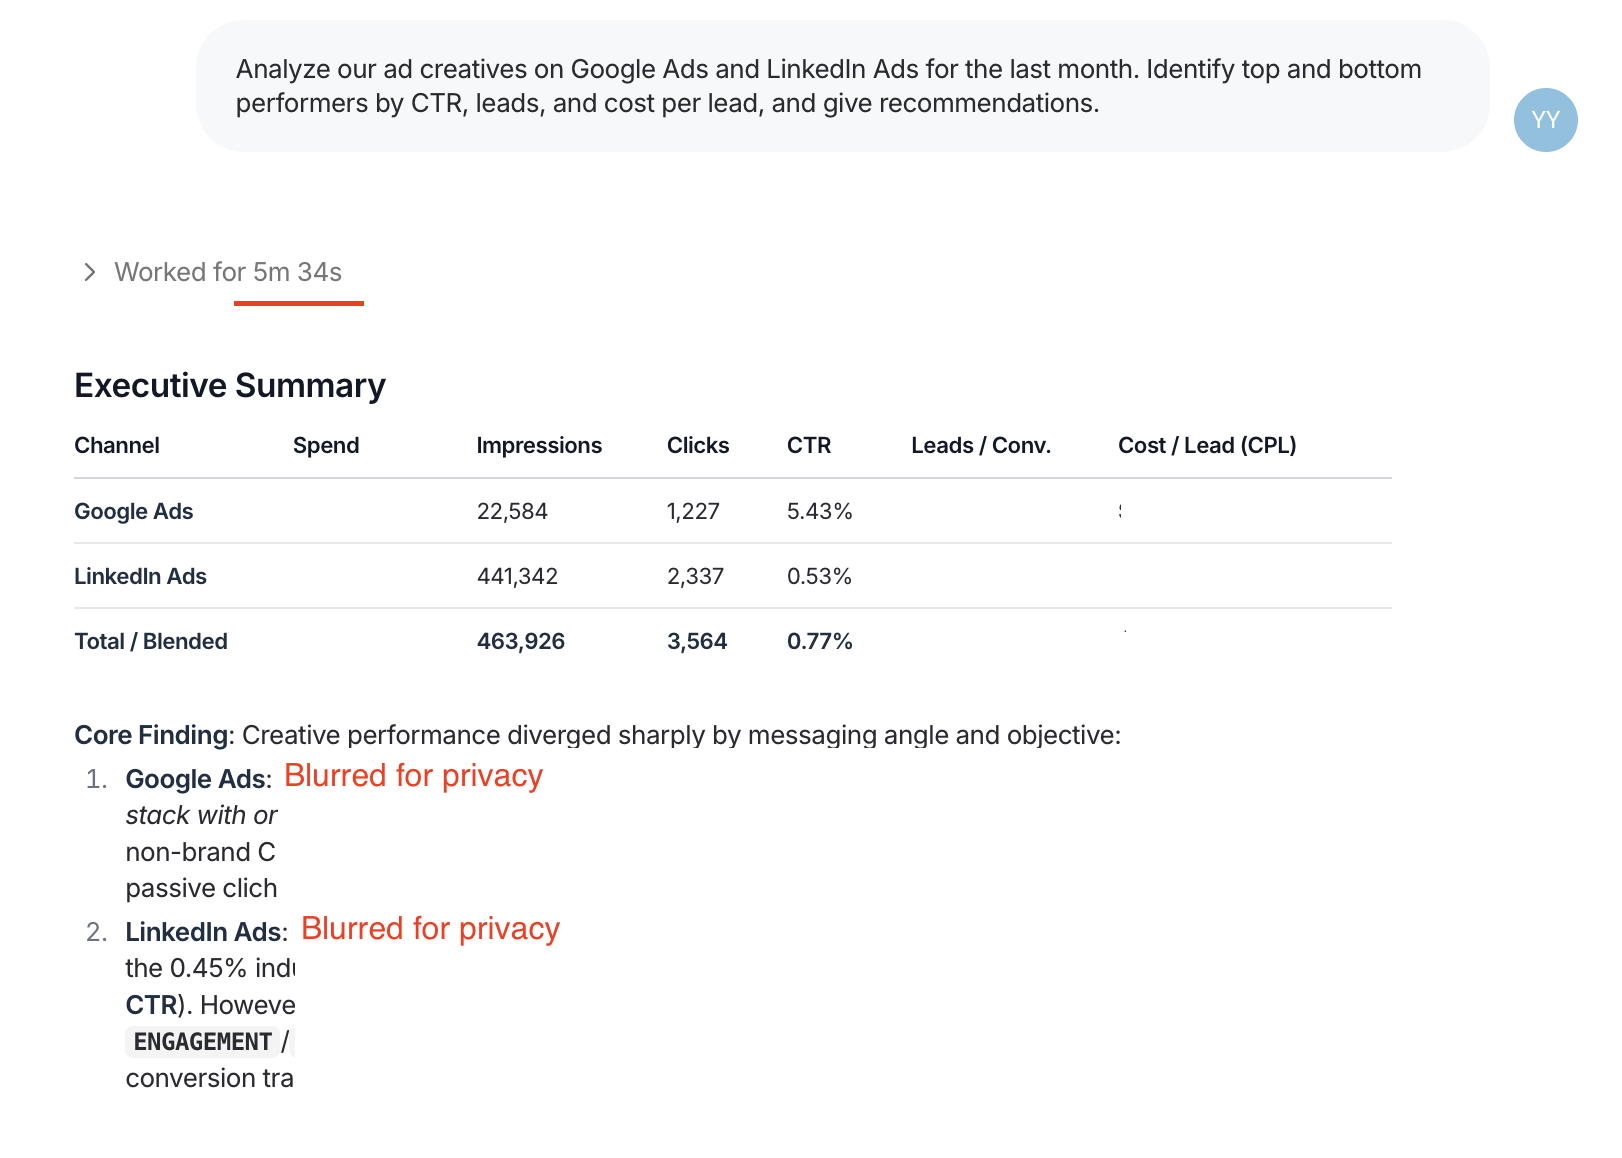
5. Do the first run and tweak results. Ask the agent to analysis your ad creatives and tweak the results as needed. Like "only compare ads with at least 1,000 impressions." For instance, the first run we did came back in 5 minutes with high-level insights and detailed breakdown in tables.
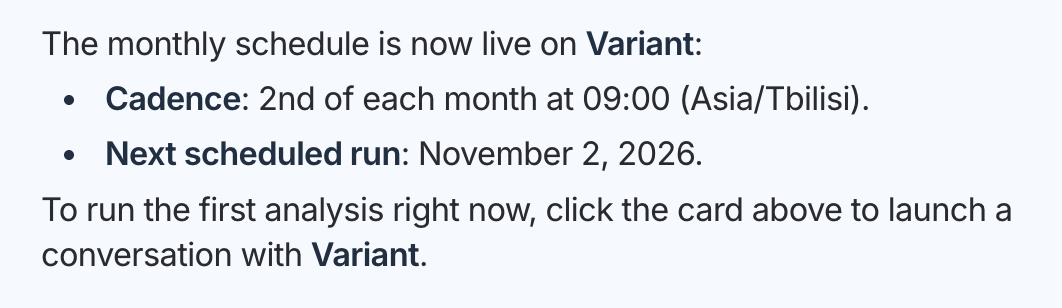
6. Schedule it for the next month. Once you're satisfied, schedule the agent to run on a schedule, like the 2nd of each month.
What are the benefits of ad creative analysis?
Ad creative analysis shows you which creatives to make next, as well as which ad won last month. Here are the benefits that come with doing this with agents:
✅ Faster answers to "how's my creative doing?" Clients ask about their creatives constantly, and the answers take too long. A reporting lead at a media agency said: "it takes us 24 hours to turn around and answer for them... And that's the big one we get a lot is actually, how's my creative performing? How's this creative performing? Am I hitting creative fatigue?"
With agents, you can not only answer client questions faster, but with deeper insights. For instance, for GKV, a communications agency in the US, their analytics lead can now answer ad-hoc questions from clients in about 10 minutes, up to 92% faster.
"With agents, I'm able to get back to the client not only faster, but with more informed feedback."
✅ Better briefs for designers. Creative teams want the same answers for their own planning. A marketer whose designers ask for creative results said: "our designers will be like, Hey... can you send us a report of every creative we've ever made and, like, how they perform because we want to see if there's trends and what's working, what's not working."
With agents, you can respond to them faster and in more details. They get patterns in format, hook and image style instead of a list of CTRs.
✅ Refreshes before fatigue costs money. You see a creative wearing out while there's still time to replace it. In a split test, Meta's analytics team found that adding new creative to ad sets with high fatigue improved conversion rate by 8% on average.
Agents also catch old ads that you’re still spending on without being refreshed. In one agency's Meta accounts, an agent read the end dates written into ad names and found ads still running a week after they'd expired.
✅ Patterns across clients. With the same naming and metrics in every account, you can see what works across your similar clients, not only in one account.
✅ Less time collecting data. The hours that went into exports and screenshots go to the analysis.
Best practices for ad creative analysis
Use relative thresholds when you haven't set goals. Compare each creative to its own recent results and to similar ads, instead of to a target nobody agreed on. Anna at GKV said: "We haven't exactly set up any goals within the system right now. So the alert system that I'm envisioning is a little bit more flexible... a huge drop is relative, right?"
Judge creatives on the KPI that matters, not CTR alone. An ad with a high CTR can still send visitors who don't convert. A marketing team at a software company said: "we don't really care as much about CTR. Like we look at CTR, but we want to look at that in relation to engaged sessions and engagement rate."
Compare like with like. Put images against images and videos against videos, with the same placement and objective. Google advises comparing assets by type, because a low rating for an image isn't the same as a low rating for a headline. A social team that runs story ads said: "we chose, it was a decision, to only measure the first slide of, for example, a three-story sequence... so we can always measure the first slide and compare those to each other."
Group versions under one concept. Name ads by concept and version, so you can see how the idea performs and which version of it did best. The same software marketing team said: "Maybe in the UTM Builder, we have like concept name, and then we can have like version, and then we can have, you know, like version details or something, or version title."
Wait for enough data before you judge. A creative with a few hundred impressions hasn't told you much yet. Set a minimum spend or impression count before the agent ranks an ad.
Run creative checks alongside your monitoring. If you already monitor every client's campaigns, add creative analysis to the same schedule so both land in one review.
Common challenges of implementing ad creative analysis
The same creative has a different ID on every platform. Upload one image to Facebook and TikTok and you get two unrelated ads. A data and performance specialist at an agency that runs ads across social and search said: "But how this tool will know the graphic with another IDs? Because... TikTok has another ID to the same graphic, like in Facebook." The fix is a custom dimension that maps each ad name to one concept, which is also how you compare performance across channels at the creative level.
Naming isn't consistent. One person's naming habit can split a concept into several. An agency team in Morocco said: "sometimes they will put, like, a blank or space between 5 and G. And another one will name it 5G with no space between the 5 and the G." KPI, the pre-made agent for custom metrics and dimensions, can clean names like these into one standard dimension.
Asset-level numbers are only a guide. Platforms split results across the assets inside an ad, so the numbers per asset don't add up neatly. Google says asset-level ratios like CTR, CPC and ROAS should be used as directional indicators only. Read them as direction, and confirm with ad and concept totals before you cut a creative.
There are too many ads to review by eye. Large accounts run hundreds of creatives at once. A UK media agency said: "I think for some client like this where there's going to be hundreds of ads, I think we need to have a play around and work out how, imagine if we're trying to show everything and then opening everything, it's going to go mental." An agent ranks every ad and shows you the top and bottom of the list, so you only open the ones that matter.