The 2026 Cross-Channel Analytics Guide for Marketers
Cross-channel analytics is the practice of bringing results from every marketing channel into one place and analyzing them together, rather than one dashboard at a time.
This guide walks through an implementation guide for cross-channel analytics, metrics to track, and tools to use.

Aug 24 2026●12 min read


- What is cross-channel analytics?
- What are common challenges in cross-channel analytics?
- How to implement cross-channel analytics in marketing?
- Why is cross-channel analytics important for your agency?
- The key metrics to track for successful cross-channel analytics
- The top 4 tools for cross-channel analytics in 2026
- The future of cross-channel analytics in digital marketing
On Monday, a paid media lead we talked to (let’s call her Michele) wants something that sounds pretty reasonable: "one place where I can spend 20 minutes and understand how all my accounts are doing."
But to decide which version she trusts, she compares Meta and Google spend with Shopify sales, checks Facebook's numbers against Triple Whale’s, and calculates her own blended CAC and ROAS. When the tools don’t reconcile, she does it by hand.
That’s what cross-channel analytics is supposed to save her from. But it’s a problem plenty of teams still haven’t solved.
WFA found that 46% of organizations remain at the lowest maturity levels in integrating data into a unified view, while only 13% consider themselves strong at quickly turning data into insights.
For Michele, pulling every channel into one place would get her most of the way there, but it still wouldn't get her all the way. That’s because cross-channel marketing analytics has a second problem hiding behind the first: putting conflicting numbers on the same screen doesn’t make them agree.
Our approach at Whatagraph, therefore, follows this framework: first consolidate, then govern, then analyze, whether the person asking the next question is you or an AI.
TL:DR
- Cross-channel analytics means judging every channel together, not one dashboard at a time.
- The hard part isn't pulling the data in. It's making a conversion, a CAC, or a blended ROAS mean the same thing everywhere before you compare anything.
- So the cross-channel implementation framework is: consolidate your data in one place, govern the data, and then send this governed data to reports, dashboards, and AI tools for analysis.
- In Whatagraph, IQ Agents now build that governed data layer, as well as reports, for you from a plain-language prompt.
- Thanks to cross-channel analysis on Whatagraph, Rentable runs 5,000+ data sources across 215 reports from one single source of truth, while Maatwerk Online now saves more than 100 reporting hours a month.
What is cross-channel analytics?
The purpose of cross-channel analytics is to gather, unify, and analyze results across all marketing channels together, instead of judging them separately.
That together is the important part. If you’re looking at Meta ROAS, Google CPA, and email revenue in separate dashboards, that’s still single-channel analysis. Google tells you about Google. Meta tells you about Meta.
A cross-channel analytics dashboard is what tells you whether they're working together and how well different channels are working.
Some teams call the more advanced version of this cross-channel marketing intelligence. You have the same unified view, but built on data that's been governed and standardized first. That distinction is basically what this whole piece is about.
Before we move on, it’s also useful to separate analytics from two adjacent ideas that often get bundled in with it:
- A cross-channel marketing strategy, also called orchestration, runs campaigns across channels, like an email that fires after someone sees your ad. That's execution. A cross-channel analytics report tells you how a campaign performed across channels after it’s live.
- An attribution model, including multi-touch attribution, answers a narrower question of how credit for a conversion should be distributed across the touchpoints that contributed to it. In contrast, cross-channel analytics is the unified view that attribution gets built on top of.
What are common challenges in cross-channel analytics?
Every platform counts what helps it, and ignores what doesn't. Meta and Google run different attribution windows, so the same conversion can get claimed by both, or by neither, depending entirely on which platform you happened to open first.
The platforms’ rules can also move without warning. For example, when Meta permanently removed its 7-day and 28-day view-through windows from the Ads Insights API in January 2026, advertisers who hadn't touched a single campaign setting saw reported conversions drop 15% to 40% overnight.
And attribution is only the first place cross-channel marketing measurement starts to wobble:
- The same metric can mean different things: One team’s definition of conversion is a form submission; another’s is a qualified lead. Even sophisticated measurement setups struggle here. Interactive Advertising Bureau’s (IAB) 2026 State of Data research found that 60% to 75% of advanced-measurement users see shortcomings in rigor, timeliness, trust, or efficiency. Around half also cited serious concerns about accuracy and data quality.
- The platform settings can skew the numbers: Google notes that Analytics and Google Ads can report different numbers simply because the accounts use different time zones. Further, lookback windows and attribution settings change which conversions appear too. In other words, two reports can be technically correct and still disagree.
- The campaign taxonomy breaks the joins: The same initiative can be classified in different ways by different channels, teams, and agencies. In August 2026, the IAB released Campaign Data Standards 1.0, a framework that works across platforms and campaign management systems.
- The handoffs lose information: IAB also documents disparate IDs, inconsistent data handoffs, and limited interoperability leading to lost data and misattribution. Their 2026 Project Eidos work goes further, identifying signal loss, fragmented data, inconsistent implementation, and limited transparency as root-cause measurement problems.
As IAB CEO David Cohen recently said, “The time for a single-channel fix or a one-off framework has passed.”
And on that note, we come to the burning question of…
How to implement cross-channel analytics in marketing?
If the last section sounds familiar, start upstream of your dashboards.
So what does a trustworthy cross-channel setup need before you start analyzing performance?
| Step | The question to answer | What does it mean? |
|---|---|---|
| Consolidate | Do we have all the relevant data in one place? | Bring channels, accounts, and business data together at a comparable level of detail. |
| Govern | Do those numbers mean the same thing everywhere? | Standardize metric definitions, currencies, time zones, attribution windows, and campaign naming. |
| Analyze | Can we use that shared view to make a decision? | Turn the governed data into dashboards, reports, pacing checks, budget decisions, and AI analysis. |
Step 1: Consolidate
The goal at this step is to get every channel in one place.
For cross-channel reporting, you need enough depth to pull the metrics and dimensions you actually use, plus a way to combine multiple accounts and channels without rebuilding the same spreadsheet every week.
That typically means three things:
- You need to connect the full data set you need: Check the available metrics, dimensions, historical data, refresh cadence, and API limitations.
- You need to aggregate accounts from the same channel: If you manage 25 Meta accounts, for example, you shouldn’t have to inspect 25 separate sources just to answer a portfolio-level question.
- You need to blend channels on a common key: Blend Google Ads spend, Meta spend, and Shopify revenue on a shared key such as Date, and you can finally calculate things the individual platforms can’t give you on their own, like blended CAC or total ROAS across the mix.
On Whatagraph, you can bring data from 60+ marketing platforms into one place using ready-made connectors, plus any custom data you have via spreadsheets. This means you have a single source of truth for all your data.
Ready-made connectors include:
- Paid advertising channels like Google Ads, Meta Ads, and LinkedIn Ads.
- Social media platforms like Instagram, TikTok, and LinkedIn.
- SEO tools like Ahrefs, Semrush, and SE Ranking.
- CRMs like Hubspot, Salesforce, and GoHighLevel.
- eCommerce hubs like bol.com, Shopify, and WooCommerce.
These connectors are built and maintained in-house by our engineers so you never have to babysit them yourself.
From there, Source Groups and Blends handle the latter two.
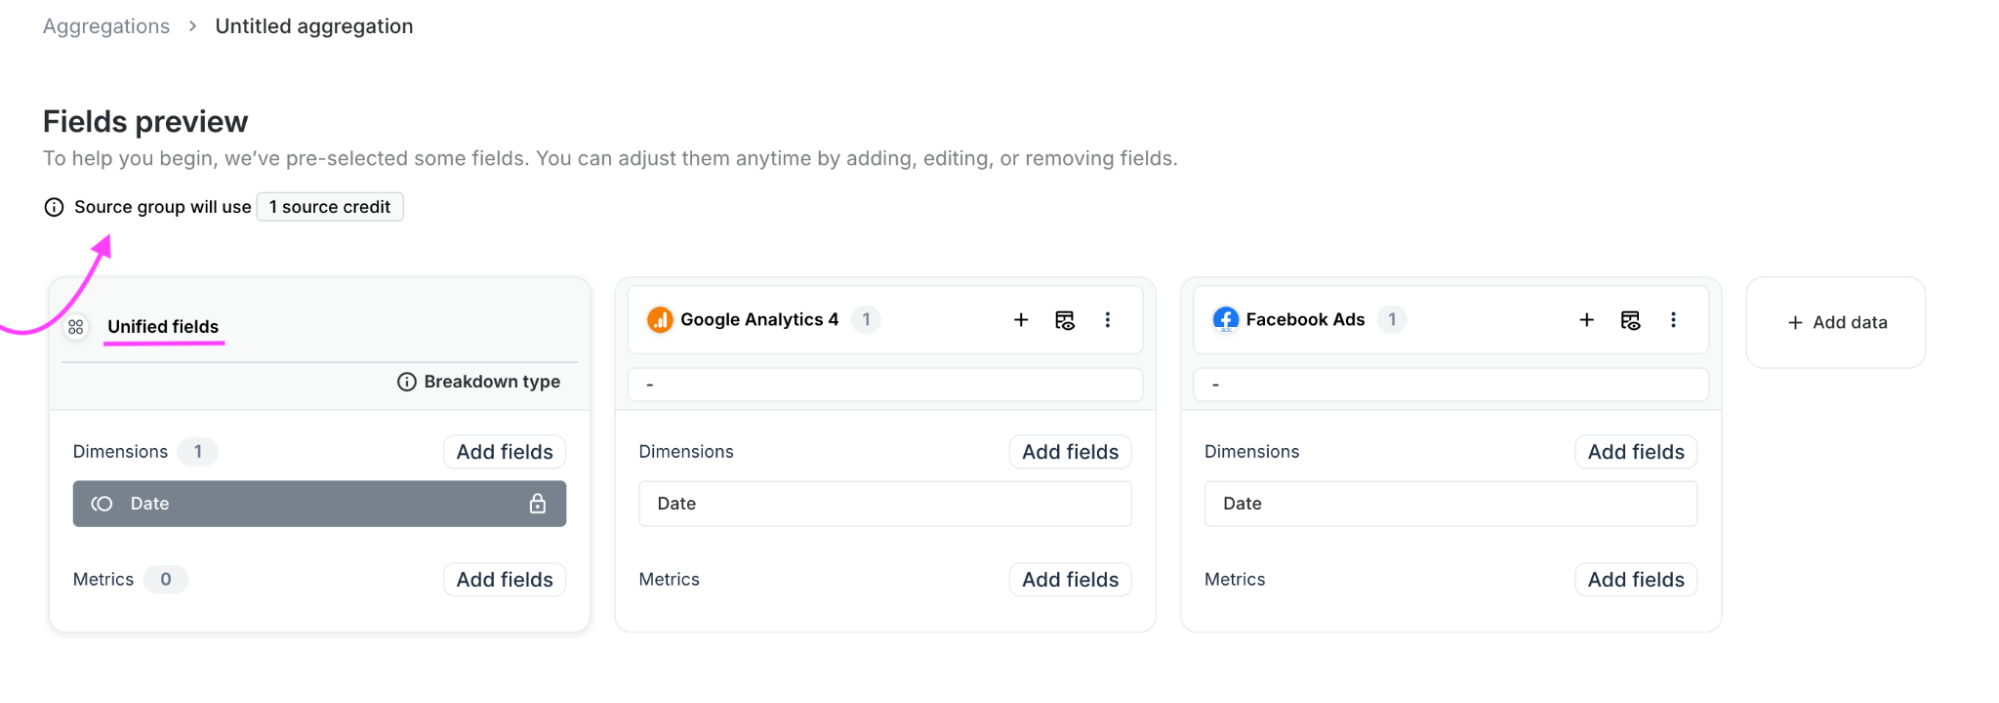
For multiple accounts or sources you want to report on together, create a Source Group. Go to Aggregations > Create New > Blank source group, select the sources you want in the group, and map the fields you want to report on together.
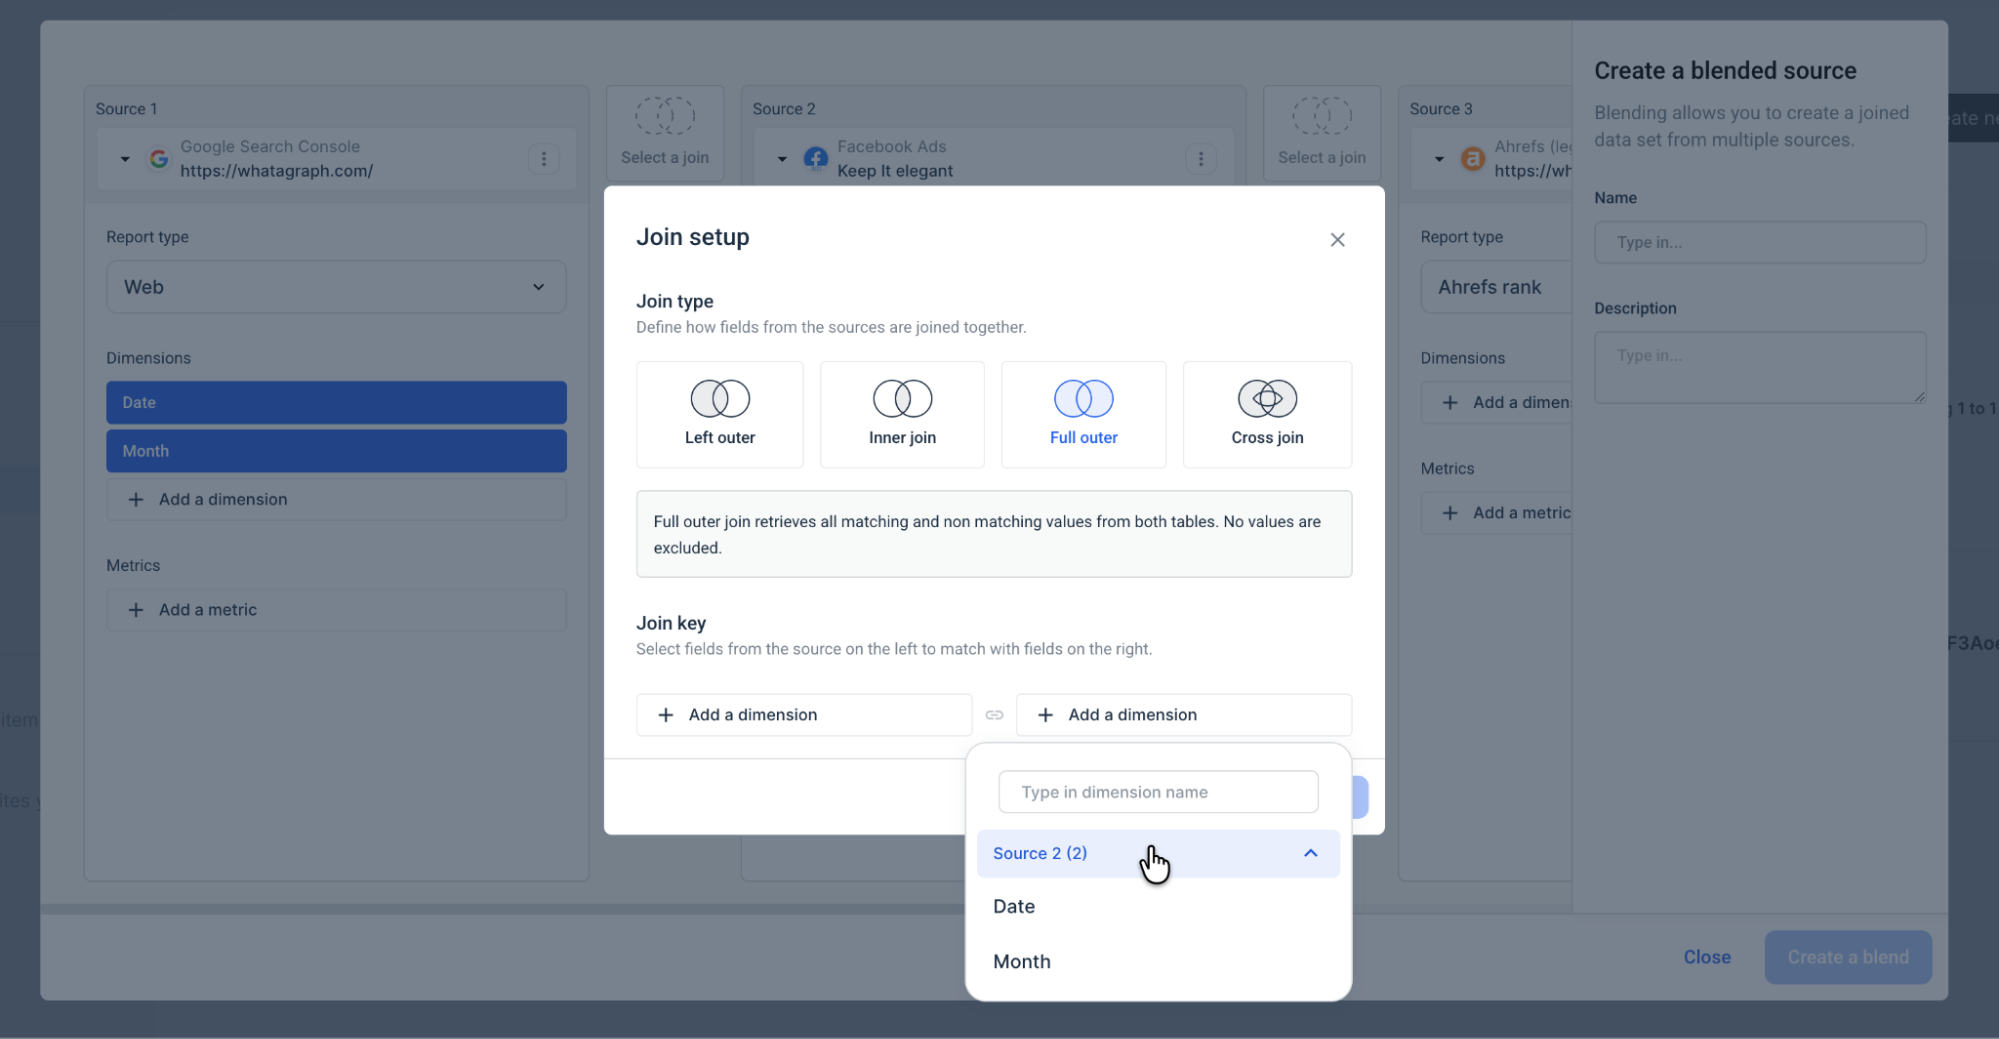
 For data that needs to be joined across sources, create a Blend. Go to Aggregations > Create New > Blended source, then:
- Select the sources you want to combine.
- Choose the metrics and dimensions you need from each.
- Pick a shared dimension, such as Date or Month, as the join key.
- Choose the join type.
- Name the Blend and add it to your report.
That’s what’s happening in the image below. The sources are being matched on a shared Date or Month field before their metrics are brought into the same dataset.
This gets more interesting when you’re not dealing with three sources, but over 5,000, like Rentable does across 215 reports. Their previous reporting setup struggled as the number of locations and data points grew; Whatagraph let them fit hundreds of locations into a single report and break the results down by property, state, or city.
Danielle Roberts, Director of Implementation & Support at Rentable, says:
Whatagraph lets us pull in all the data we need, fit hundreds of locations in one report, and break it down exactly how our customers want.
That’s the first job done: getting the data into a structure where a multi-channel marketing dashboard or cross-channel marketing reporting setup can use it. But now, do all those numbers mean the same thing?
Step 2: Govern
The goal at this step is to govern your metrics so you can trust them.
One of the performance marketers Whatagraph spoke to, inherited three regions reporting differently, with no shared definition of a conversion. Another team put the problem even more plainly: “We don’t trust the data.”
This is where cross-channel marketing measurement needs governance. That means agreeing on the rules once, then applying them everywhere:
- The metrics get one definition: Decide how blended ROAS, CAC, MER, CPL, and other KPIs are calculated, including which spend and conversion sources count.
- The reporting conditions stay consistent: Currency, time zone, and attribution windows need the same treatment wherever that metric appears.
- The naming gets standardized: If Meta calls a campaign UK_PROS_Q3 and Google calls the equivalent PMax-UK-New, your reporting layer needs a common way to classify both.
In Whatagraph, IQ Agents handle everything for you on your behalf.
All you need to do is write a plan-language prompt to an agent, something like:
Combine our Google Ads, Meta, and Shopify sources on Date, then create a blended ROAS metric as total revenue over total spend, and map every prospecting campaign across both ad platforms to one Prospecting label.
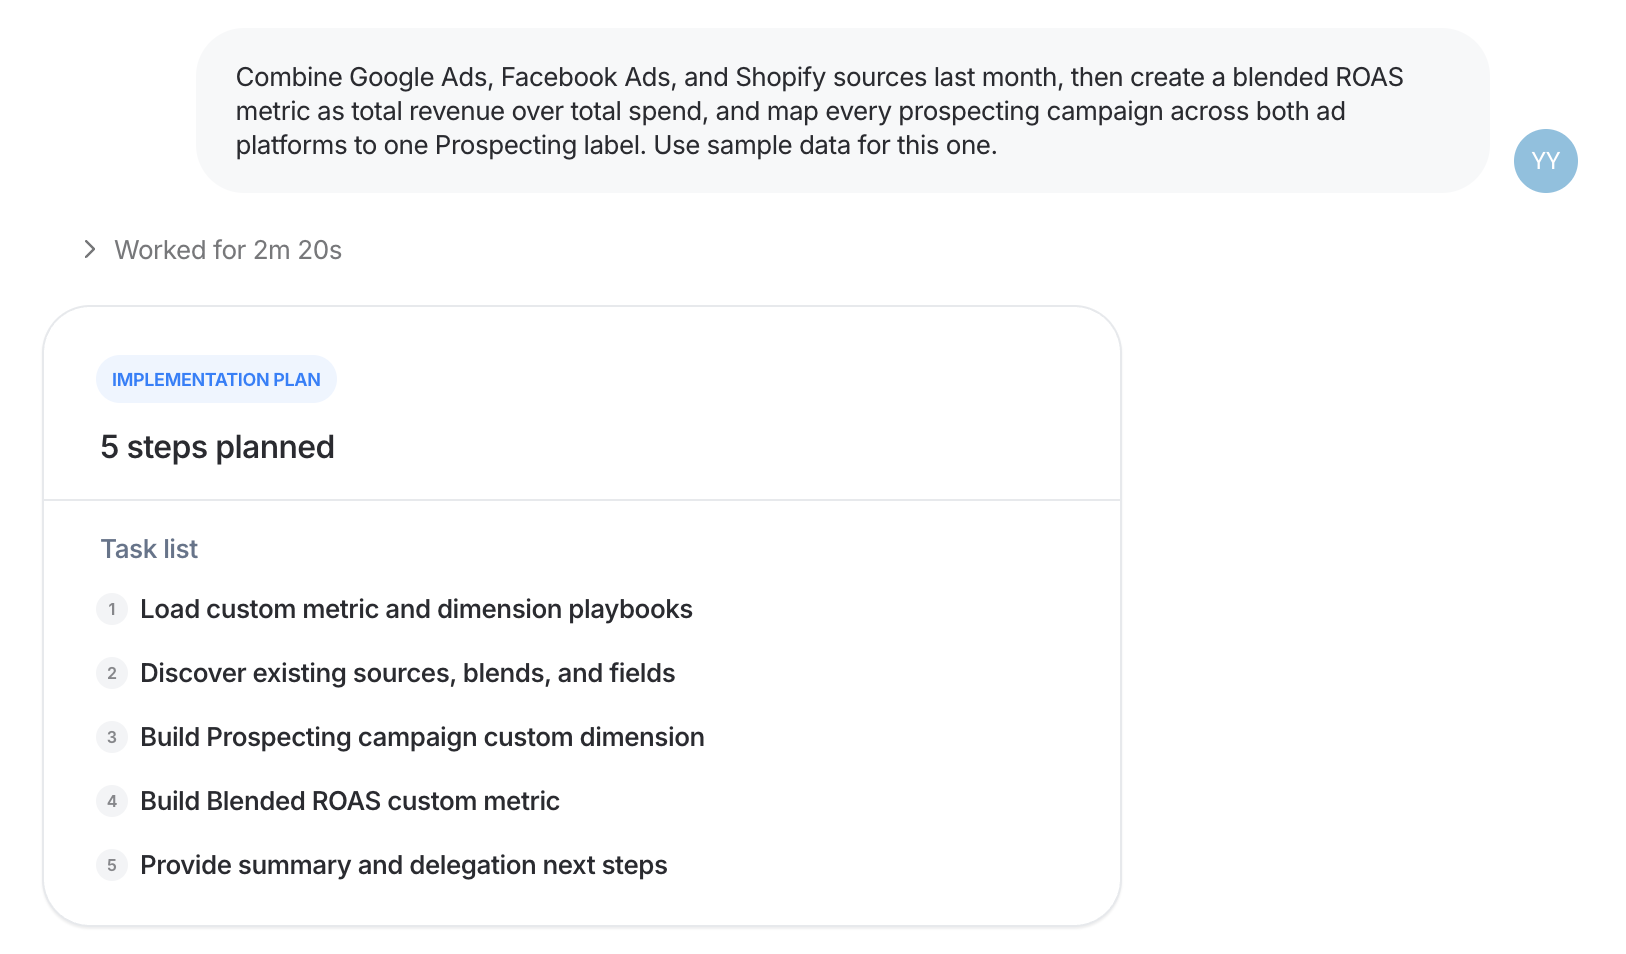 The agent builds it inside the platform, on the same governed layer your reports already read from.
Here’s exactly how that works:
And this is the result:
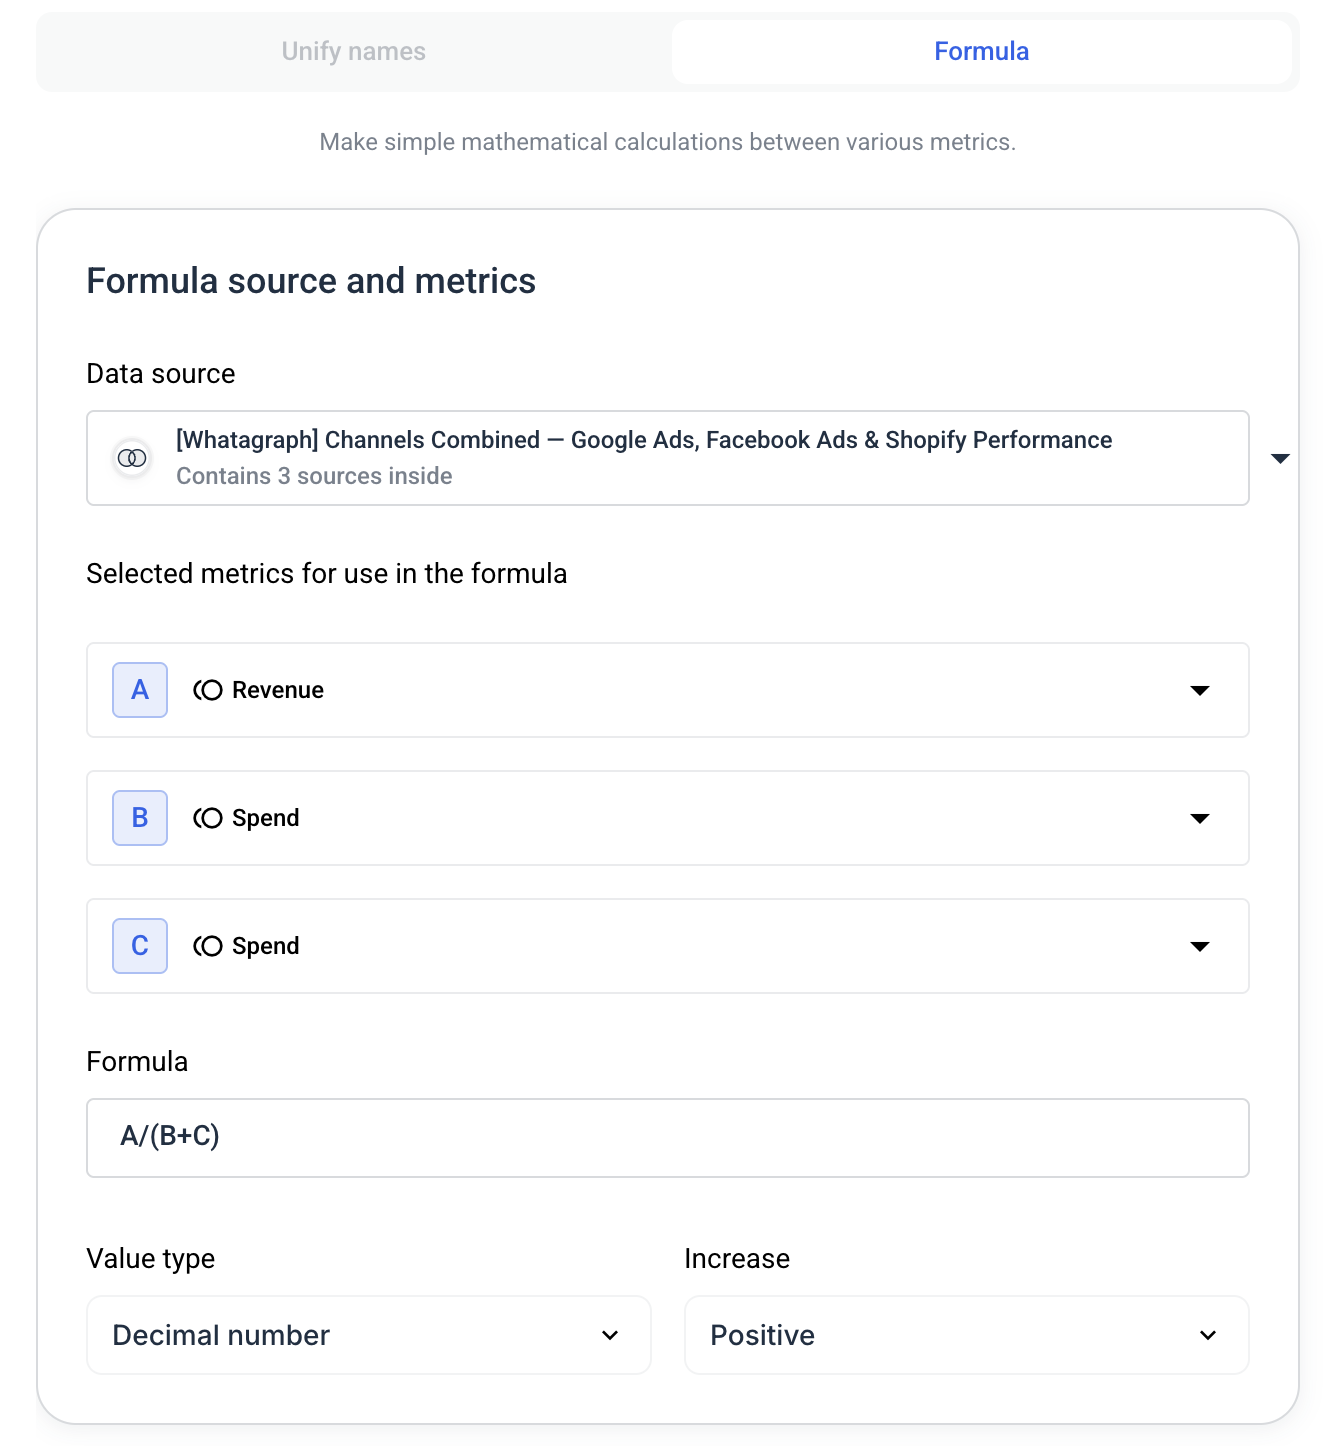
Next, ask the agent to build a fully branded cross-channel marketing report with the exact same custom metrics, dimensions, and blends it created earlier.
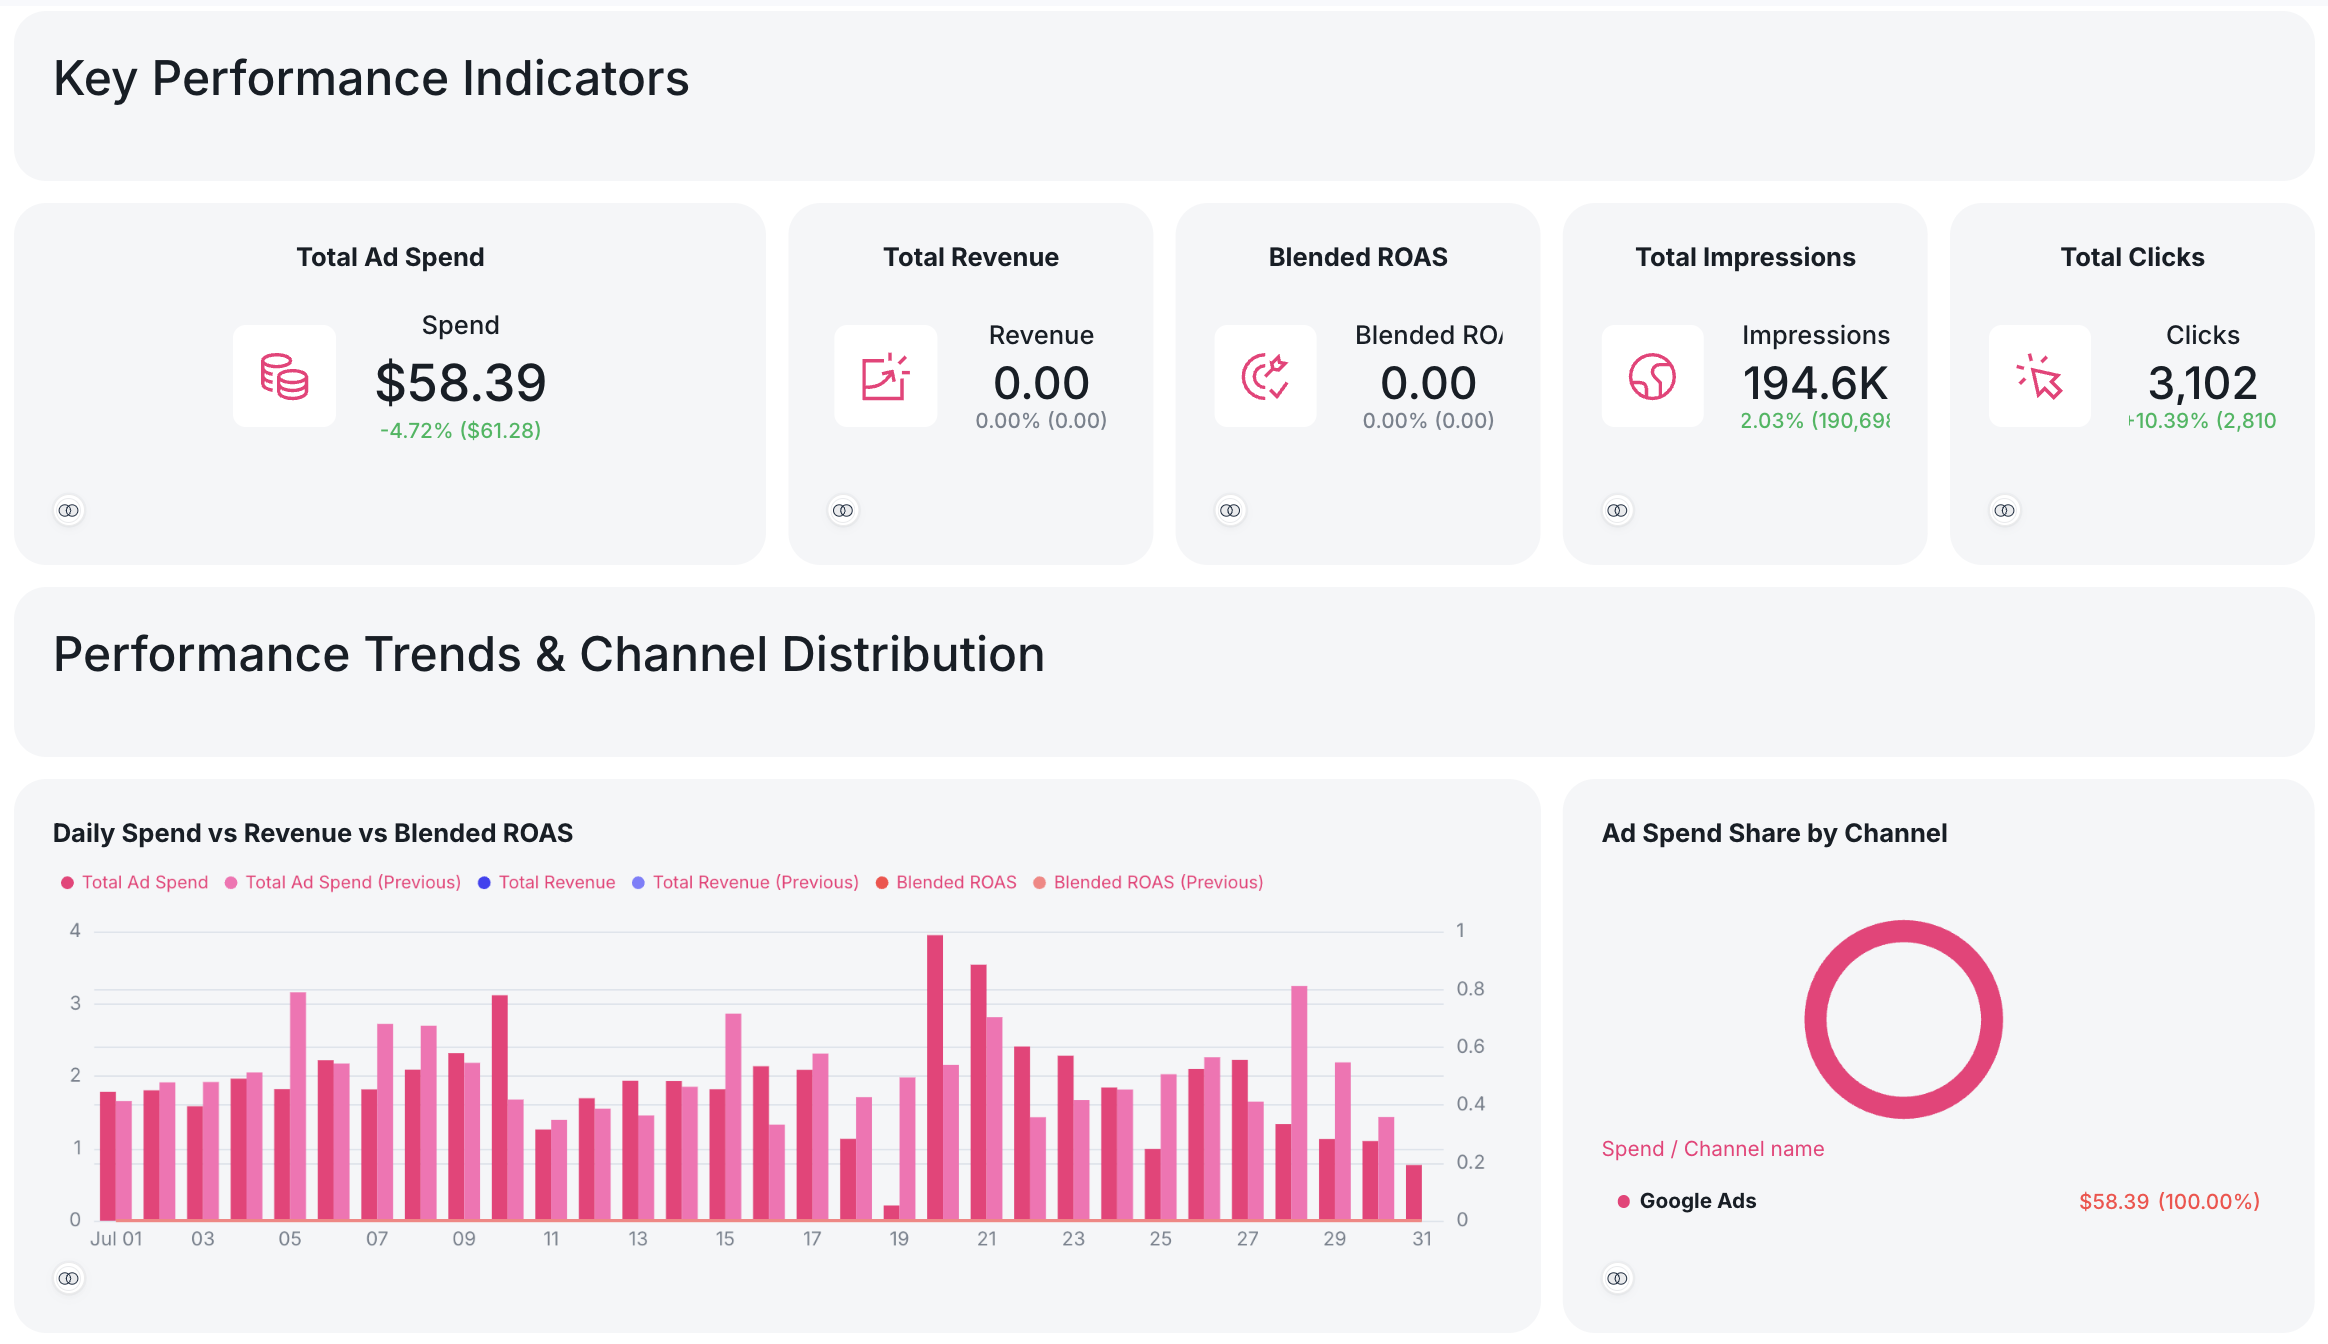
Check out the full report here.
You can then get the agent to:
- Automate the delivery of this report to your client every week or month
- Write an email to your client based on the governed data on the report and your business context
- Set up an alerts system that emails you or sends a message in Slack when performance dips or flies off the charts
The possibilities are endless.
But that’s just the 80% you see. The last 20% is what makes Whatagraph IQ Agents the best for cross-channel analytics.
1. The definitions belong to the organization, not to one person.
Most teams have one person who knows how the numbers are wired. When they're on holiday, that knowledge is on holiday too.
On Whatagraph, configuring an agent isn't saving a prompt for yourself. The agent, its instructions, and everything it knows about a client sit in the platform where the whole team can use it, so the conversion definition you agreed on doesn't get quietly re-litigated in someone's private chat window.
Arturas Lazejevas, CTPO at Whatagraph says:
The agents become part of your organization because they're available across all of the team members. We can multiplayer, meaning you started some conversation, I can step in into that same conversation and add mine. We can even talk to the same agent in the same conversation at the same time.
2. The agents check each other's work.
We don't expect people to get every call right on their own, which is why we have peer reviews and retrospectives. Agents work the same way, except you don't have to ask for it. Arturas says:
One agent can do the work and can be instructed to hand off the work to another agent for it to review, and wait for that review to happen. The other agent can download that report, review the executive decisions, do a different way of verification, even download a PDF to inspect it visually. You can create loops of verifications.
That verification loop runs on the backend, on a schedule, with your laptop closed. You're not prompting it, and you're not building the plumbing that makes it happen.
3. The math isn't improvised.
An agent working across five channels is only as trustworthy as the layer it reads from. This is why the governance work in this step comes first. Here's Arturas again:
The agents are not creating data themselves. You define the business logic, you define the groups, you define the blends, the aggregations, the naming conventions, the dimensions, the metrics, how to calculate this and that. That's defined already in the data layer that agents just call. And those are deterministic. The calculations are deterministic.
So the blended ROAS an agent reports is the blended ROAS in the client PDF, because it's the same Custom Metric. Nothing is being recalculated on the fly in a way you can't audit later.
Now imagine keeping those definitions and metrics straight across more than 300 clients. That’s why Dtch. Digitals uses Whatagraph to standardize reporting across its client base which led to a reduction in client churn by 50%.
Stef Oosterik, Quality Manager at Dtch. Digitals told us:
In Whatagraph, clients can see the total results in one place, without jumping between different sheets or reports. This avoids confusion, especially for those who might not fully understand online marketing.
Step 3: Analyze
The goal at this step is to turn a governed foundation into data-driven decisions.
Once the numbers are governed, the same figures can go anywhere without drifting. The teams we talked to wanted a specific shape for that dashboard. More specifically, a yes or no at the top, with details available underneath for anyone who wants to drill in. A useful cross-channel marketing dashboard should give you the verdict quickly.
That, however, only works if the top-line number and the drill-down numbers are built from the same governed base. The important bit is that the numbers don’t change when you change the format.
The CAC in the internal dashboard should be the CAC in the client report because both are querying the same governed definition. That gives your cross-channel marketing analytics a safe place to land, one where the numbers in your internal decks match the branded PDFs you email to your clients.
Let AI read the governed version, too
AI makes the provenance of the number even more important. The paid media leads we talked to wanted the same thing from AI: not authorship, but speed. They'll use it to get to an answer faster, but almost none of them will let it draft the summary that goes to a client, because an AI is only as reliable as whatever it's reading.
The appetite for this is already there. In the Marketing AI Institute’s 2025 survey, 82% of marketers said their primary goal for AI was cutting the time spent on repetitive, data-driven tasks.
But point an LLM at your raw platform APIs and ask a cross-channel question, and it has to reconcile metric definitions that don't match and convert currency on the fly. It'll do all of that, and it'll do it inconsistently, so the same question asked two different ways can come back with two different answers. That’s not a hallucination; it’s the AI faithfully reporting on data that was never reconciled to begin with.
Ask the same question of a governed foundation, and there's nothing left to reconcile.
With Whatagraph MCP, the hard decisions have already been made upstream. The AI reads the same Blends, Source Groups, and Custom Metrics that power your reports.
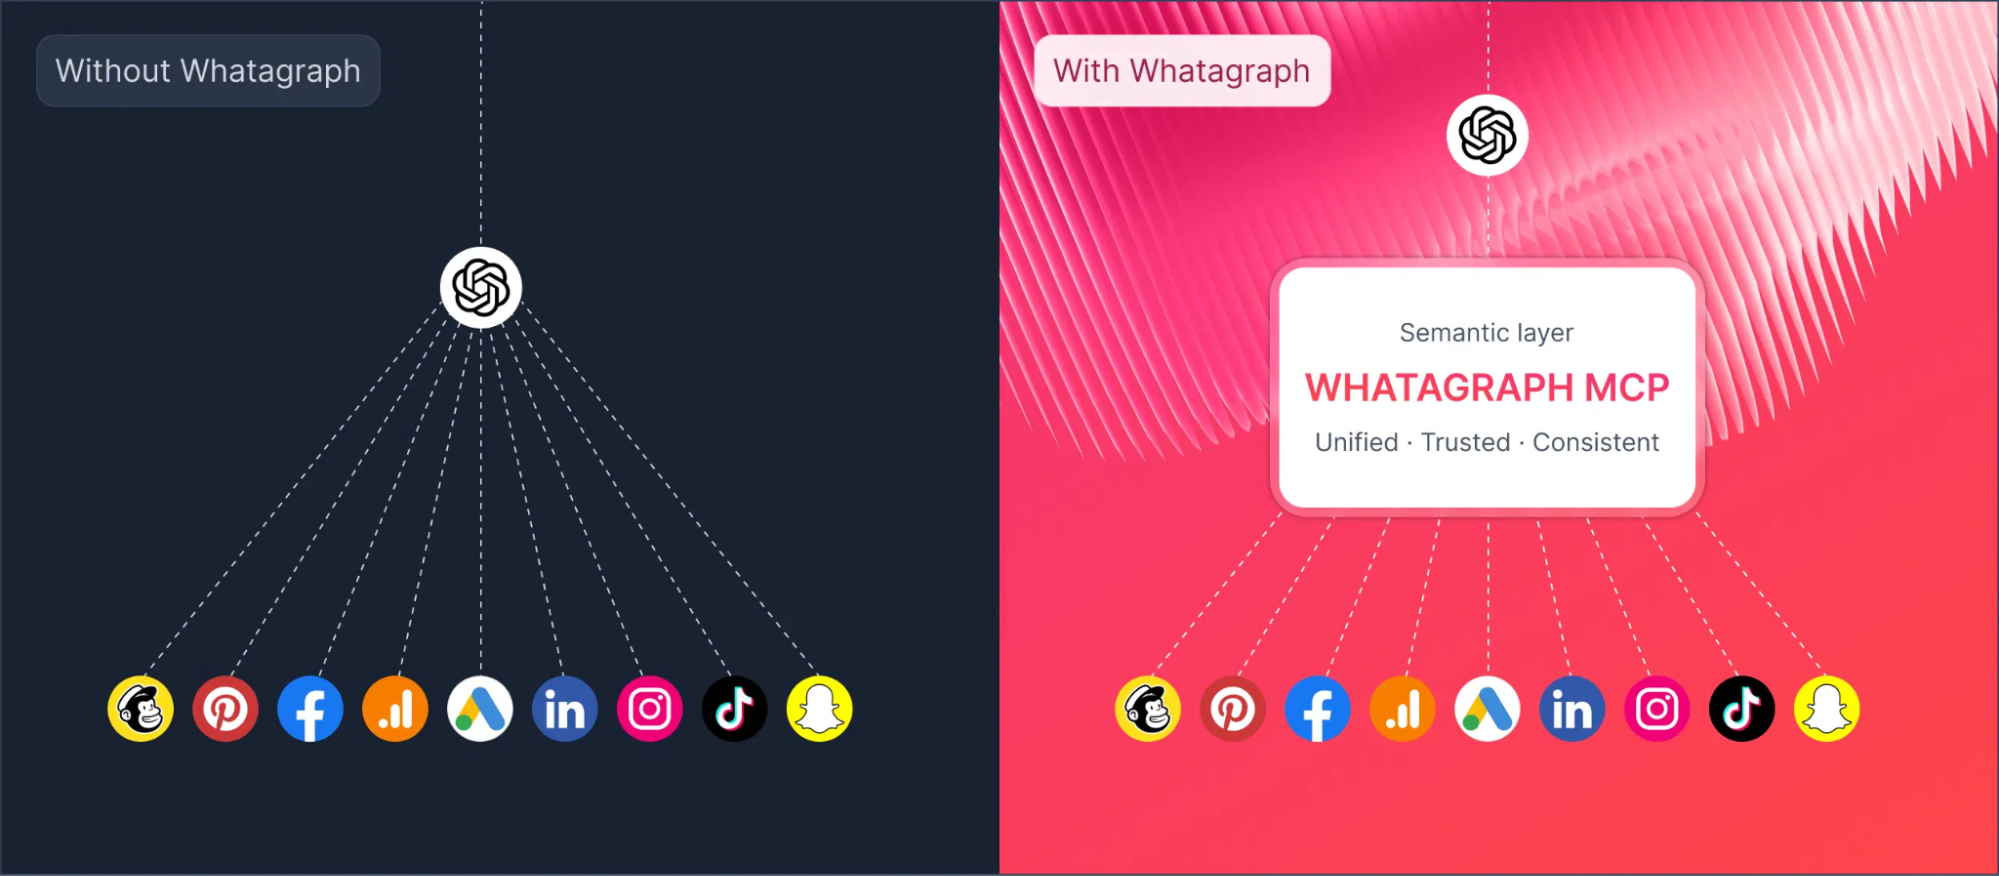
Inside Whatagraph, IQ Chat can answer questions about connected marketing data and return the result as a number, table, or short explanation. For example:
“Which channel gained the most spend without a matching increase in revenue?”
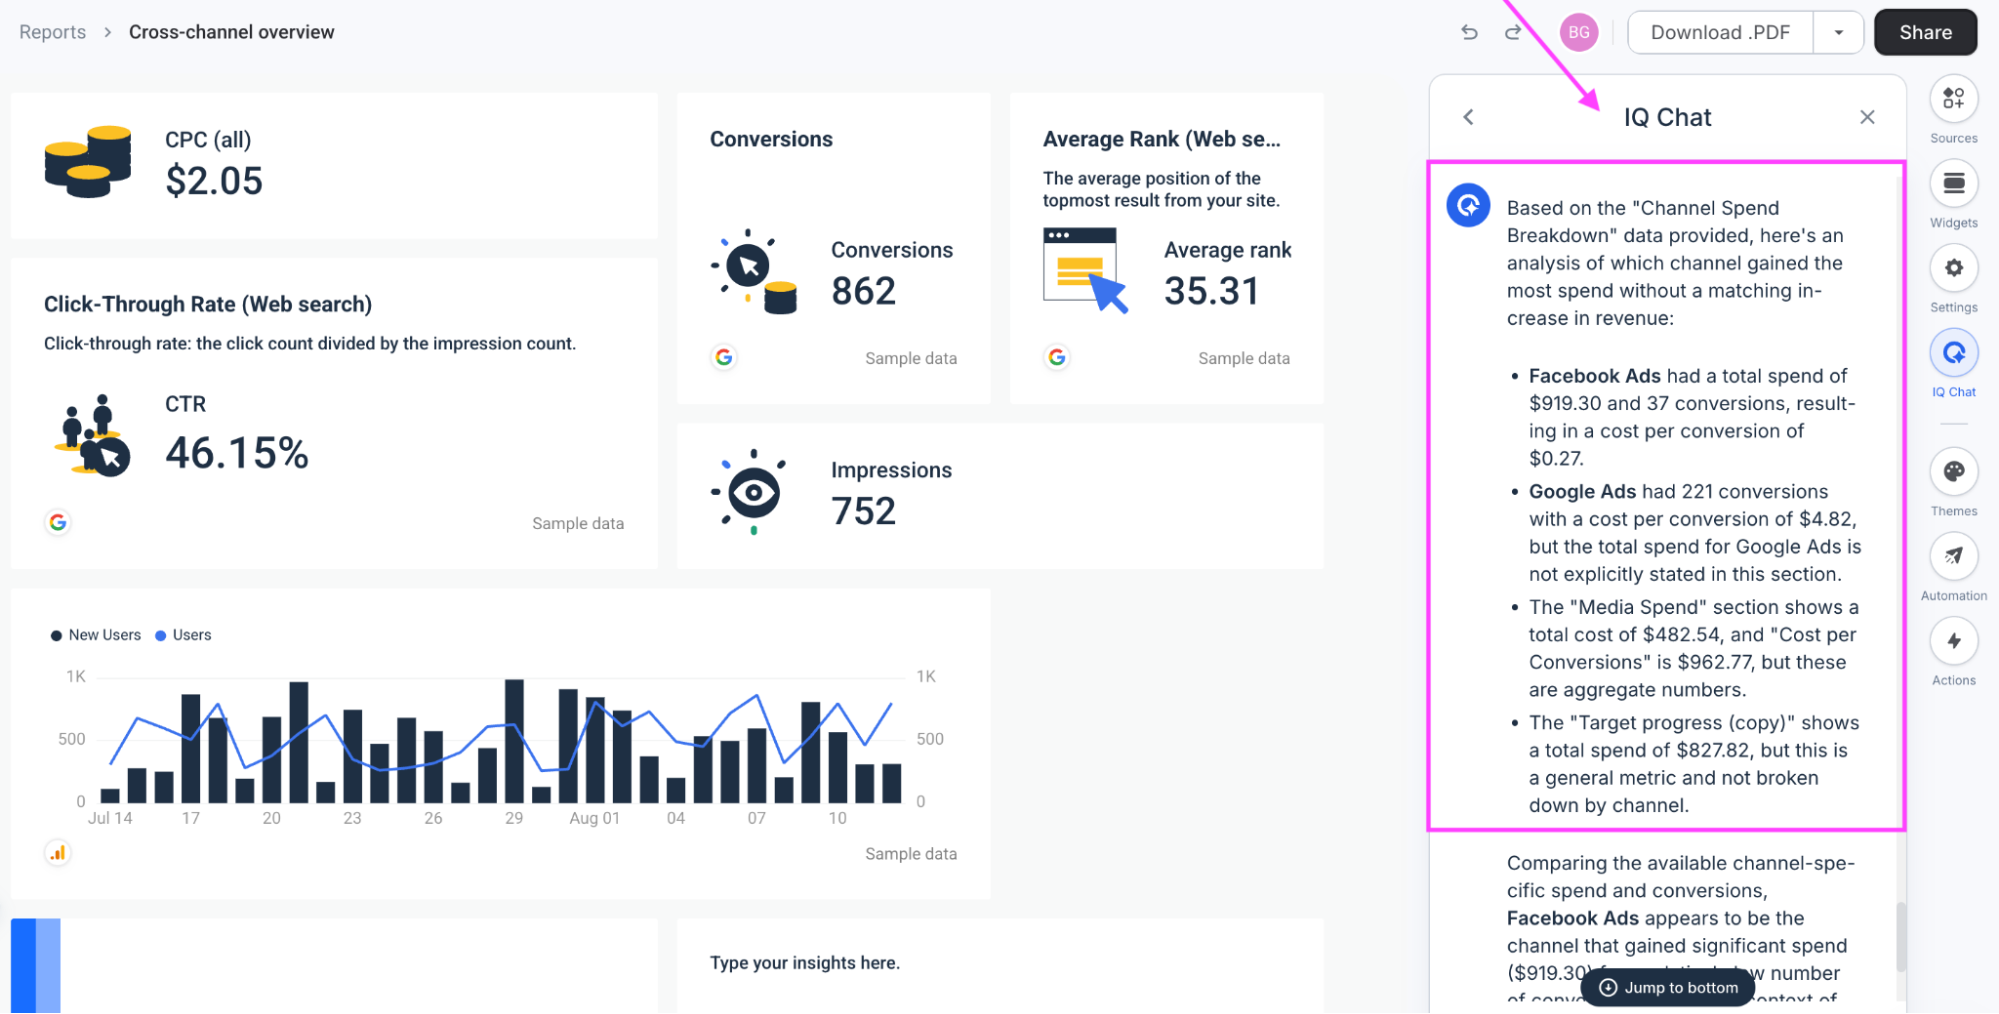
Maatwerk Online got an early taste of what this looks like. As one of the first agencies to test Whatagraph IQ, the team started using IQ Chat in client meetings to answer follow-up questions on the spot. The agency now saves more than 100 hours a month on reporting overall.
Here’s Lars Maat, Co-Founder at Maatwerk Online, raving about Whatagraph IQ Chat in his own words:
Whatagraph MCP takes the same idea outside the platform, making Whatagraph account data available to AI assistants including Claude and ChatGPT. Once connected, it has read access to sources, metrics, Blends, Source Groups, report structure, and account health, so you can ask the same kinds of cross-channel questions without opening each platform separately.
Get a demo to see Whatagraph in action.
Why is cross-channel analytics important for your agency?
Once spend, revenue, and conversions are comparable across channels, you have a much better basis for deciding what’s working and where budget should go next.
- You can see what the individual dashboards hide: Only 32% of marketers globally measure media spend holistically across digital and traditional channels, according to Nielsen’s 2025 Annual Marketing Report. A cross-channel reporting view gives you the total spend, revenue, and results before you start judging any one channel.
- You can put each platform’s version of events in context: More than 60% of advertisers in WFA’s 2026 research called “walled gardens” a severe or critical measurement challenge. While cross-channel analytics won’t magically solve attribution, it does, however, give you a common base for comparing contribution.
- You can move money with better evidence. WFA and Ebiquity also found that three-quarters of advertisers expect more than half of their budget decisions to become measurement-led within three years, yet only 15% say effectiveness evidence is the primary driver today. A blended ROAS, CAC, and MER gives you a better basis for deciding where the next dollar goes.
- You get closer to what’s performing: Nielsen says the volume and incomparability of cross-media data remain major barriers to calculating ROI. Their research points to “integrated analysis” as a way to identify which channel combinations and creatives are contributing to results.
And increasingly, that foundation determines what you can do with AI too. As EMARKETER analyst Yory Wurmser says, “If you have that ability where everything is connected and everything is well defined on the base level, then you can move a lot quicker.”
None of this holds if the numbers underneath don't reconcile. That's one of the next problems.
The key metrics to track for successful cross-channel analytics
These are the numbers a paid media lead watches week to week. And each comes with the cross-channel trap that breaks it if you're not careful.
- Blended return on ad spend (ROAS), blended customer acquisition cost (CAC), and marketing efficiency ratio (MER): These tell you what the whole media mix is returning. But these are ratio metrics, and ratio metrics can't be averaged across platforms. You have to total revenue and total spend, then divide, not average each platform's individual ROAS. For example, Google Ads ecommerce ran a 3.31 median ROAS in 2025, Meta a 1.86 median, per Triple Whale.
- Cost per result, like cost per lead (CPL) or cost per acquisition (CPA), normalized to one conversion definition: This tells you what you’re paying for the outcome you’ve agreed counts. But “lead” doesn't mean the same thing on two platforms, let alone five. The median CPL across 13,474 US search campaigns was $66.69, and Meta lead campaigns averaged $27.66 in WordStream’s 2025 dataset.
- Spend and pacing: Track actual spend against plan at both portfolio and channel level, then watch where the variance is coming from. Your benchmark here is primarily your own budget. But portfolio-level pacing can look perfectly healthy while one channel is wildly overspending and another sits untouched.
- Contribution and share of spend and results, by channel: Compare each channel’s share of spend with its share of results, revenue, or new customers. Here, cost efficiency looks completely different depending on what you're measuring. In B2B, LinkedIn's cost per company influenced runs $80.63, cheaper than Meta's $148.01 and Google Search's $126.93. So if you judge LinkedIn on cost per click, it looks like your most expensive channel. But if you judge it on cost per company reached, it's your cheapest.
- New vs. returning customers: This metric measures whether you're acquiring new customers, or just re-monetizing people who were going to buy anyway. Your blended ROAS can look great even when new-customer ROAS lags behind. The category context changes this metric dramatically, too. Decile’s Q1 2025 ecommerce benchmarks put the new-to-returning customer ratio at 2.48 for home goods and 1.33 for fashion, while supplements and food and beverage were below 1, meaning returning customers outnumbered new ones.
The big cross-channel trap is averaging ratios that were calculated on different underlying totals. In Whatagraph, these are the kinds of calculations you can define once as Custom Metrics, so the benchmark may change, but the metric you’re comparing against it doesn’t.
Get our fresh, data-backed 100+ PPC benchmarks for 2026.
The top 4 tools for cross-channel analytics in 2026
In the spirit of full disclosure: one of the tools below is ours. But the four tools solve different parts of the cross-channel problem, so the right choice depends on which piece is causing you grief.
| Tool | Best for… | Does it support cross-channel blending? | Does it have a data governance layer? | What’s the starting price? |
|---|---|---|---|---|
| Whatagraph | Agency and performance reporting from one governed dataset. | Yes, with native Blends and Source Groups. | Yes; you get Custom Metrics, Dimensions, transformations, currency conversion, and storage. | Whatagraph's pricing scales with your needs. Check out the official pricing page for more details. |
| Google Analytics 4 | Google-centric acquisition and attribution analysis. | Limited; supports cross-channel conversion reporting and some non-Google campaign integrations, but not arbitrary marketing-data blending. | Limited; attribution and channel settings, rather than a dedicated governance layer. | Free; Analytics 360 uses enterprise pricing. |
| Looker Studio + Supermetrics | Flexible, build-it-yourself dashboards. | Yes; Supermetrics can blend and transform marketing data before or alongside visualization in Looker Studio. | Partial; Supermetrics provides transformations, storage, and governance controls, but the setup remains split across the stack. | $44/month for Supermetrics Starter, billed annually; Looker Studio is free. |
| Improvado | Enterprise data infrastructure and advanced measurement. | Yes; built around multi-source extraction, transformation, and analysis. | Yes, but only on Advanced+; includes governance rules and Marketing Data Governance. | $0 limited; $100/month MCP Only; Advanced and Enterprise are custom priced. |
Whether this leads you to Whatagraph or another tool entirely, we’re here to help you make the best decision possible for you.
1. Whatagraph: Best for governed cross-channel reporting and analysis
Whatagraph is the tool of choice for when you don't just want every channel in one place; you want the number in that view to match what your AI tool says when someone asks about it later.
The Data Hub does the work upstream. You can bring together data from 60+ sources, use Blends and Source Groups to combine it, then standardize the result with Custom Metrics and Dimensions. That governed layer feeds the reports, dashboards, IQ analysis, and IQ Agents connected through Whatagraph MCP.
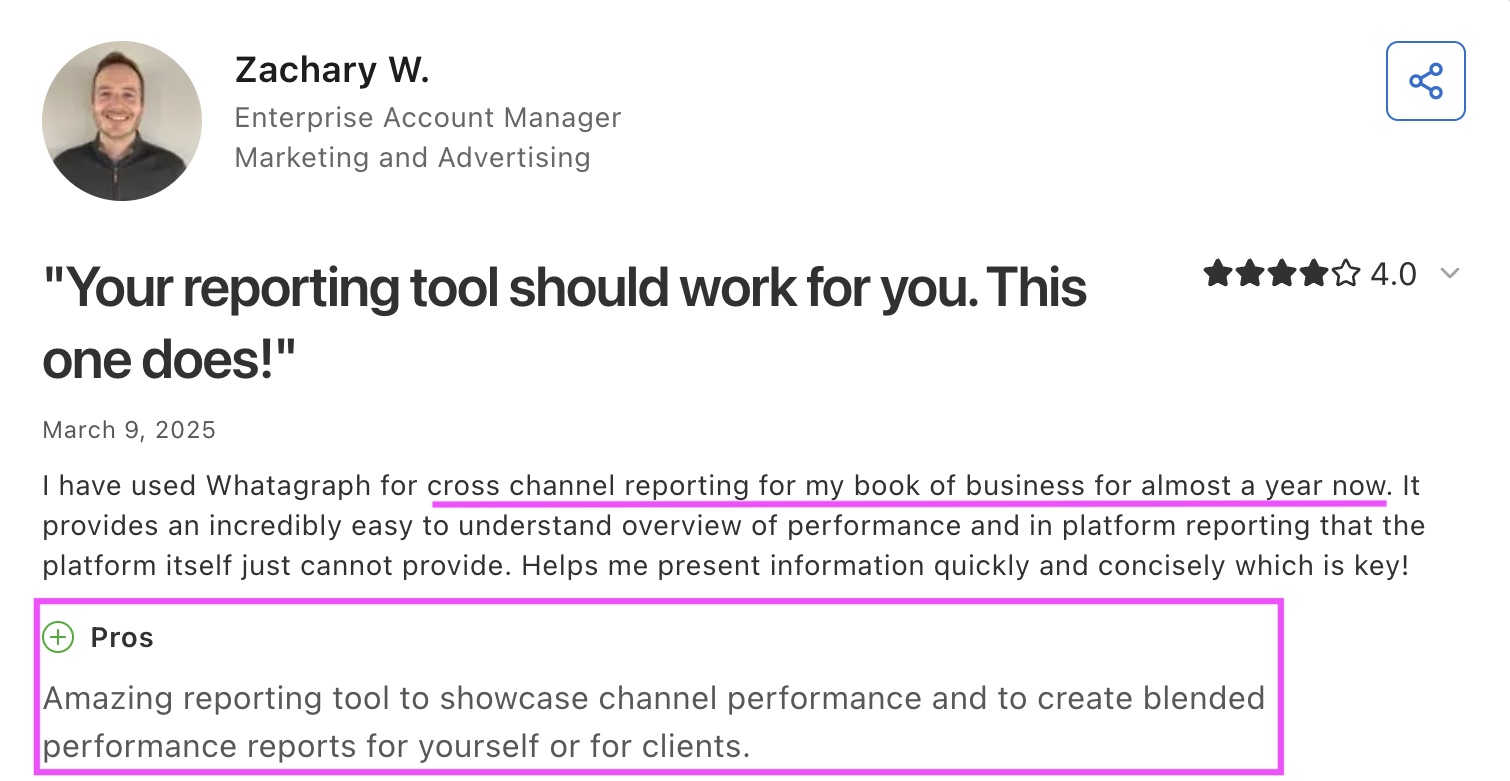
For cross-channel analysis specifically, happy clients like Zachary W. praise Whatagraph’s blended performance reports:
You can define ROAS or CAC once, clean up inconsistent campaign naming, and have the same definition follow the data into the client report and the AI chat.
Pricing: Whatagraph's pricing scales with your needs. Check out the official pricing page for more details.
Who is Whatagraph not for? If you’re a boutique agency and only need to monitor one or two channels and don’t need to blend or govern the data, this is probably more horsepower than you’ll need.
2. Google Analytics 4 (GA4): Best for cross-channel analysis inside the Google ecosystem
GA4 is free, and it's the deepest look you'll get at anything happening inside Google's own ecosystem. Search, YouTube, Display, all read from the same account without extra setup. The platform tracks web and app behavior, and includes attribution reporting plus a newer cross-channel budgeting feature for paid media planning.
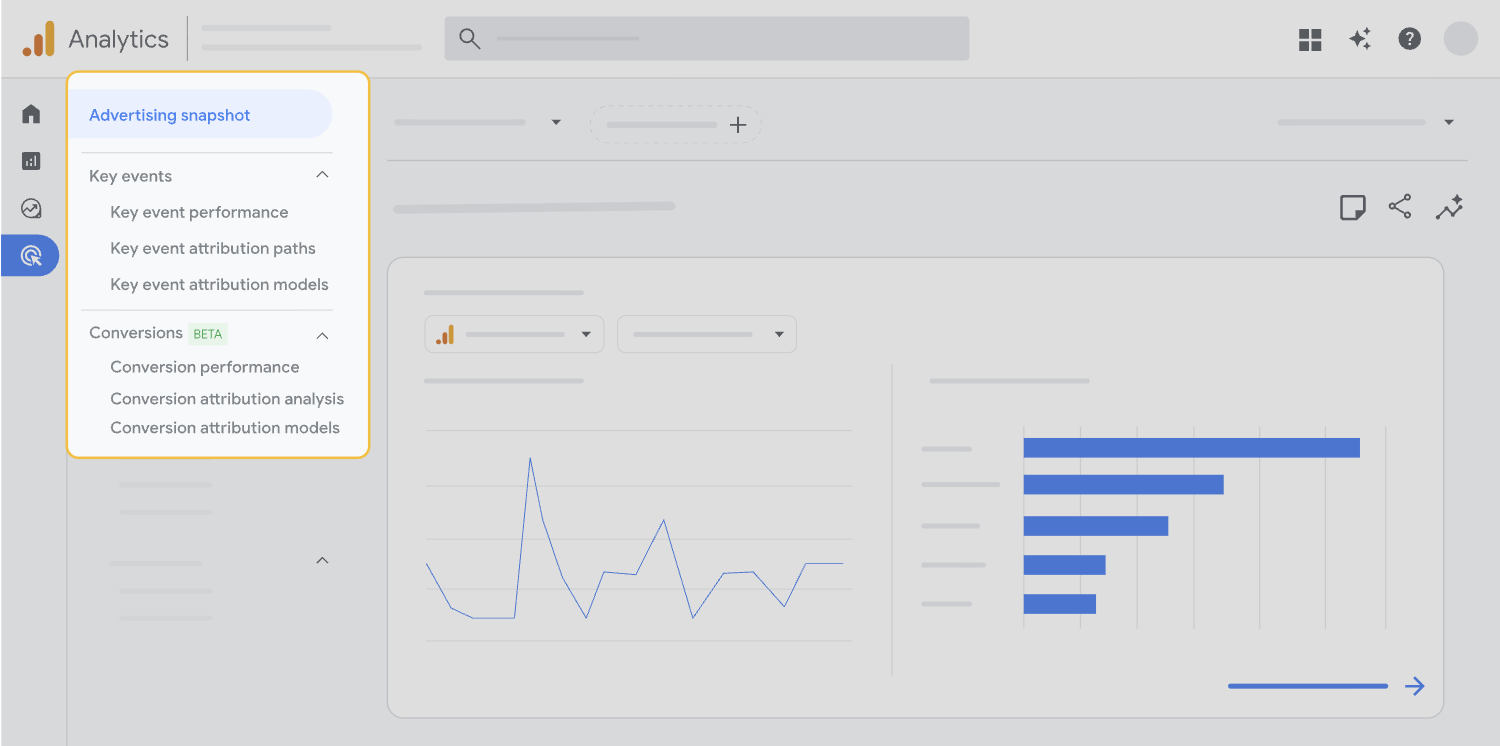
Source: Google Support
For teams that mainly need to understand acquisition and conversion behavior, that'll get you pretty far.
Pricing: Free; Analytics 360 is the enterprise version and uses sales-led/custom pricing.
Who is GA4 not for? GA4 can surface data from beyond Google, but the deeper blending and normalization work usually has to happen elsewhere, which means your unified dashboard is then split across two or more tools. There are technical limits too. For example, sampling can kick in when explorations process more events than the property quota allows, and the Data API has its own token and request quotas.
3. Looker Studio + Supermetrics: Best for flexible DIY reporting
Looker Studio is free and easy to share, while Supermetrics gives it access to marketing data beyond Google’s native connectors. The familiarity of the G Suite is why a lot of reviewers, like Pablo F., like Looker Studio, whereas reviewers like Moe A. appreciate Supermetrics for its ability to pull ad data cleanly into a dashboard.
For teams that want maximum control and don’t mind owning the plumbing, Looker Studio paired with Supermetrics is a capable combination.
But this is a stack, not a standalone platform, which means the seams are your problem.
At Peak Seven, that meant over 40 hours per report, Looker Studio going down mid-build, and filters or field mappings breaking without warning. A chunk of the team's week went to triple-checking numbers against Supermetrics and Meta.
Peak Seven was spending about four hours per report before switching to Whatagraph, compared with 1.5 hours or less afterward, saving 63 reporting hours a month.
Pricing: Looker Studio itself is free; that's the free half of this stack. Supermetrics costs start at Starter, which runs $44/month billed annually, or $55 month-to-month.
Who is Looker Studio + Supermetrics not for? This combination is not for reporting across more than a handful of clients or channels, where someone has to own the connector maintenance and reconciliation work full-time. We don’t believe in giving you half-cooked information, and neither do we want just this snippet to put you off these platforms completely. Read my first-hand review of Looker Studio and an honest Supermetrics walkthrough.
4. Improvado: Best for enterprise data infrastructure and advanced measurement
Improvado is an ETL tool that connects 1,000+ sources, centralizes and transforms marketing data, and adds governance before handing that data off for analysis. The platform’s AI Agent can query cross-channel performance, build dashboards, and work with prepared MTA and MMM datasets too.
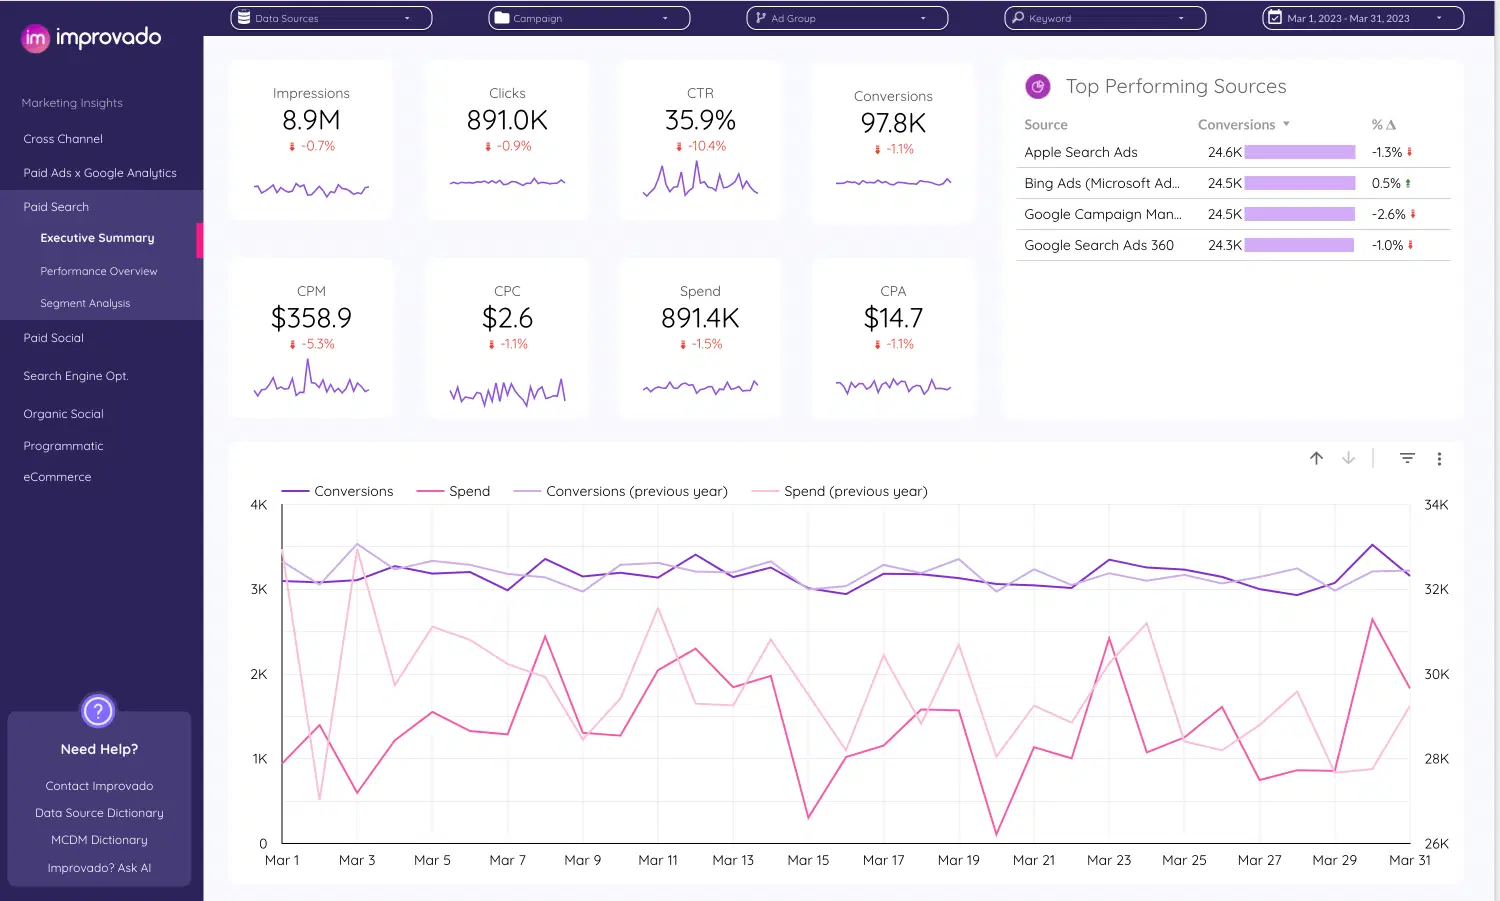
But Improvado doesn't ship client-ready dashboards or reports on its own, so the answer still hands off to Looker Studio or Tableau for anything you'd show a client. For example, the two most recent reviews on G2 say that Improvado’s dashboards can’t help them gather the insights they need, and that there’s a “heavy technological lift” to get it going.
Pricing: Free limited plan; $100/month for MCP Only. Advanced and Enterprise use custom pricing.
Who is Improvado not for? If your problem is getting reliable reports out the door rather than building sophisticated data infrastructure, Improvado may be more platform than you need. Read my in-depth review of Improvado to get the full lowdown.
The future of cross-channel analytics in digital marketing
For all the talk of agentic marketing, a surprising amount of cross-channel analytics still depends on a human noticing that a connector's broken. IAB’s 2026 State of Data report says AI is raising expectations for faster, more decision-ready measurement at the same time fragmented data environments are making that measurement harder.
The direction of travel has a name. PegacornCRM's Agentic Marketing Maturity Model lays out three working stages:
- AI-assisted, where tools speed up a task but the marketer still drives.
- Agentic, where autonomous agents pursue a goal across multiple steps while a person sets the strategy and guardrails.
- Autonomous, where agents operate with minimal oversight and humans review the aggregate result.
For cross-channel teams, AI agents can increasingly take on the work around the dashboard, like connecting a source, applying an existing taxonomy, assembling the reporting structure, and watching for changes that need a human’s attention.
There’s a fairly large catch before that becomes reality, though. Adobe found that only 44% of organizations consider their data quality and accessibility adequate for AI, while 75% cite data integration and quality as a top obstacle to implementing agentic AI.
Deloitte finds the same readiness gap from another angle: 74% of organizations expect to use AI agents at least moderately by 2027, but only 21% currently have mature agent-governance models.
👉 Is your marketing data ready for AI? Find out in this 1-minute quiz.
That gives cross-channel analytics a clear maturity path. AI starts by assisting with the read, then marketers direct it through individual jobs. Eventually, more of the repetitive preparation and monitoring can be delegated, with humans defining the rules and handling the decisions that need judgment.
As Salesforce’s Bobby Jania says, “Every marketer has access to the same AI models. So what separates the winners? Relevant context.” Salesforce’s 2026 State of Marketing report found that teams satisfied with their unified data are already 60% more likely to use AI agents.
So the future is AI doing the work on top of a foundation someone already made trustworthy, with a person still signing off on anything that reaches a client. Whatagraph's move in that direction is IQ Agents, an always-on layer that builds and watches on top of the same governed foundation we’ve been harping on about thus far.
IQ Agents is in early access, opening by cohort. Request early access here.
Published on Aug 24 2026
WRITTEN BY
Brinda GulatiBrinda Gulati is a fractional content marketer and freelance writer who specializes in data-driven storytelling and writing easy-to-understand, informative content for humans. She has two degrees in Creative Writing from the University of Warwick, and believes that above all, stories are a deeply human endeavor. She has two dogs, knows thrifting spots, and loves afternoon naps.