


What is PPC benchmarking and how can agents help?
PPC benchmarking means comparing your paid campaigns' results with the average results for the same platform and industry. It tells you whether a number for a campaign is good or bad, because a 4% click-through rate means nothing on its own. Google's own help page says a good CTR "is relative to what you're advertising and on which networks" (Google Ads Help).
Agencies feel this most with new campaigns, before there's any history to compare against. An agency that runs campaigns for hotels and resorts said:
"especially in the first month of a campaign, when all we can say is the CTR was X, if we can also quickly pull in an industry standard to say this is good or bad based on that, that would be helpful."
The time-consuming part about benchmarking is gathering the data, and that’s where AI agents come in.
Agents can autonomously look up industry benchmarks in live search for any industry or even collect benchmarks from other similar campaigns you’ve launched before. They can also do this on a schedule (e.g. every month) so your benchmark data is always up to date.
But just having the benchmarks data doesn’t mean anything if you don’t compare it with your actual numbers. Whatagraph IQ Agents can not only research and compile benchmarks but also compare it side-by-side with your actual numbers in your reports.
Radar, the pre-made market intelligence agent in Whatagraph IQ, researches benchmarks for an industry on the web. It confirms the industry and the metrics before it starts if the request isn't clear. Then it puts the actual numbers vs. the benchmark numbers side-by-side in a table, also showing “variance” and even writing the first draft of commentary on where you’re winning and areas for improvement.
You can also build a custom PPC benchmarking agent for the same job.
For instance, here’s what the Whatagraph agent pulled together after we asked it to “look for beverage industry benchmarks” in less than 2 minutes:
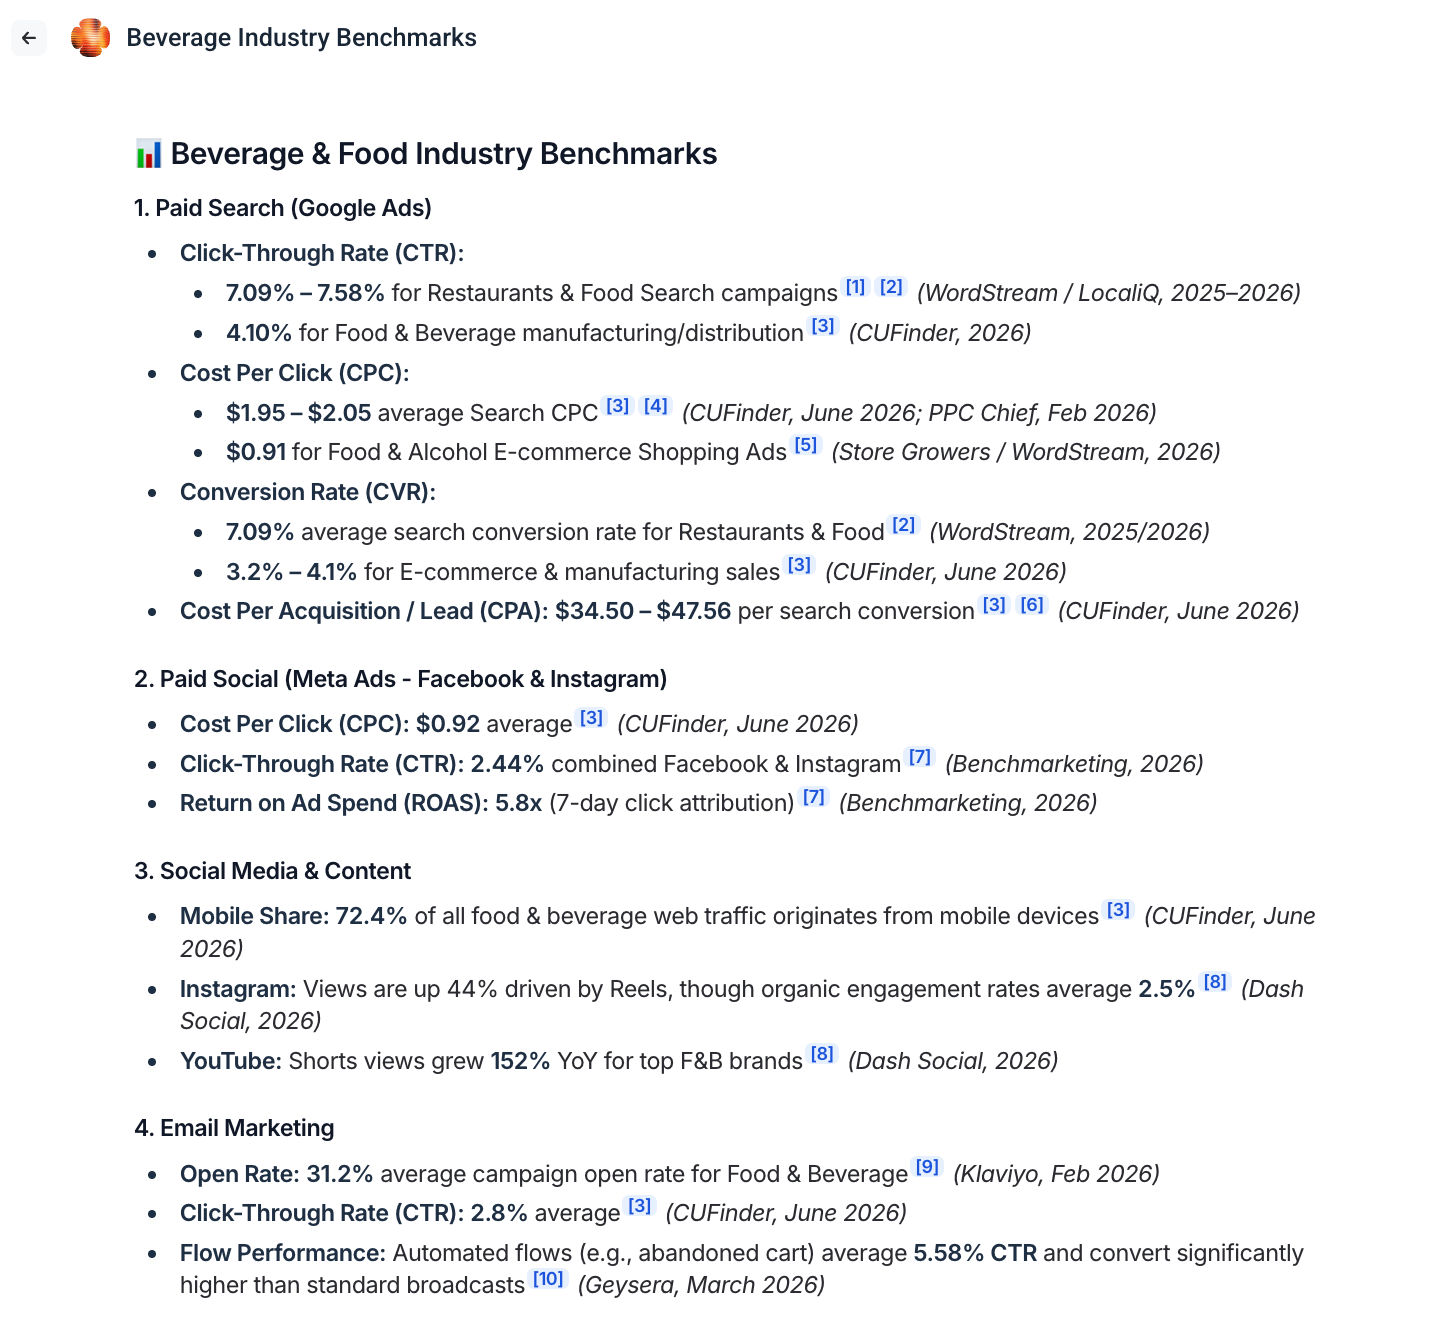
The agent then put the benchmarks together in a report and returned it after 4 minutes. The report includes:
- An executive summary tab
- Benchmarks for each category (paid search, paid social, email & web traffic)
- Actuals vs. benchmarks
- A short commentary that you can fully adjust
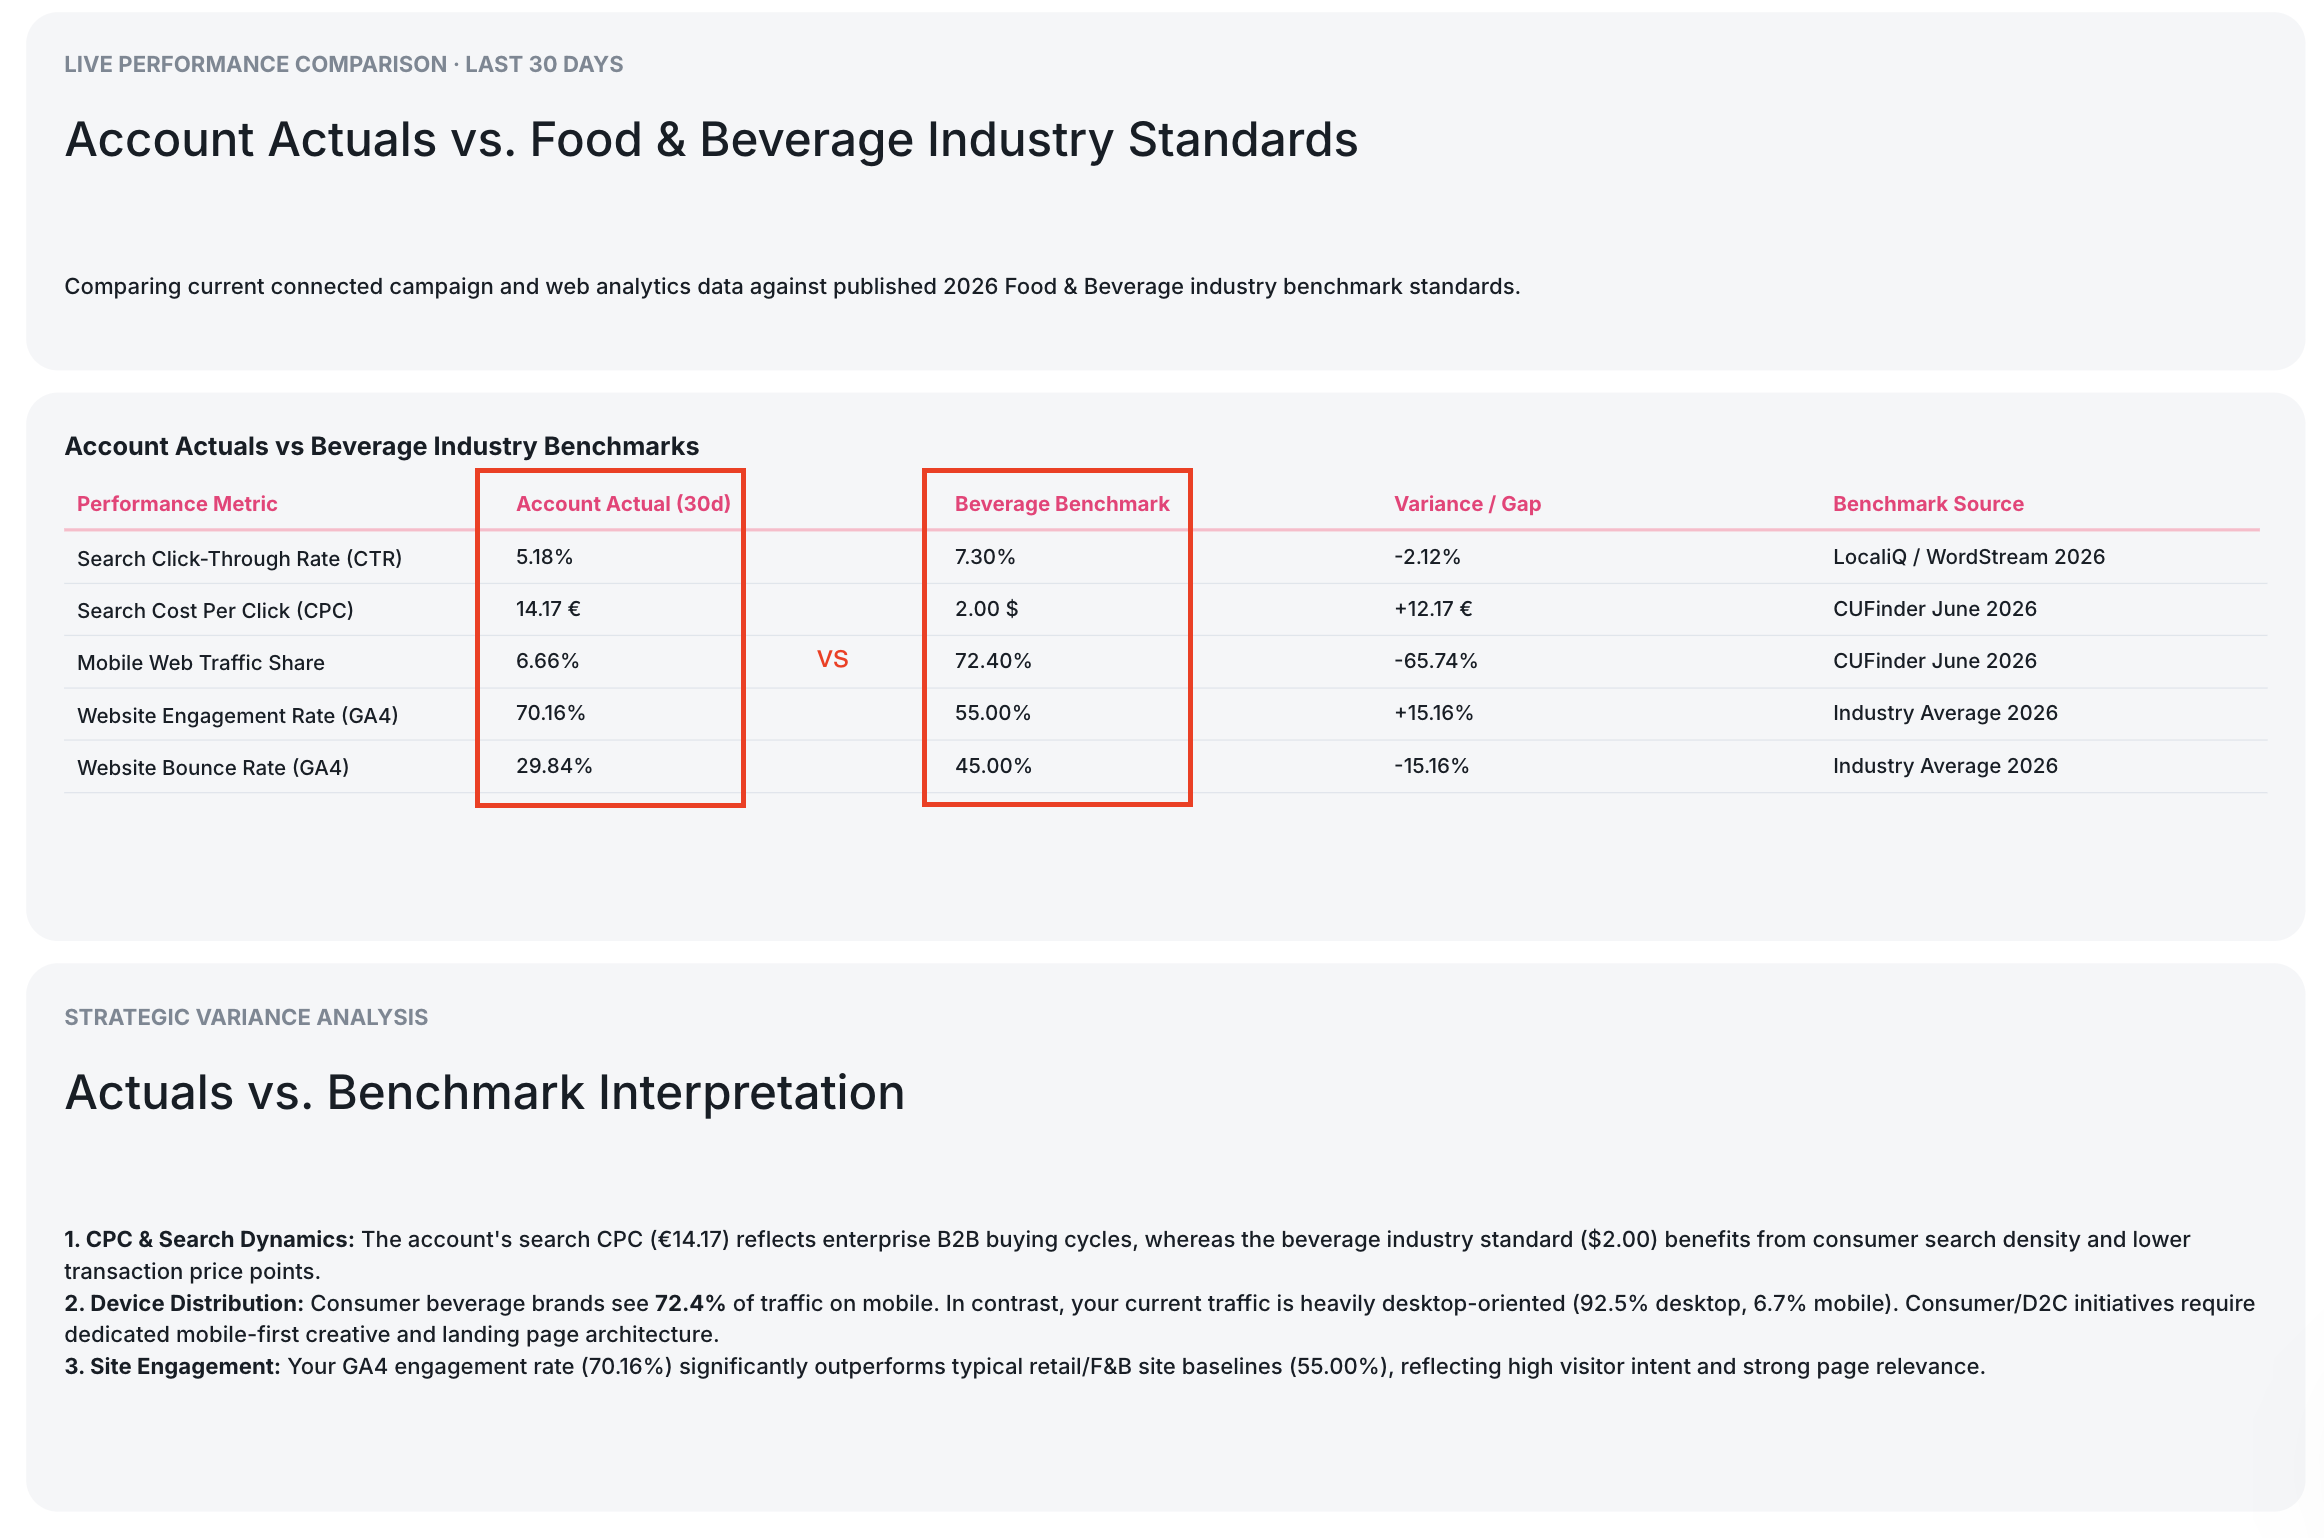
For the benchmark numbers themselves, see our PPC benchmarks for 2026, by platform and industry.
What are the best tools for PPC benchmarking?
There are two key tools that are great at PPC benchmarking in reports - Databox Benchmark Groups and Whatagraph IQ Agents.
Databox Benchmark Groups gives you benchmarks for dozens of metrics, built on anonymized data from thousands of companies. Open groups are accessible to any business that fits the group criteria. The data is anonymized, so you can't see the performance of individual companies.
Whatagraph IQ Agents uses a PPC benchmarking agent to research the benchmarks for each client's industry live, and add them to the client's report, next to their own numbers. Every benchmark comes with its source and date, and the agent can refresh this data gathering on a schedule so you always have the most up-to-date benchmark numbers.
Here's how the two compare:
| Databox Benchmark Groups | Whatagraph IQ Agents | |
|---|---|---|
| Where the benchmarks come from | Anonymized data from thousands of companies | Published studies and sources you name, researched by the agent (no hallucinations) |
| Who you're compared with | Open groups, accessible to any business that fits the group criteria | The averages for the client's industry, region, platform and campaign type, set in the agent's brief |
| What you can see | The data is anonymized, and you can't see the performance of individual companies | Every benchmark comes with its source and date |
| What it covers | Dozens of metrics from 50+ software tools, across sales, marketing, finance and more | The PPC metrics in each client's report, like CTR, CPC, conversion rate and cost per lead |
| How you use the results | Visualizations you can use in blog and video content | Offline widgets in each client's report, next to the matching KPI widgets, with the first draft of written commentary on what's above or below average |
How do agencies use AI agents for PPC benchmarking in Whatagraph?
Agencies use a PPC benchmarking agent to add the right industry benchmarks to every client's report, and a person checks them before the report goes out. Here's an example of what that looks like in Whatagraph (the numbers are made up for example purposes).
Example 1: three clients in three different industries
Let’s say a PPC agency runs Google Ads for a dental clinic group, a personal injury law firm and an online furniture store. Each client has its own Space (a.k.a. folder) in Whatagraph, tagged with its industry, and a monthly report with a Google Ads tab.
The agency sets up an agent that would do these tasks on the first Monday of each month:
- Reads each client's industry tag and looks up the latest Google search benchmarks for that industry in the US.
- Adds the benchmarks as offline widgets on each client's Google Ads tab, next to the CTR, CPC, conversion rate and cost per lead widgets. For the furniture store, it adds ROAS instead of cost per lead.
- Compares each client's last-month numbers with the benchmarks and writes the first draft of commentary in the report.
- Lists the source and date for every benchmark, and flags anything it couldn't find.
Before the reports go out, the account manager for each client opens the notes, checks the sources and edits anything that doesn't fit. Next month, the agent runs again autonomously and replaces the benchmarks with the latest figures.
Example 2: benchmarks and a forecast for next quarter's plan
Let’s say the same agency in example 1 plans each client's budget a quarter ahead. Before the planning call with the law firm, the account manager asks the agent for a plan based on the client's history and its industry's benchmarks.
The agent:
- Pulls the last four quarters of the firm's Google Ads results: spend, clicks, CPC, conversion rate and cost per lead.
- Adds the latest benchmarks for legal services, with sources.
- Projects next quarter from the trend, at the budget the client has agreed to, and at a higher budget for comparison.
- Writes the numbers into a planning tab in the report, with the assumptions behind each one.
Here's what the planning note could say, with made-up numbers:
CPC has risen from $9.10 to $9.80 over the last four quarters, about 2.5% a quarter. At that rate, next quarter's CPC is about $10.05. The conversion rate has held at around 8%.
At the planned $30,000 budget, that's about 2,985 clicks and 239 leads, at a cost per lead of about $126. That's below the $140 benchmark for legal services.
At $36,000, it's about 3,580 clicks and 287 leads, if CPC and conversion rate hold. More budget in the same auctions often raises CPC, so treat this as the upper end.
Sources: [study name, year] for the benchmarks. Projections use the firm's own results from the last four quarters.
The projection is an estimate. The account manager checks the assumptions, adjusts anything the agent can't know (like a new practice area or a seasonal push), and takes the plan into the call. The client sees their own trend, their industry's benchmark and two budget options on one page.
How to benchmark PPC campaigns effectively with an AI agent
Compare like with like: the same platform, campaign type, industry, region, date range and metric definition. A benchmark that doesn't match on these isn't a fair comparison.
Here's the process we recommend. The agent does steps 3, 6 and 7, and your team owns the rest:
- Note each client's industry. Use the most specific industry the source covers, like "dental clinics" instead of "health".
- Pick the metrics for the client's goal. A lead generation client cares about conversion rate and cost per lead. An ecommerce client cares about ROAS.
- Find a benchmark for that industry and platform. Write down the source, the year and the data period.
- Match the metric definitions. Google calculates conversion rate as conversions divided by the ad interactions that can be linked to a conversion (Google Ads Help). If your report calculates it differently, the comparison is off.
- Compare by campaign type. Keep search, display, shopping and Performance Max separate, and keep brand campaigns out of non-brand averages.
- Add the benchmark to the report. Put it next to the client's number, with the source and the date.
- Refresh it. Most published studies update once a year, but your client's numbers change every month.
Doing this by hand for every client means searching for a new source for each industry, every time. Here's how one UK agency described it:
"that's another thing that we find challenging... when looking for reasons why performance is down or up... it's like looking at other sources than just what's been connected."
A copyable prompt for your PPC benchmarking agent
Paste this brief into a custom agent, or give it to Radar in Whatagraph, and fill in the brackets:
Research PPC benchmarks for [client name].
Industry: [industry, for example dental clinics]
Region: [country]
Platforms and campaign types: [Google Ads search, Meta lead ads]
Metrics: [CTR, CPC, conversion rate, cost per lead]
Use these sources first: [source names or URLs]. Only use figures from [year] or later.
For each metric, give the benchmark, the source, the date it was published and the data period. If you can't find a benchmark for this industry and platform, say so. Don't use a figure from a different industry or platform.
Add the benchmarks as offline widgets to [report name], next to the matching KPI widgets on the [tab name] tab.
Compare the client's results for [last month / last quarter] with each benchmark. Write a short note on what's above or below average, and by how much. Only use metrics that are in the report.
Refresh the benchmarks on the [first Monday] of every [month / quarter].
Don't share or send the report. When you're done, list anything I need to check.
Key metrics to consider in PPC benchmarking
Benchmark the metrics that match the client's goal. These are the ones most published studies cover:
| Metric | What it shows | Above average usually means | Below average usually means |
|---|---|---|---|
| CTR | How often people click the ad after seeing it | The ads and keywords match what people search for | Weak ad copy, or keywords that are too broad |
| CPC | What you pay for each click | A competitive industry, or a low Quality Score | Good relevance, or a less competitive niche |
| Conversion rate | How often a click turns into a lead or sale | A strong landing page and offer | A landing page or offer problem |
| Cost per lead or CPA | What each lead or sale costs | Costly clicks, weak conversion, or both | An efficient campaign |
| ROAS | Revenue for each dollar spent | Strong ecommerce returns | Low order values or weak conversion |
| Impression share | How often your ads show when they could | Enough budget and strong bids | Lost budget or rank against competitors |
For CPC, CPA and cost per lead, lower is better. For the others, higher is better.
PPC benchmarking vs. traditional marketing metrics
PPC benchmarks compare measured results at the click level. Traditional marketing metrics, like reach, brand awareness or share of voice, are often estimates that measure exposure rather than action.
| PPC benchmarks | Traditional marketing metrics | |
|---|---|---|
| What they measure | Clicks, conversions and cost, per campaign | Reach, awareness, recall, share of voice |
| How they're collected | Ad platforms report them directly | Surveys, panels and modeled estimates |
| How easy they are to compare | Easy, if platform, industry and definitions match | Hard, because methods differ between studies |
| What they miss | What happens before the click, like brand awareness | The direct link between spend and results |
Most agencies report both. PPC benchmarks show whether the campaigns are efficient. Traditional metrics show whether the brand is growing.
What to include in a PPC benchmarking report
A PPC benchmarking report puts each client's numbers next to the right benchmark, so anyone reading it can see what's above or below average. Include:
- The period. For example, last month compared with the benchmark for the same platform.
- The client's metrics, split by platform and campaign type.
- The benchmark for each metric, with the source, the year and the industry it covers.
- The variance. Above or below average, and by how much.
- What's driving it. A short note on why a metric is above or below average.
- Next steps. What you'll change, and which metric it should affect.
- Notes on fit. Where the benchmark doesn't match the client perfectly, like a different region or a broader industry.
Here's what one row can look like, with made-up numbers:
| Metric | Client (last month) | Industry benchmark | Gap | Source |
|---|---|---|---|---|
| Google search CTR | 7.5% | 6.0% | 1.5 points above | [Study name, year] |
In Whatagraph, an agent adds the benchmarks as offline widgets next to the client's KPI widgets and refreshes them on its schedule. Build CTR, CPA and ROAS as custom metrics in the Data Hub, so the client's numbers use the same definition as the benchmark in every report.
Common PPC benchmarking mistakes to avoid
Most benchmarking mistakes come from putting two numbers side by side that don't measure the same thing. Here are the ones agencies run into most, with what they've told us about them.
1. Comparing metrics that are measured differently
Two tools can count the same thing in different ways. In Google Ads, the Conversions column only counts primary conversion actions, while All conversions also counts secondary actions. Say the dental clinic tracks booking forms as primary, and calls and direction clicks as secondary. Its conversion rate could be 7% in one column and 14% in the other.
The same problem shows up between analytics tools. A reporting lead at a UK healthcare company said:
"the way visits are measured in Adobe Analytics is different from the way visits are measured in... GA4. So I think that's where it gets tricky if we're trying to kind of merge the channels."
Check what the benchmark counts as a conversion, and report the column or tool that matches. In Whatagraph, build each metric once as a custom metric in the Data Hub, so every report uses the same definition.
2. Adding up numbers by hand from many sources
Benchmarks often need totals across several accounts or channels. When those totals are built by hand, in spreadsheets or by an AI tool reading each source separately, the numbers drift. A marketing director at a B2B events agency said:
"it's a really manual process for us to develop those benchmarks because we have every individual client's event sitting in a separate Google Sheets... So it's difficult to pull all of that data together and then get a full overview"
A digital agency said this about letting AI do the adding up:
"So your AI doesn't have to do the aggregation because otherwise your AI will be pulling 20 different sources, trying to add it itself. And then all of a sudden the numbers are wrong."
Combine a client's accounts into one source group in Whatagraph, and channels into one blend, before you compare anything. Then the agent reads one total instead of adding up 20 sources itself.
3. Using one benchmark for every campaign type
Brand, non-brand and Performance Max campaigns behave very differently. People who search for the law firm by name click its ads more often and at a lower CPC, so a 25% brand CTR can lift the account average above the legal services benchmark while non-brand campaigns sit below it.
Performance Max shows ads across YouTube, Display, Search, Discover, Gmail and Maps, so its CTR mixes very different placements. Compare non-brand search with the search benchmark, report brand on its own, and benchmark Performance Max on conversion rate, cost per lead or ROAS.
4. Using a US or out-of-date benchmark
Many published studies are built on US campaigns. The WordStream and LocaliQ study for Google Ads, for example, uses 13,000+ US campaigns. Averages also change every year: in their studies, the average Google search CPC was $4.66 in 2024 and $5.42 in 2026. Set the region in the agent's brief, have it say when it can only find US data, and show the source and year next to every number.
5. Keeping the industry average after the client has its own history
Industry benchmarks matter most when a client is new and has nothing else to compare against. Once there's enough history, the client's own trend is usually the better reference. The same marketing director said:
"particularly when you've got a client that's launching new events, our benchmarks are really, really helpful for them to understand how they are performing. When they've run the events for a couple of years, they tend to refer more to their own data, historical data."
Show both in the report: the industry benchmark for context, and the client's own history for targets.
6. Sending the agent's research without checking it
An agent can pick up a wrong figure, especially for numbers that are public but hard to read from a page. Name the sources in the brief, ask the agent to flag what it can't find instead of guessing, and have someone open each source before the report goes out.