100+ PPC Benchmarks 2026: Latest Data by Platform and Industry

Aug 05 2026●12 min read


PPC benchmarks are useful for building forecasts, measuring campaign performance, and defending numbers against leadership or clients.
But they're spread out everywhere: in a gated PDF, a hallucinated source by ChatGPT, a study that turned out to be from 2019.
To make your life easier, we researched and validated every source and pulled the most credible benchmarks in 2026 into one place.
Every PPC benchmark in this guide comes from a named, dated source that publishes its methodology:
- WordStream and LocaliQ's study of 13,474 search campaigns, plus the 2026 Google Ads guide and Facebook benchmarks
- Triple Whale's ecommerce datasets for Google, Meta, and TikTok
- Dreamdata's 2026 B2B report
- ZenABM's LinkedIn ABM data
- Birch's live trackers for Instagram CPC, Facebook CPL, and Instagram CPL
- BrightBid and Lionheart for Microsoft Ads, AdLiftr for Snapchat, WebFX for Pinterest, and the ad platforms' own documentation
Where two good sources disagreed, we kept both and explained what each one measured. No averaging two datasets into a number nobody recorded.
Let's dig in.
TL;DR: 2026 PPC benchmarks by channel
Before we go into the nitty-gritty, here's a high-level overview of the benchmarks for each channel, and a handy image:
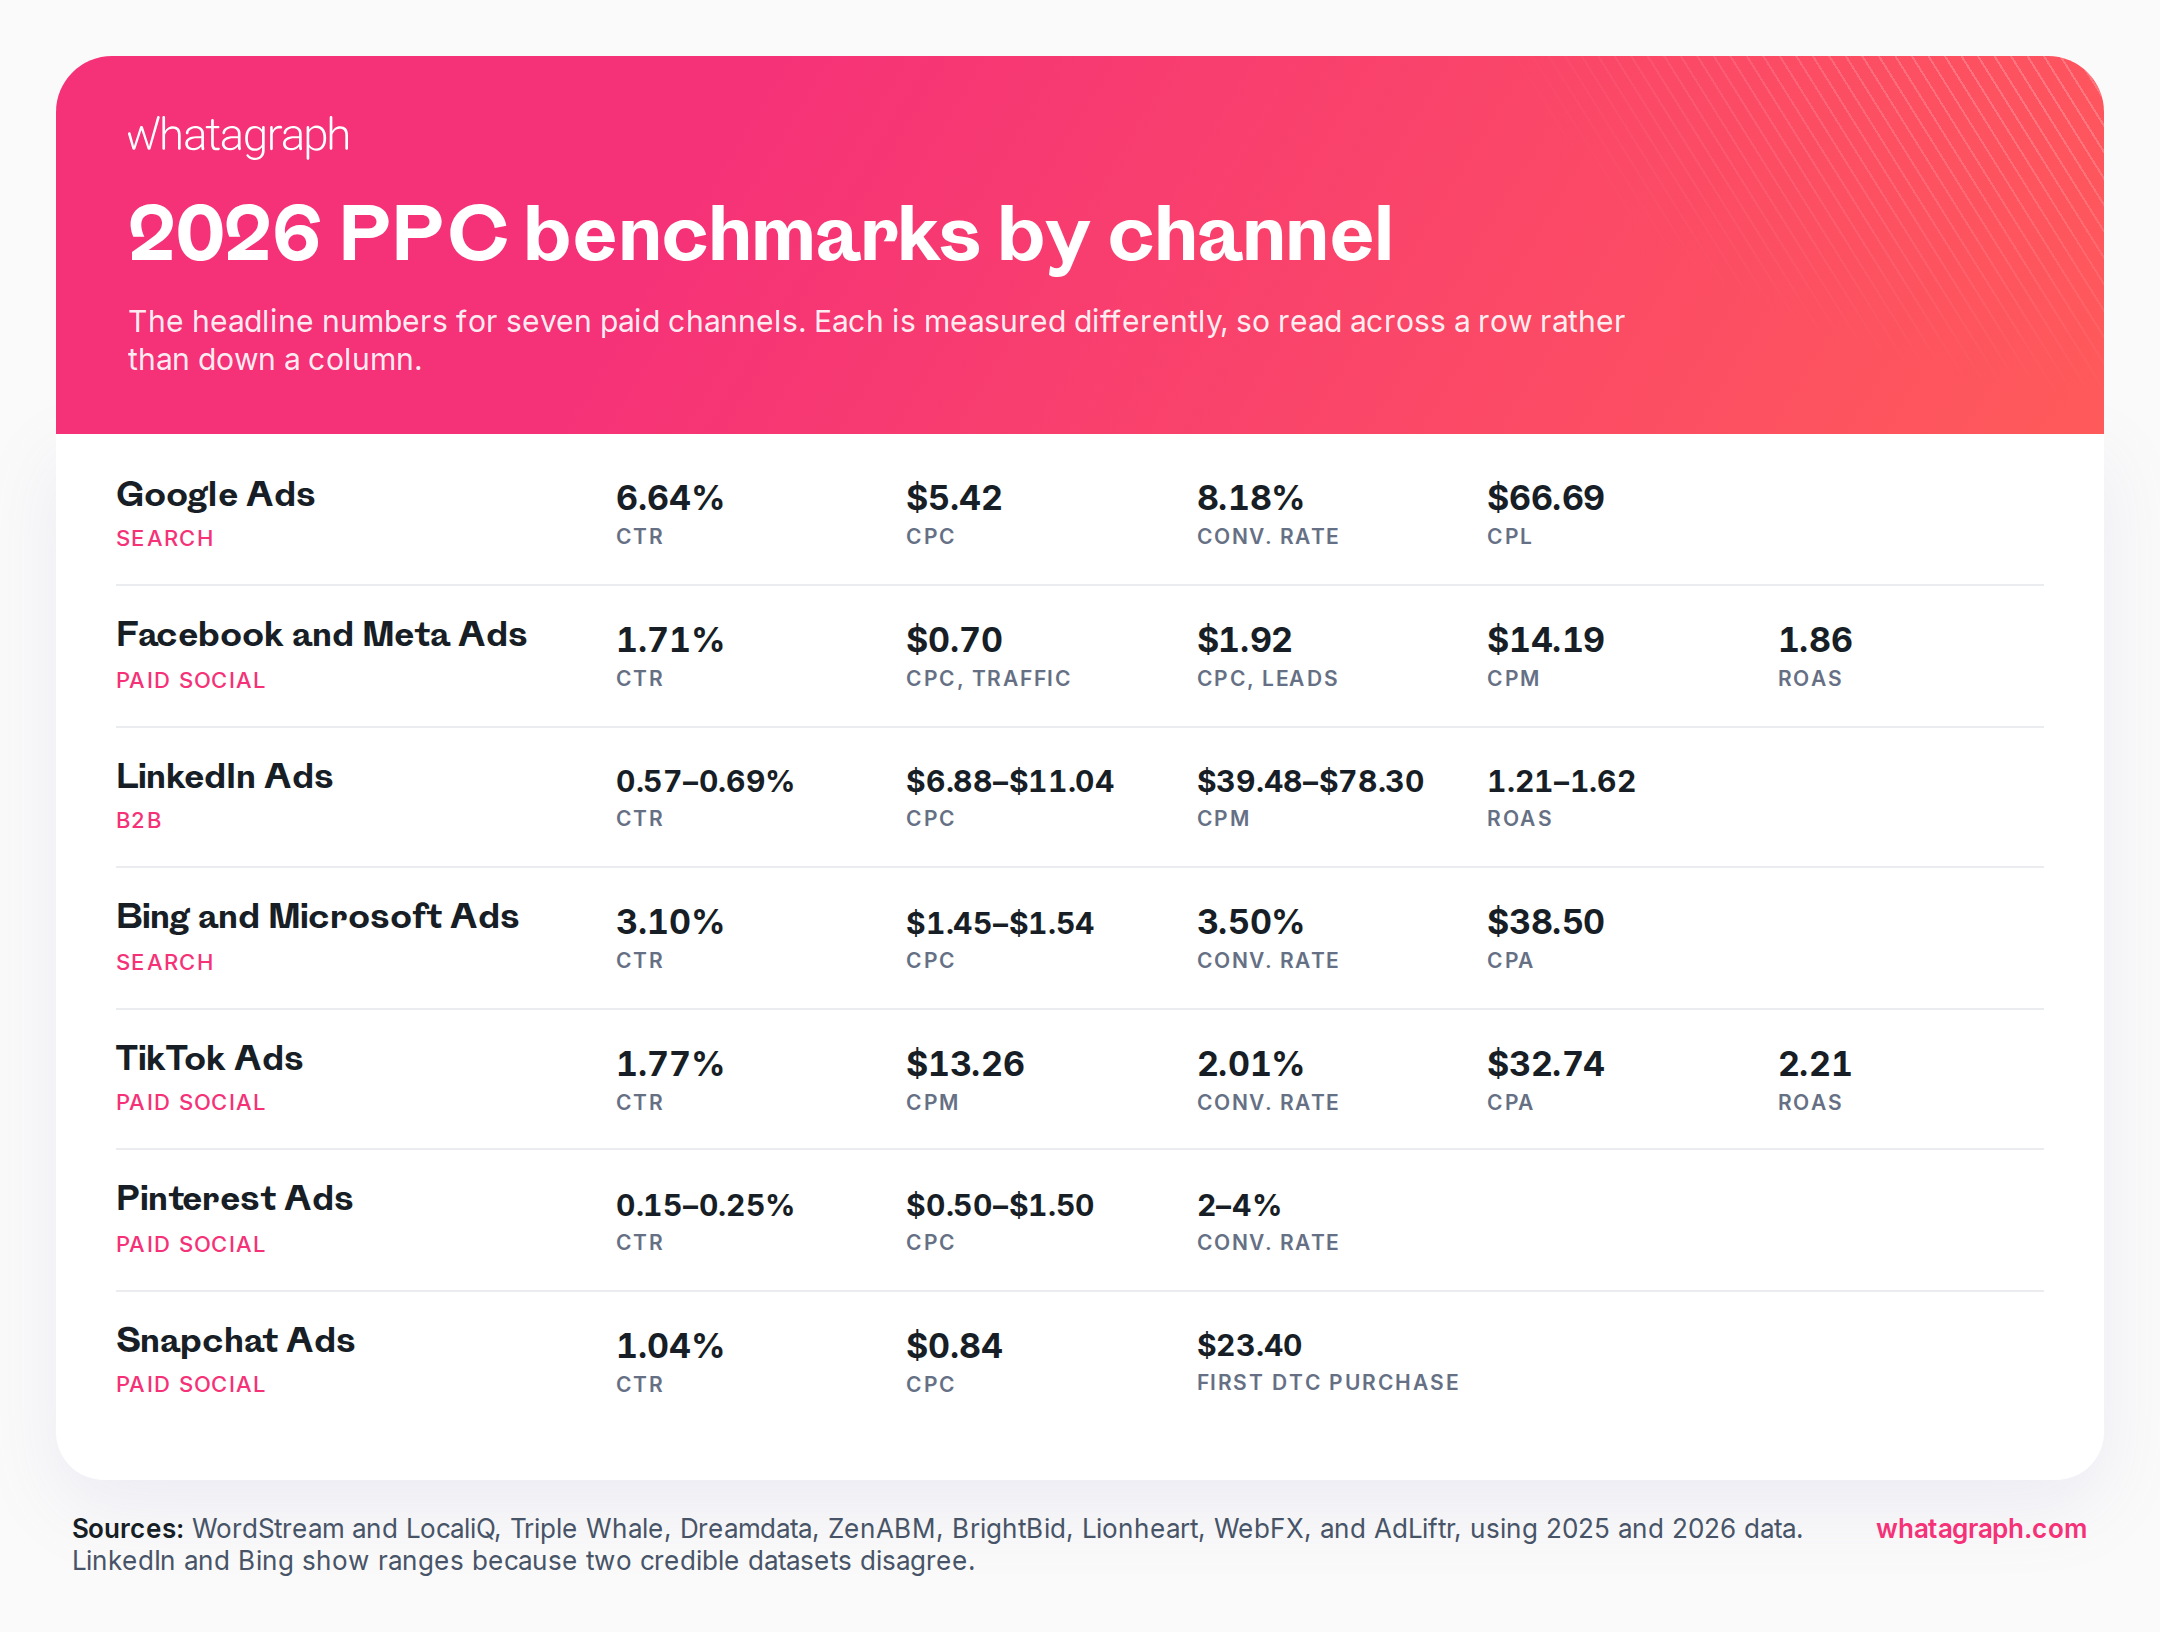
- Google Ads: 6.64% CTR, $5.42 CPC, 8.18% conversion rate, $66.69 CPL.
- Facebook and Meta Ads: 1.71% CTR and $0.70 CPC on traffic campaigns, $1.92 CPC on lead campaigns. For ecommerce, a $14.19 median CPM and a 1.86 median ROAS.
- LinkedIn Ads: 0.57% to 0.69% CTR, $6.88 to $11.04 CPC, $39.48 to $78.30 CPM, 1.21 to 1.62 ROAS.
- Bing and Microsoft Ads: 3.10% CTR, $1.45 to $1.54 CPC, 3.50% conversion rate, $38.50 CPA.
- TikTok Ads: 1.77% CTR, $13.26 CPM, 2.01% conversion rate, $32.74 CPA, 2.21 ROAS, $74.12 AOV.
- Pinterest Ads: 0.15% to 0.25% CTR, $0.50 to $1.50 CPC, $0.10 to $0.30 per engagement, 2% to 4% conversion rate.
- Snapchat Ads: 1.04% CTR, $0.84 CPC, and $23.40 to acquire a first-time DTC purchaser.
How to read the numbers
A good CTR runs from under 2% on paid social to nearly 7% on search, so the platform matters more than the percentage. If you're near your platform's figure, you're in safe territory, though it's not a pass-or-fail line: objective, industry, audience intent, and ad format all move it.
The same caution applies to ROAS. A 2.5 ROAS beats the 2.21 TikTok median Triple Whale recorded in 2025. Whether it's profitable is a margin question. Break-even ROAS is 1 divided by your gross margin, so at a 40% margin, 2.5 is exactly break-even and every dollar above cost of goods goes straight back into the ads.
Launching with no history? Start from these all-industry numbers, then narrow to your vertical once your own data is worth trusting.
Keep in mind also that benchmarks are just...well...benchmarks. They're meant as yardsticks but not absolute standards for which you should be striving for or comparing against.
💡 Did you know? With Whatagraph IQ Agents, you can research the most updated benchmarks live and add them directly to your PPC reports alongside your actual numbers to explain performance or forecast for the next quarter.
For instance, here’s what the Whatagraph agent pulled together after we asked it to “look for beverage industry benchmarks” in less than 2 minutes:
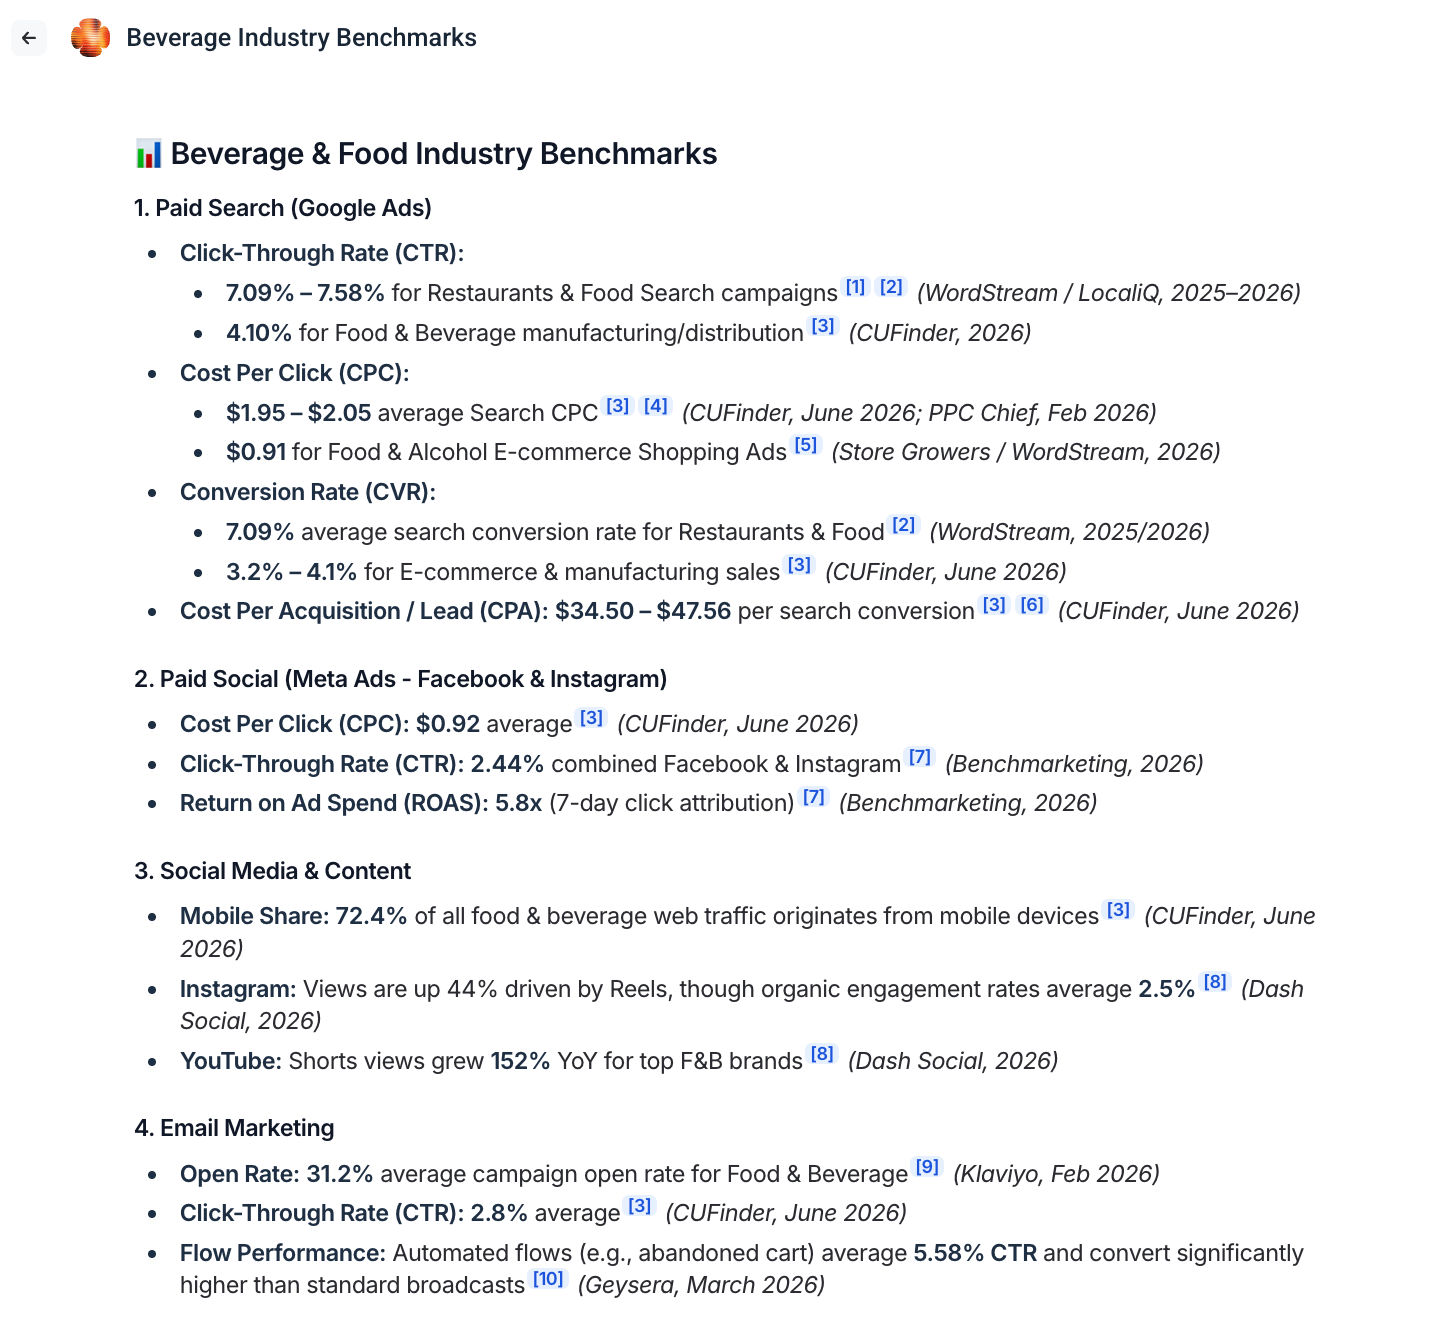
The agent then put the benchmarks together in a report and returned it after 4 minutes. The report includes:
- An executive summary tab
- Benchmarks for each category (paid search, paid social, email & web traffic)
- Actuals vs. benchmarks
- A short commentary that you can fully adjust
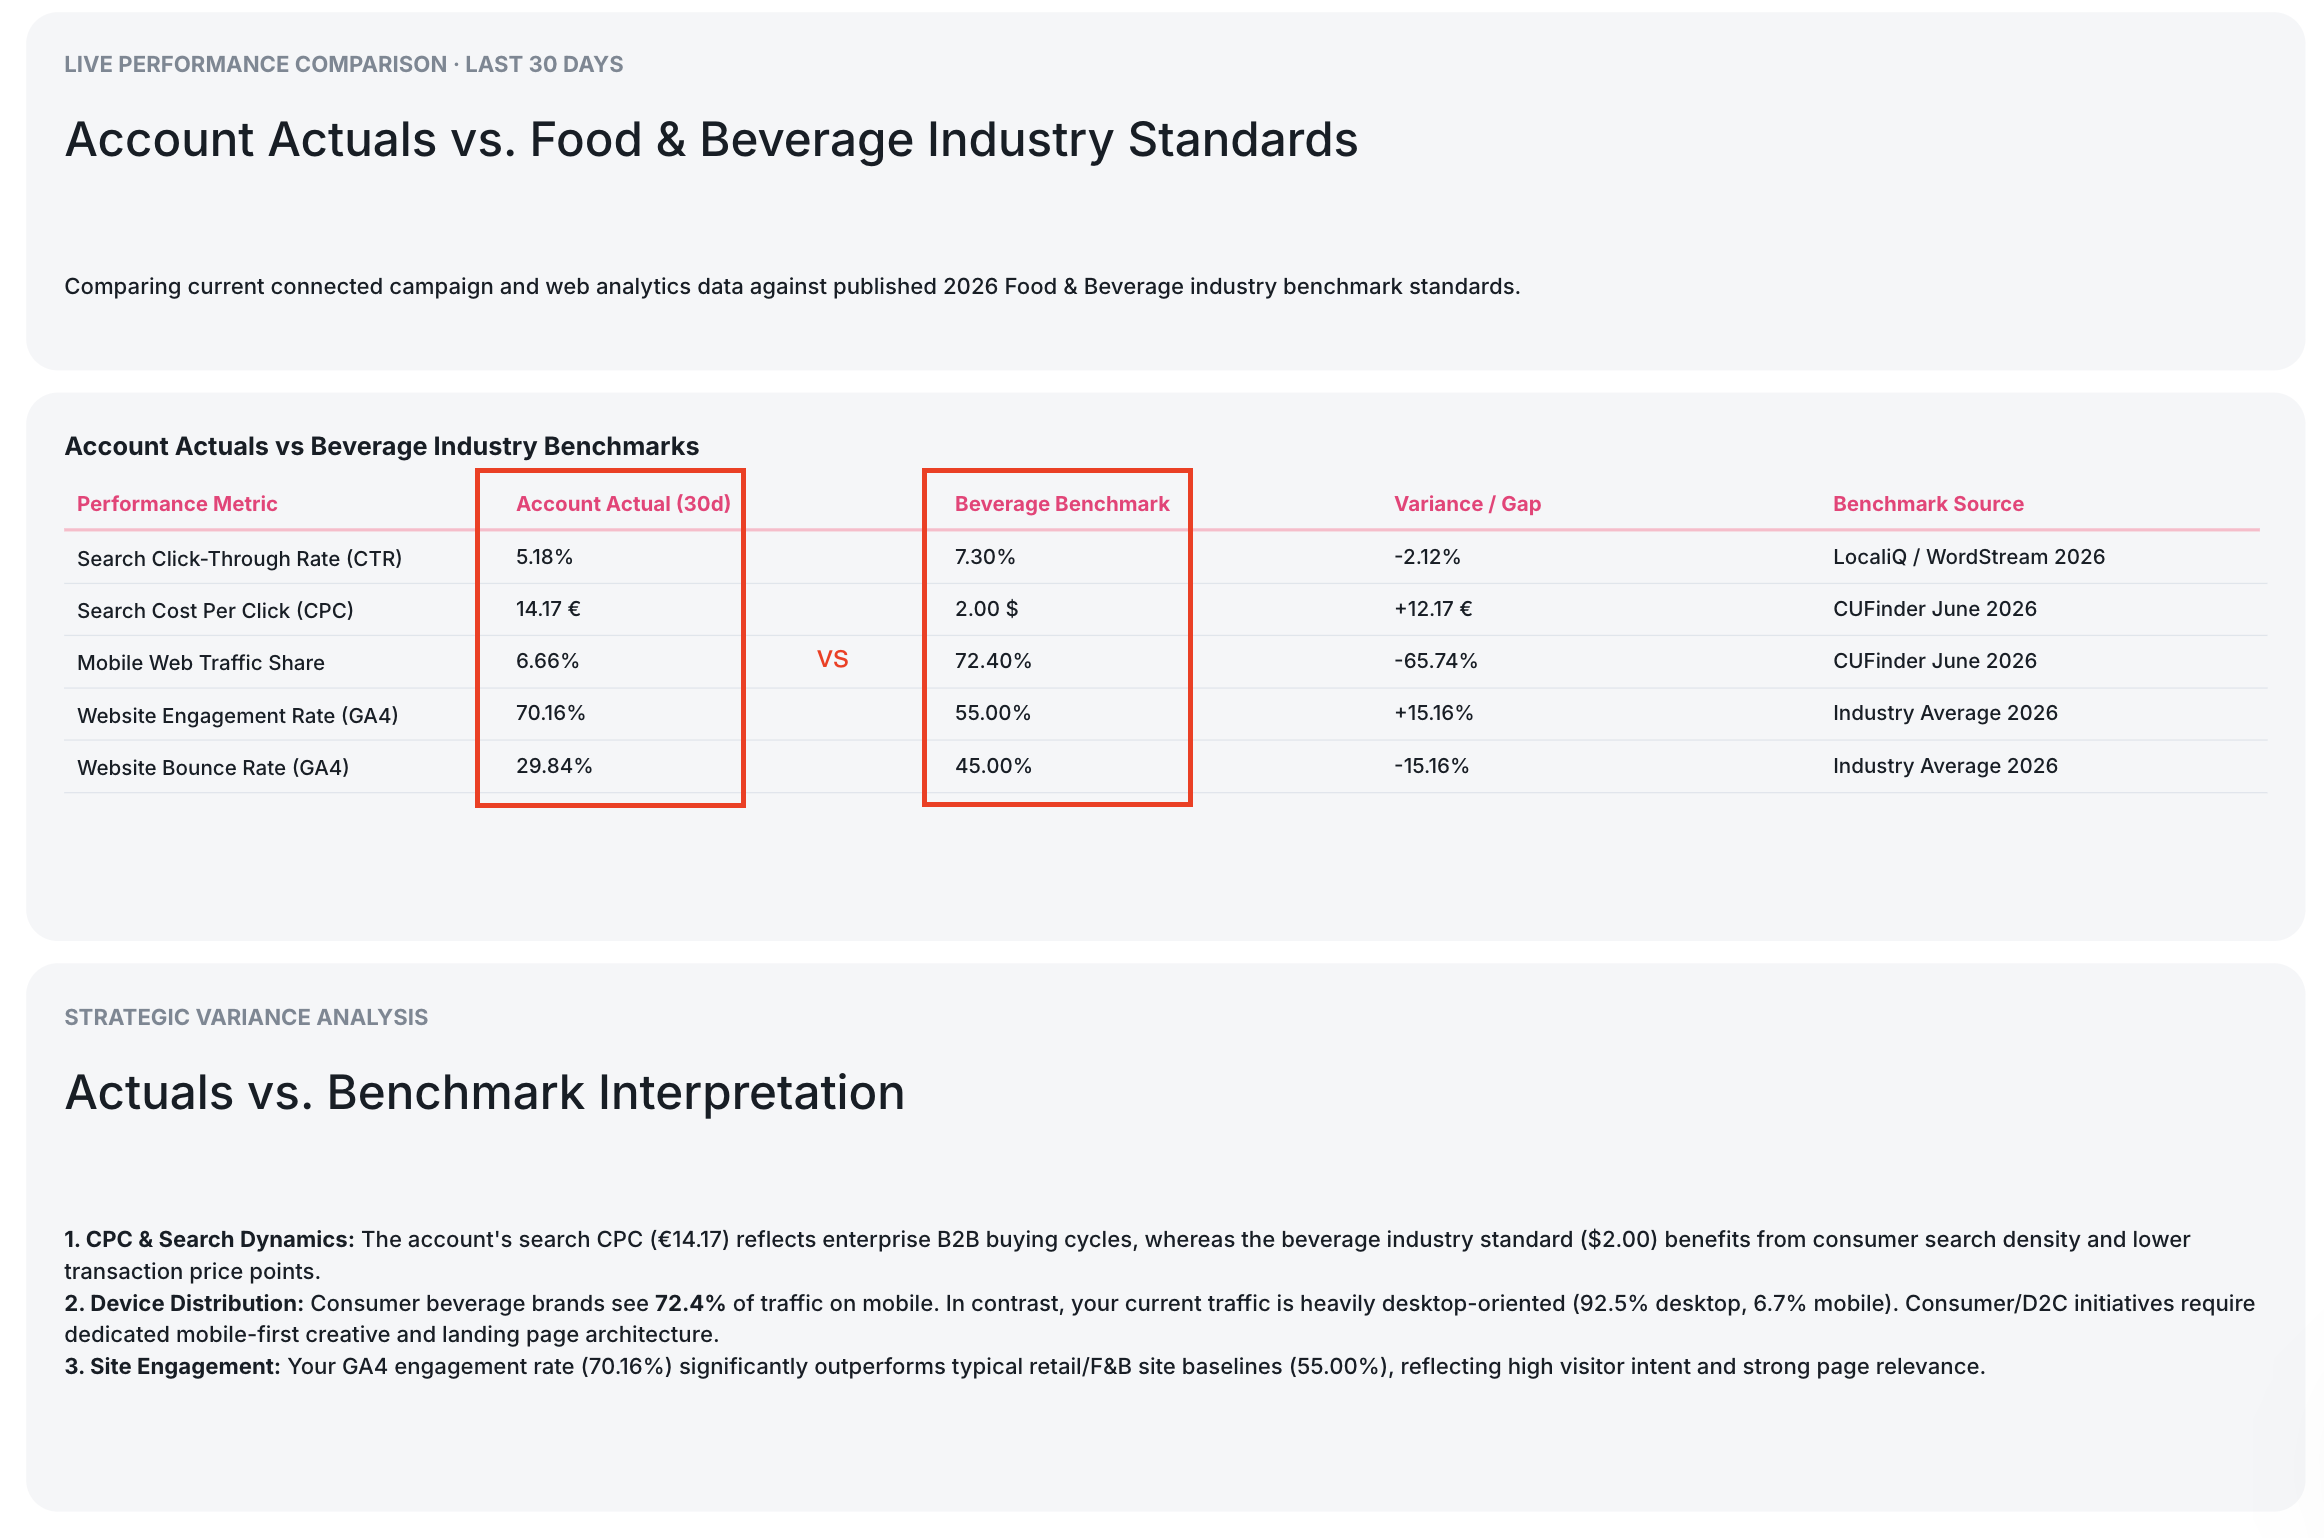
Check out this PPC benchmarking use case page for more details.
Now let's dive into the benchmarks for each channel.
Google Ads benchmarks for 2026
The largest public dataset here, WordStream and LocaliQ's, doesn't isolate Google. The 13,474 campaigns span Google and Microsoft Ads, weighted roughly 80%-85% Google by budget. This is a reminder to know what's inside a number before comparing yourself to it.
I’ll use it here as a Google-weighted paid-search benchmark, then bring in Google-specific datasets where available.
After a few jumpy years, the headline figures have settled down. CTR fell 0.3%, CPC went up 3.04%, and conversion rate increased by 8.78%. In 87% of the industries studied, conversion rates went up.
Zoom out, though, and search hasn’t become cheap again. The average CPC has more than doubled from $2.32 in 2016 to $5.42 in 2026. CPL rose much less over the same decade, from $59.18 to $66.69.
CTR benchmarks for Google Ads
The broad 2026 search benchmark is 6.64% CTR, according to Wordstream. But Google-specific ecommerce data tells a different story.
Triple Whale analyzed Google Ads performance from more than 18,000 ecommerce brands during 2025 and recorded a 1.51% CTR, alongside a 3.22% conversion rate and 3.31 ROAS.
Triple Whale covers Google Ads as a whole rather than isolating Search campaigns, so 1.51% and 6.64% aren’t competing answers.
Google Ads CPC benchmarks
The Google-weighted 2026 Google Ads CPC benchmark is $5.42. Here, industry has far more influence. For example, automotive repair is a great counterexample to CPC tunnel vision. The industry’s $4.35 CPC sits below the overall figure, but the more interesting numbers come next: a 15.51% conversion rate and $29.96 CPL.
So, it has the lowest CTR in the study and one of its strongest conversion funnels.
B2B Google Ads benchmarks
Business services is the closest broad B2B category in the WordStream and LocaliQ study: 6.10% CTR, $5.87 CPC, 4.85% conversion rate, and $93.69 CPL.
These are useful Google Ads B2B advertising benchmarks, but “lead” may mean a form filled in one account, a qualified demo in another, and a sales-accepted opportunity in a third.
Google Ads industry benchmarks
The table below contains the latest Google Ads benchmarks by industry:
| Industry | CTR | CPC | CVR | CPL |
|---|---|---|---|---|
| Animals and pets | 7.49% | $4.06 | 16.22% | $31.50 |
| Apparel, fashion, and jewelry | 6.64% | $4.44 | 4.50% | $97.51 |
| Arts and entertainment | 12.75% | $1.63 | 5.91% | $26.84 |
| Attorneys and legal services | 5.87% | $9.87 | 5.55% | $131.63 |
| Automotive: for sale | 8.28% | $2.27 | 6.01% | $44.26 |
| Automotive: repair, service, and parts | 5.56% | $4.35 | 15.51% | $29.96 |
| Beauty and personal care | 6.75% | $4.62 | 10.35% | $39.25 |
| Business services | 6.10% | $5.87 | 4.85% | $93.69 |
| Career and employment | 5.88% | $5.81 | 3.05% | $67.36 |
| Dentists and dental services | 5.66% | $8.00 | 10.67% | $72.97 |
| Education and instruction | 7.56% | $4.81 | 13.14% | $77.48 |
| Finance and insurance | 9.83% | $3.39 | 2.64% | $74.44 |
| Furniture | 6.57% | $3.97 | 2.99% | $106.70 |
| Health and fitness | 5.81% | $6.17 | 6.94% | $67.36 |
| Home and home improvement | 6.47% | $8.33 | 8.05% | $90.92 |
| Industrial and commercial | 6.57% | $5.87 | 8.20% | $75.19 |
| Personal services | 7.16% | $7.17 | 12.34% | $54.60 |
| Physicians and surgeons | 6.61% | $4.76 | 12.43% | $40.04 |
| Real estate | 7.61% | $3.22 | 3.70% | $102.51 |
| Restaurants and food | 6.83% | $2.05 | 8.05% | $30.57 |
| Shopping, collectibles, and gifts | 8.28% | $4.14 | 4.01% | $49.40 |
| Sports and recreation | 8.75% | $2.77 | 7.69% | $44.26 |
| Travel | 9.32% | $2.14 | 5.83% | $44.70 |
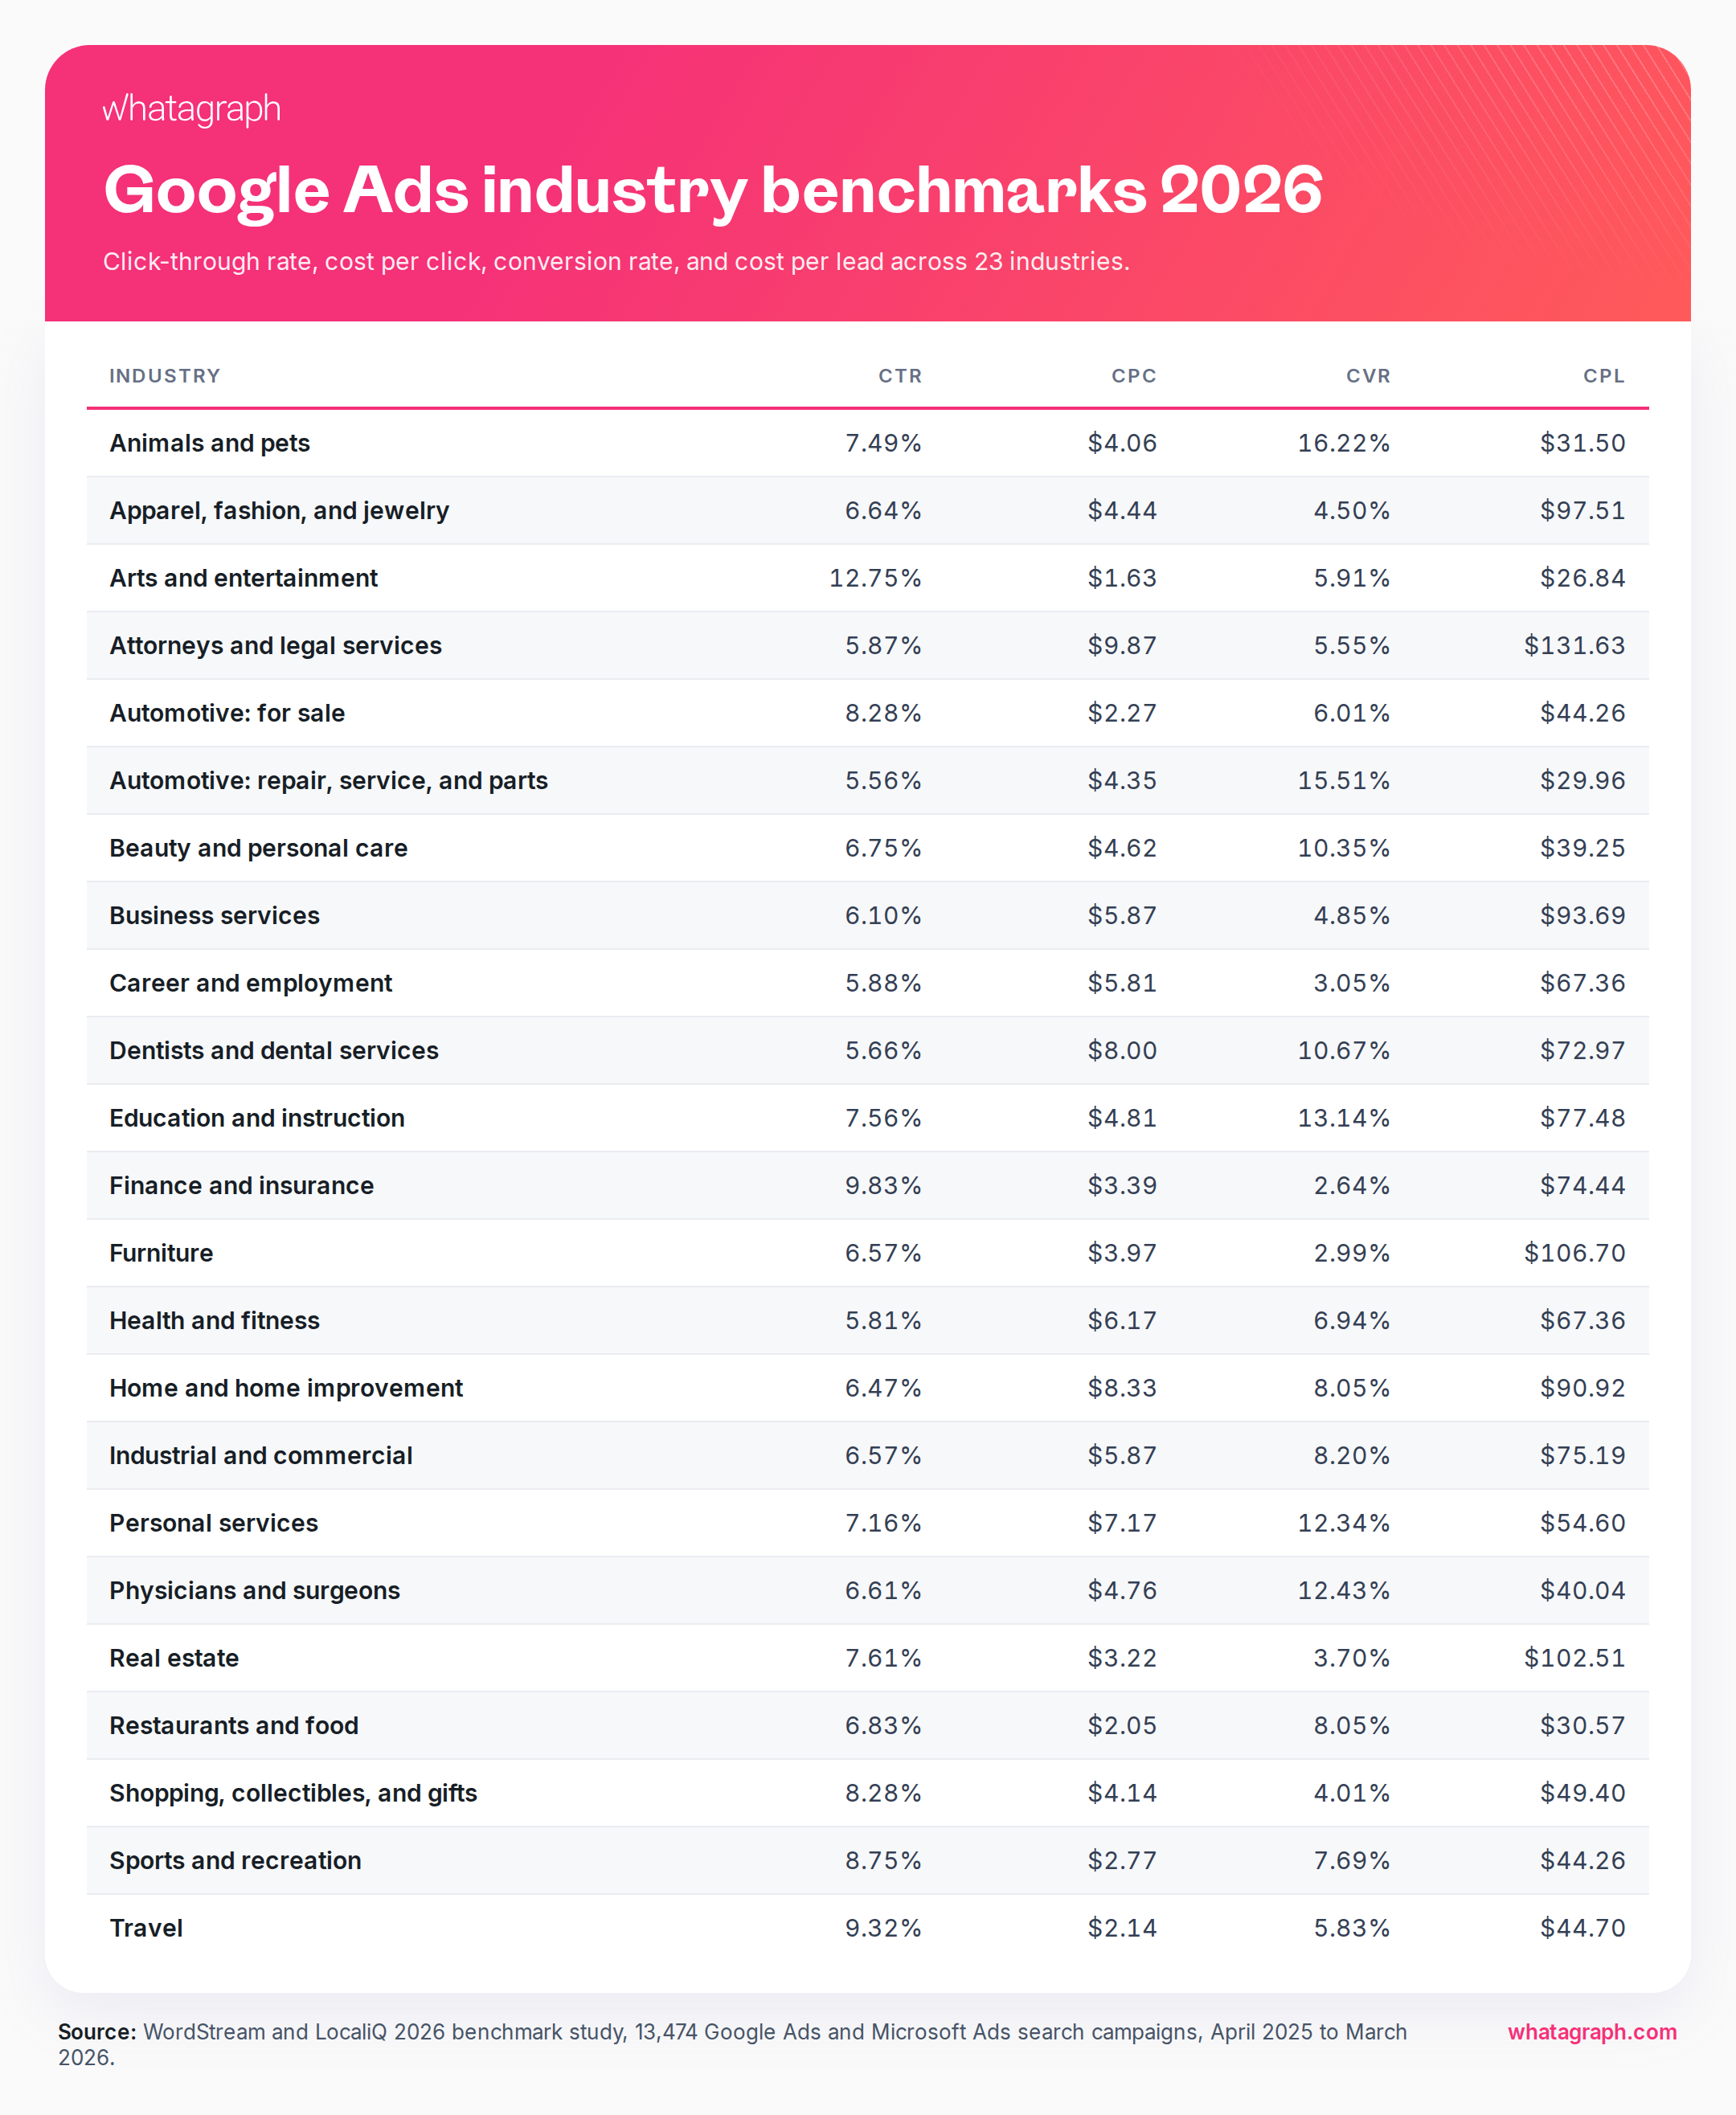
Want to report on Google Ads numbers? Check out this Google Ads report template we co-created with Ameet Khabra, Founder, Hop Skip Media agency. The template includes metrics that matter, like:
- Conversion rate
- Total cost
- Cost per conversion
- CPC, CTR, and more
Or want a cross-channel PPC report template instead? We've got 10 PPC reporting examples here.
Facebook/Meta Ads benchmarks for 2026
There are three datasets that carry this section, and they measure different worlds:
- WordStream’s 2025 Facebook benchmarks cover U.S. campaigns reported separately by objective and industry: traffic versus leads.
- Triple Whale's Meta benchmarks cover nearly 35,000 ecommerce brands across full-year 2025, Facebook and Instagram combined.
- Birch’s (formerly RevealBot) live trackers update weekly using hundreds of millions of dollars in monthly U.S. ad spend.
What is a good cost per click for Facebook ads?
The median CPC for Facebook traffic campaigns is $0.70 across industries. For lead campaigns, it’s $1.92.
There's a big difference between a lead-gen click that costs under a dollar in restaurants and one that costs almost $10 in dentistry: the customer is worth more.
For ecommerce brands, reach became markedly more expensive in 2025. Triple Whale’s top-line Meta CPM rose 20.03% to $14.19, and every industry in its dataset saw CPM increase.
(Speaking of ecommerce, here's a Meta Ads report template for ecommerce clients you can steal.)
As of July 2026, per Birch, the average Instagram CPC sits at $1.34, Facebook cost per lead at $34.64, and Instagram CPL at $47.93.
Note: Meta’s default CPC can count interactions such as reactions and media clicks. Birch uses cost per link click, which is usually what a performance marketer means when asking how much it costs to send someone somewhere.
Facebook ads ROAS benchmarks
The median ROAS across Meta in 2025 was 1.86, per Triple Whale's dataset of nearly 35,000 ecommerce brands. And 12 of 15 industries improved year over year, even as CPMs rose across every single one.
Now for the harder question: 1.86 of what, exactly?
Meta’s latest incremental-attribution rollout drove 24% more incremental conversions than its standard attribution model in Q4 2025. And Meta's reported ROAS is one version of the truth to begin with—the platform grading its own homework, with its own attribution window and its own opinion of which sales belong to it.
On Whatagraph, you can create your own definition of ROAS (apart from platform-reported ones) easily with Custom Metrics. Just choose your channel or data source and create a custom formula that works to calculate ROAS.
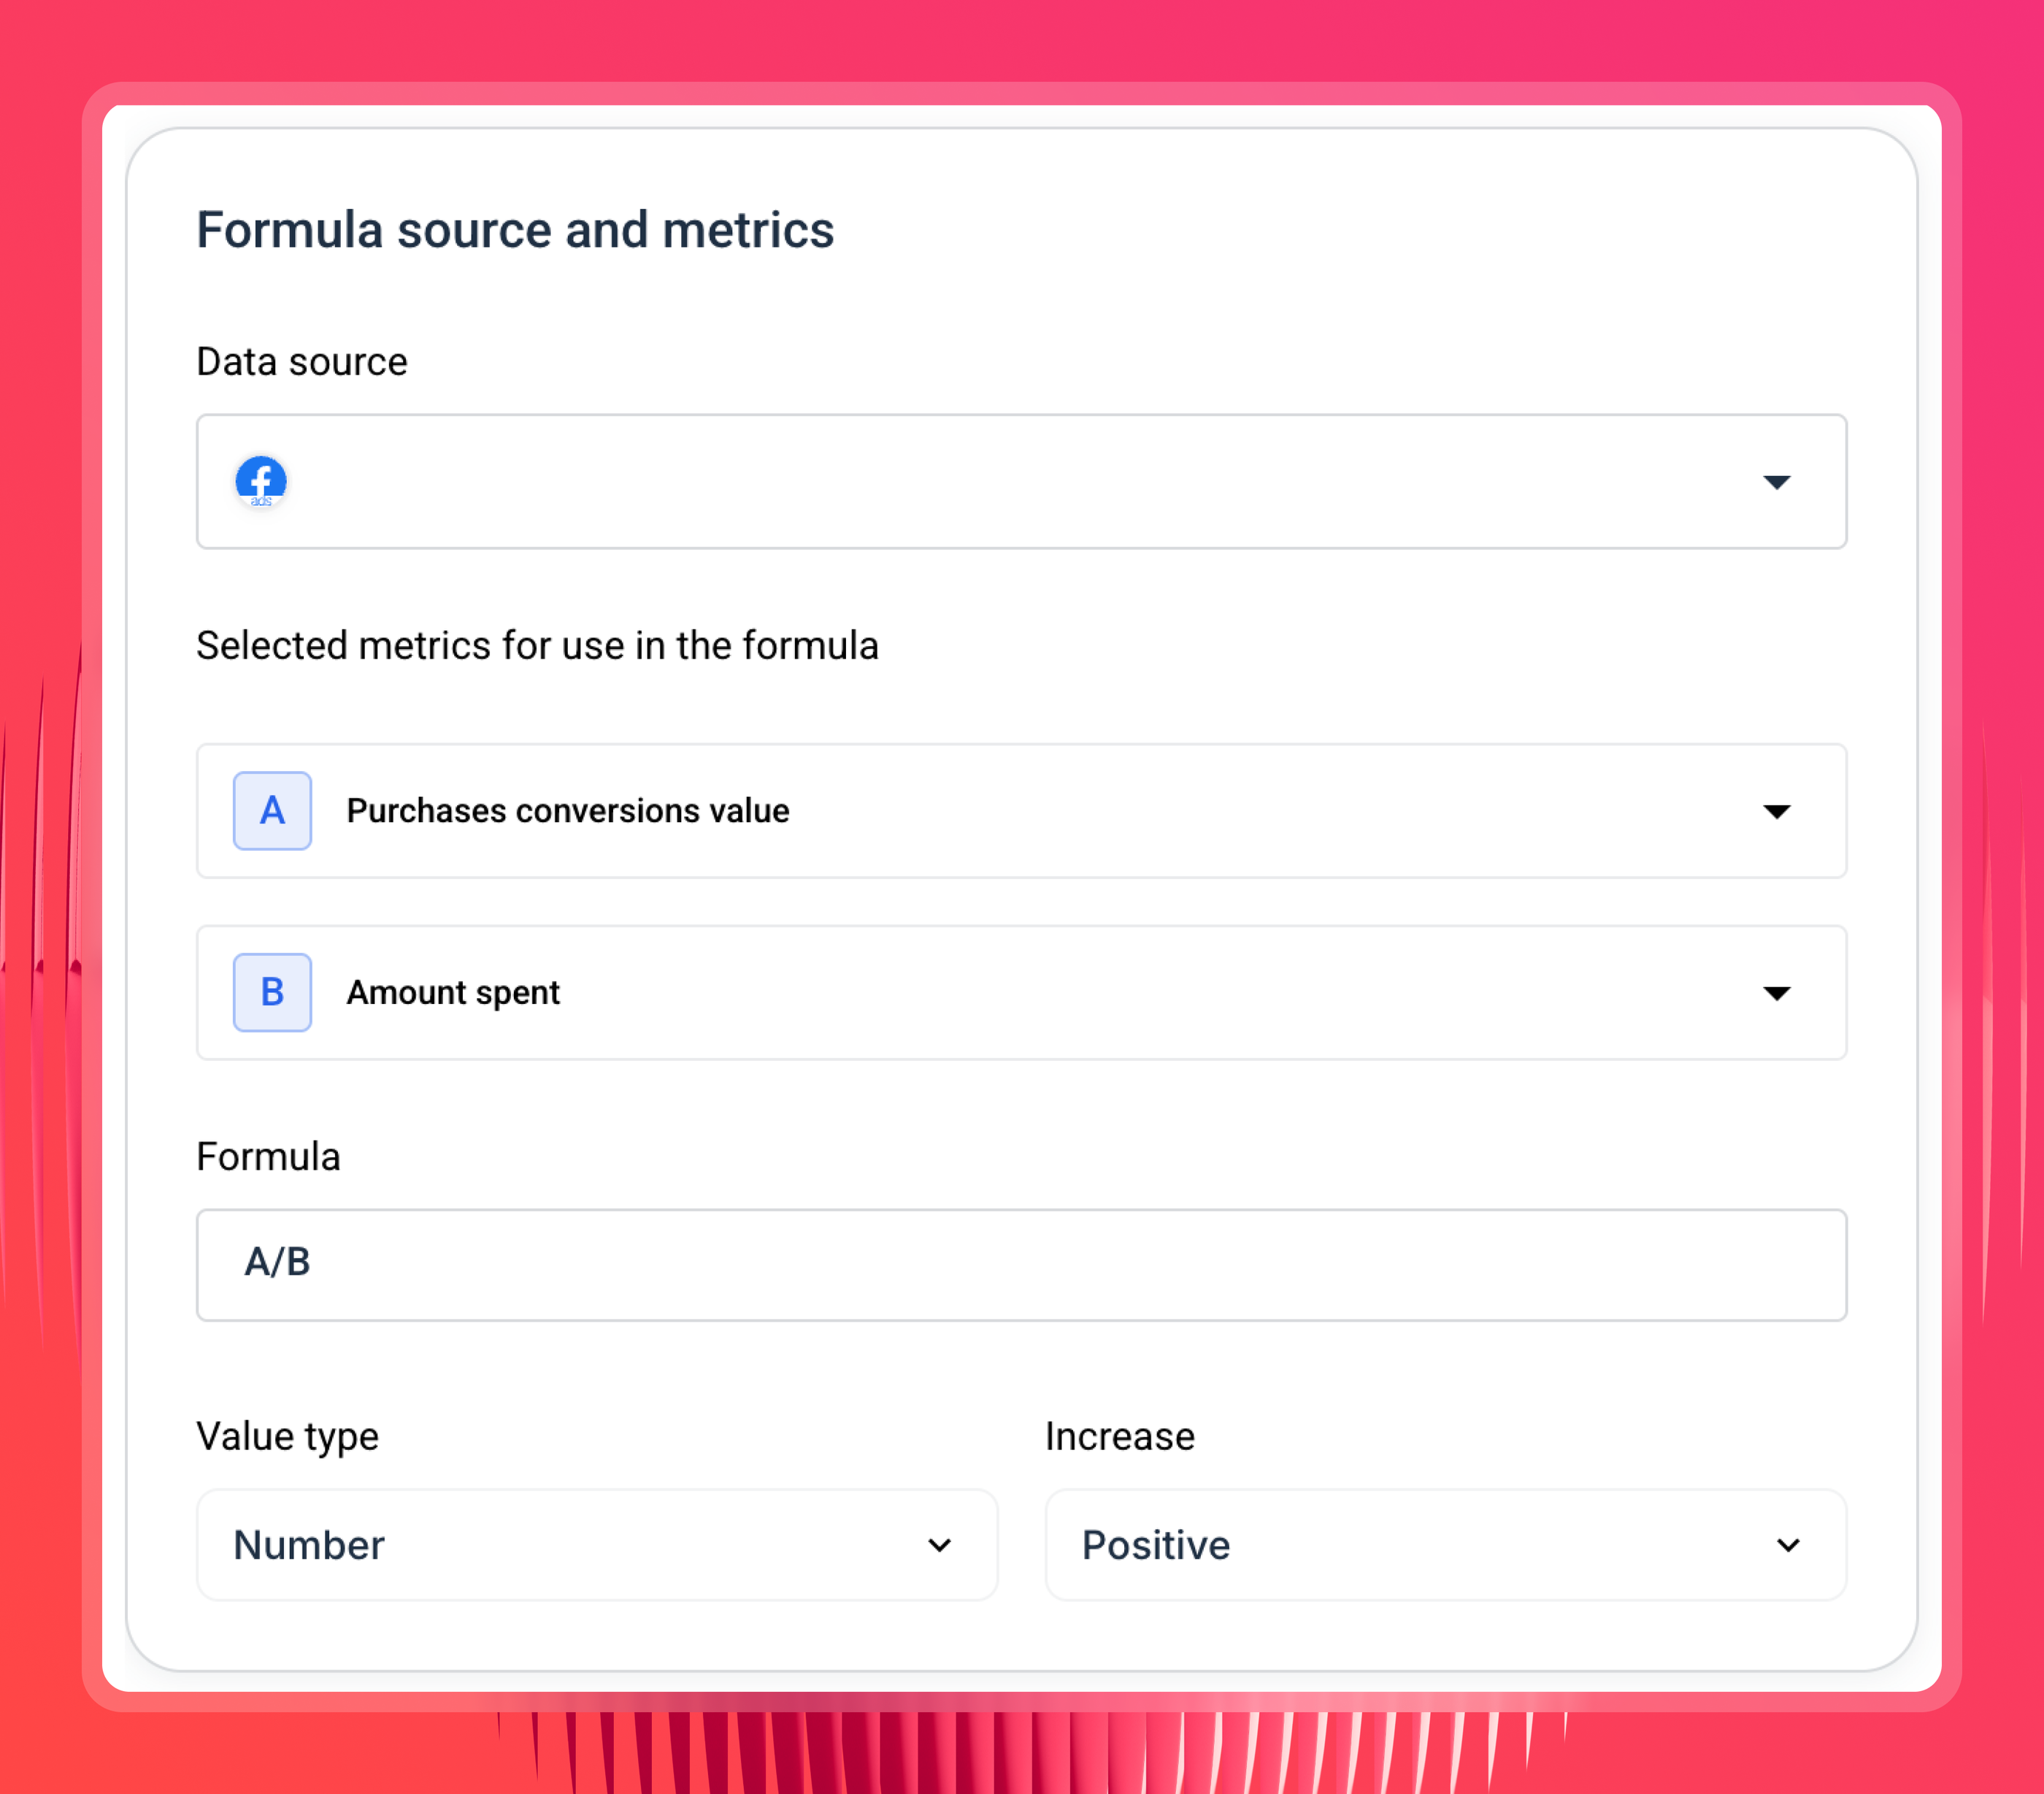
Then, you can apply this custom ROAS to all your reports, dashboards, and even AI tools like Claude or ChatGPT, so they always answer you back with your own definition of ROAS, not someone else's.
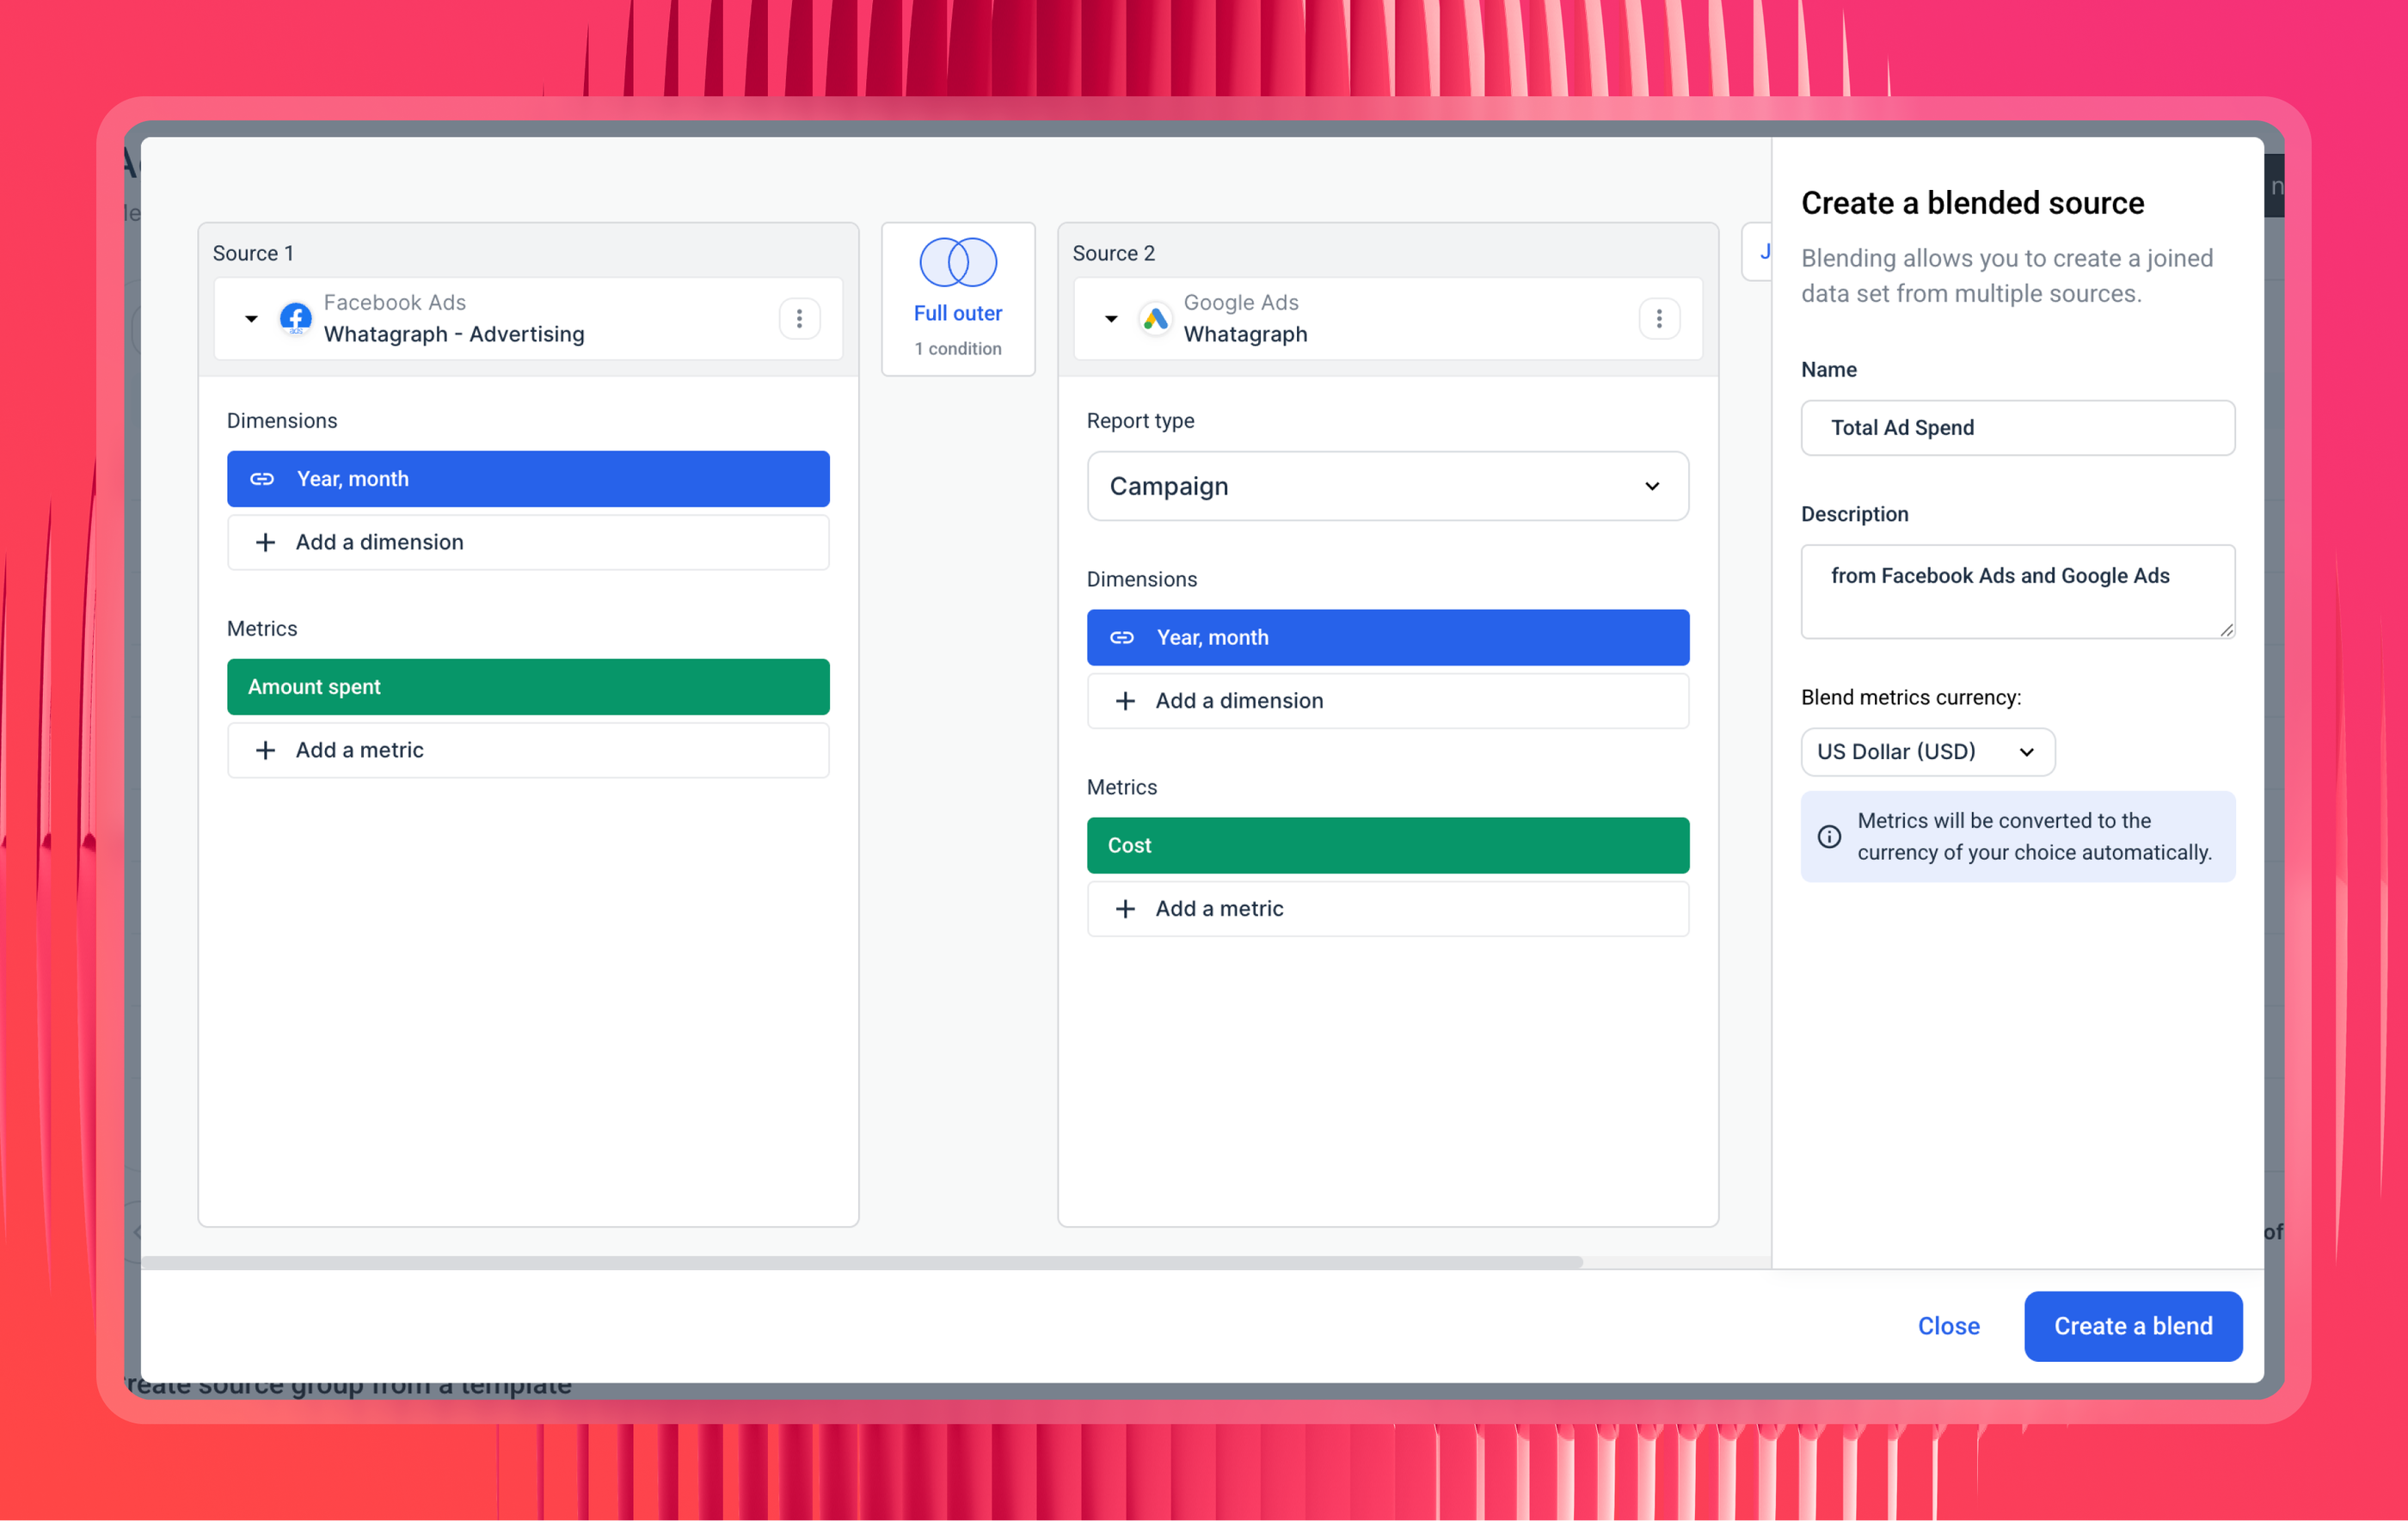
Want to combine Facebook Ads data with Google Ads or map conversions with Hubspot. You can do so with Blended Sources.
Or if you have dozens of sources and you want to report on them together, you'll love Source Groups. They let you combine multiple sources across diffeerent channels (e.g. Facebook Ads, Google Ads, and LinkedIn Ads) so you can:
- Aggregate metrics without custom formulas
- Report on cross-channel or single-source data more efficiently
- Keep your reporting organized and easier to manage
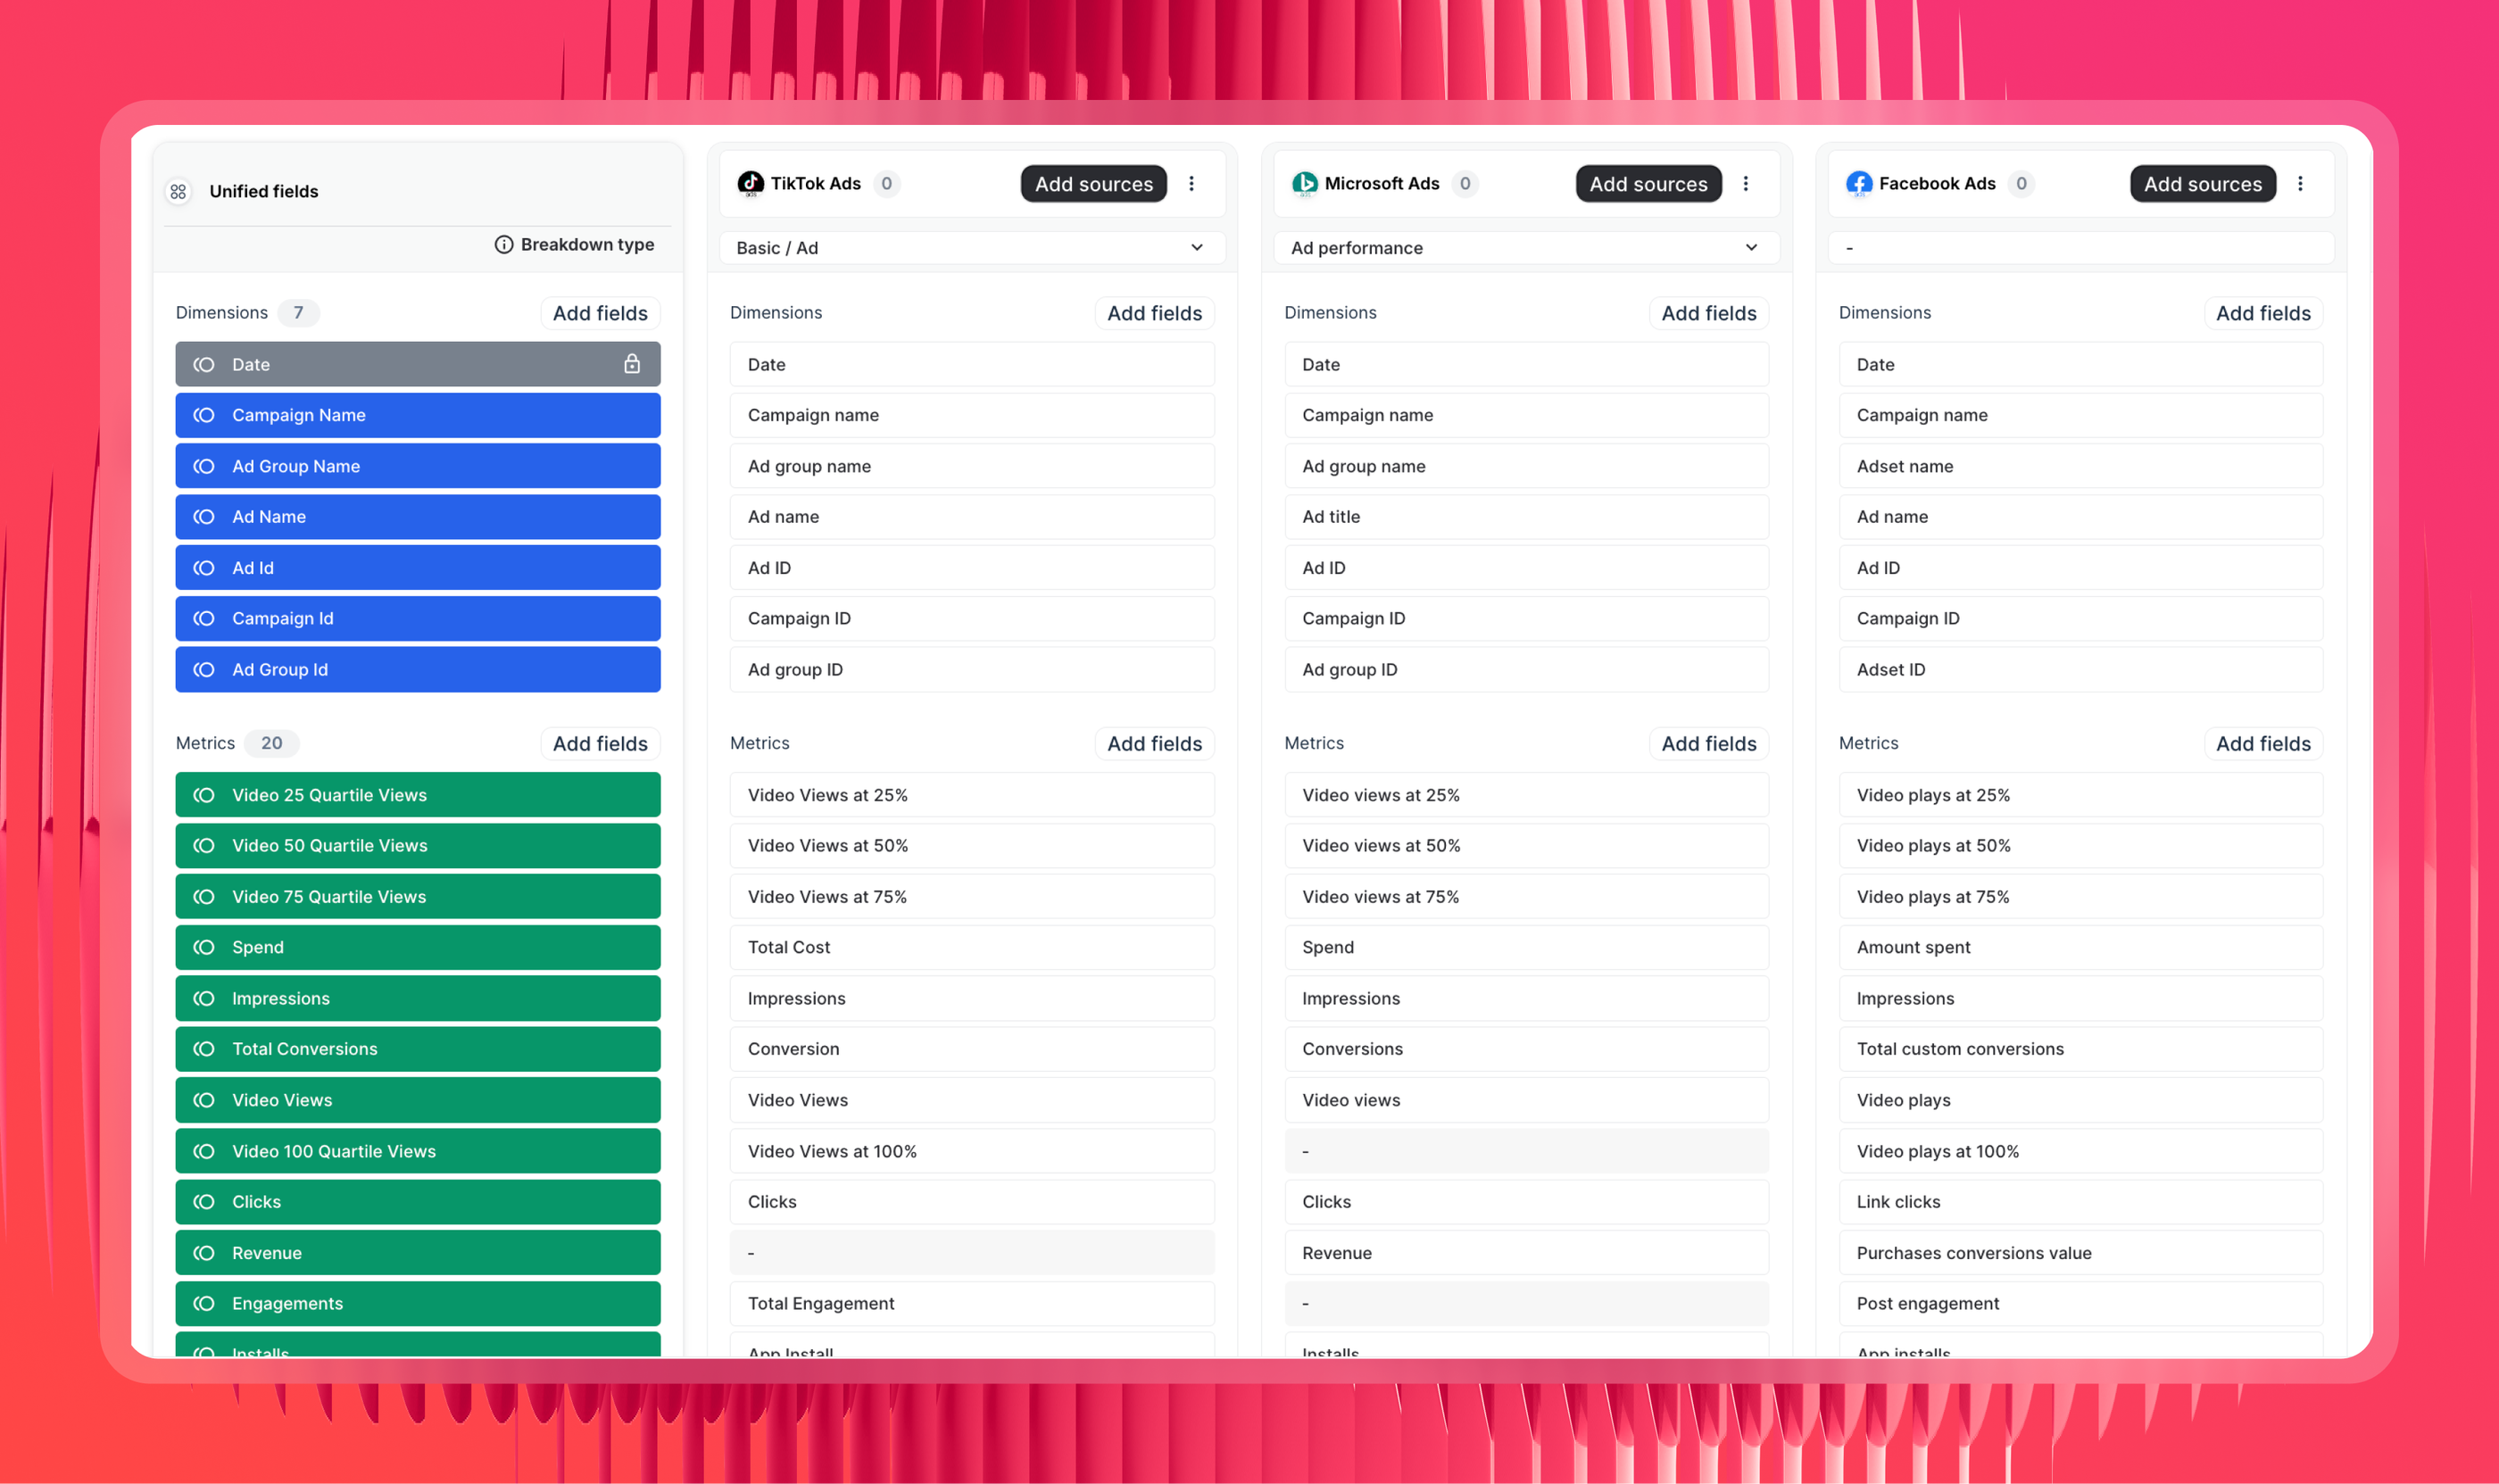
Again, you can add this blended data to your reports and dashboards, and push it to AI tools.
This means all your external-facing reports, internal dashboards, and AI analytics tools all share ONE cleaned definitions and dimensions according to what makes sense for your business. Any team member or stakeholder can ask the same question to Claude and get back the same answers without any hallucinations or calculations happening on the fly.
Facebook and Meta Ads benchmarks by industry
In WordStream’s Facebook traffic data, shopping, collectibles, and gifts posts the highest CTR at 4.13% and the lowest CPC at $0.34.
The lead campaigns redraw the map. For example, restaurants and food generate leads for $3.16 apiece, while dentists and dental services pay $76.71.
For ecommerce, Triple Whale’s nearly 35,000-brand dataset gives us a broader Meta view across Facebook and Instagram:
| Industry | CTR | CVR | CPA | ROAS |
|---|---|---|---|---|
| Apparel and accessories | 2.25% | 1.46% | $36.76 | 2.18 |
| Beauty | 2.27% | 1.94% | $37.92 | 1.57 |
| Home and garden | 2.22% | 1.32% | $46.46 | 2.18 |
| Food and beverage | 1.85% | 2.02% | $38.15 | 1.56 |
| Health and wellness | 2.70% | 1.72% | $38.55 | 1.50 |
| Sports and outdoors | 1.91% | 1.28% | $43.89 | 2.28 |
| Toys, art, and collectibles | 2.19% | 1.52% | $34.87 | 1.93 |
| Pets and animals | 2.13% | 1.80% | $38.18 | 1.58 |
| Electronics | 2.19% | 1.20% | $49.48 | 1.92 |
| Lifestyle and boutique | 2.28% | 1.74% | $29.99 | 1.93 |
| Baby | 1.91% | 1.85% | $30.04 | 2.17 |
| Automotive | 2.22% | 1.30% | $34.15 | 2.54 |
| Books and music | 2.34% | 1.72% | $30.25 | 1.65 |
| Media and publishing | 2.21% | 1.56% | $33.78 | 1.17 |
| Travel accessories and luggage | 2.19% | 1.29% | $48.37 | 2.25 |
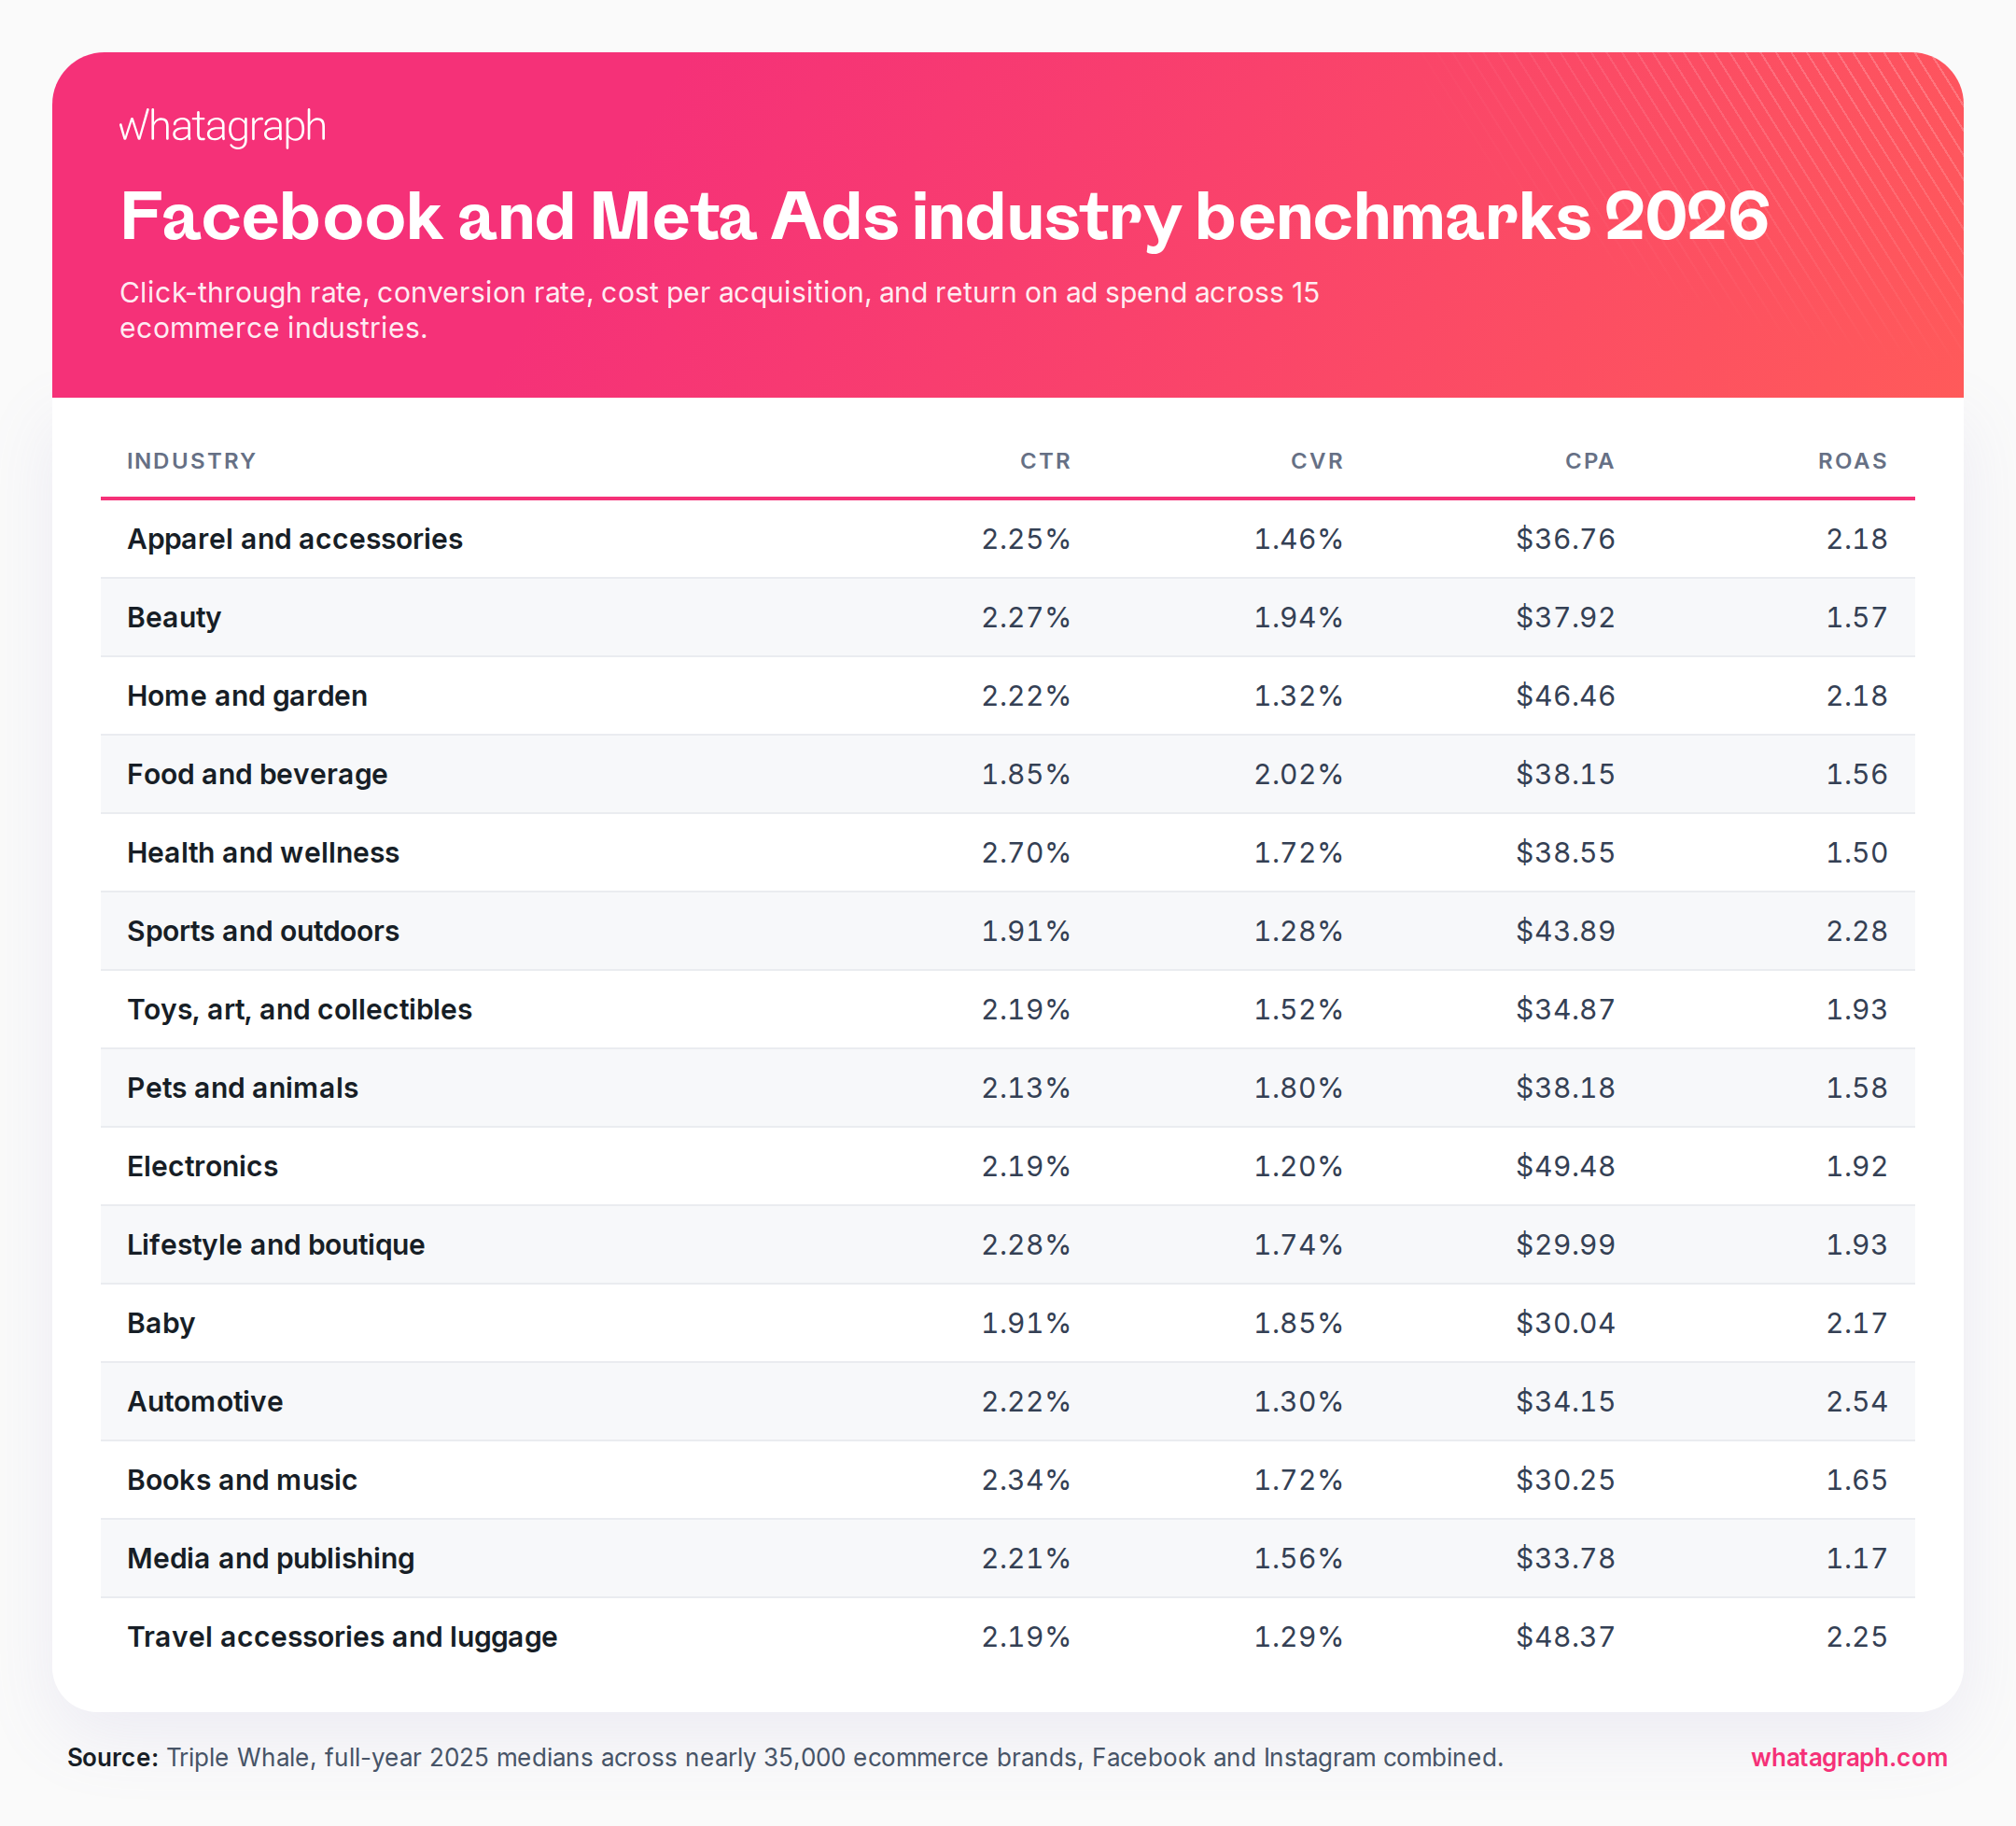
The table doesn’t produce one obvious winner; health and wellness has the highest CTR at 2.70%, but a 1.50 ROAS. The strongest click rate, conversion rate, and return belong to three different industries. That’s why a Meta benchmark works best as a row of connected numbers.
LinkedIn Ads benchmarks for 2026
What are the LinkedIn Ads benchmarks for 2026? Expect a CTR between 0.5% and 0.7%, a CPC between roughly $7 and $11, and a cost-per-mile (CPM) from about $40 to $78.
But Tthe real answer depends on whose LinkedIn you're advertising on.
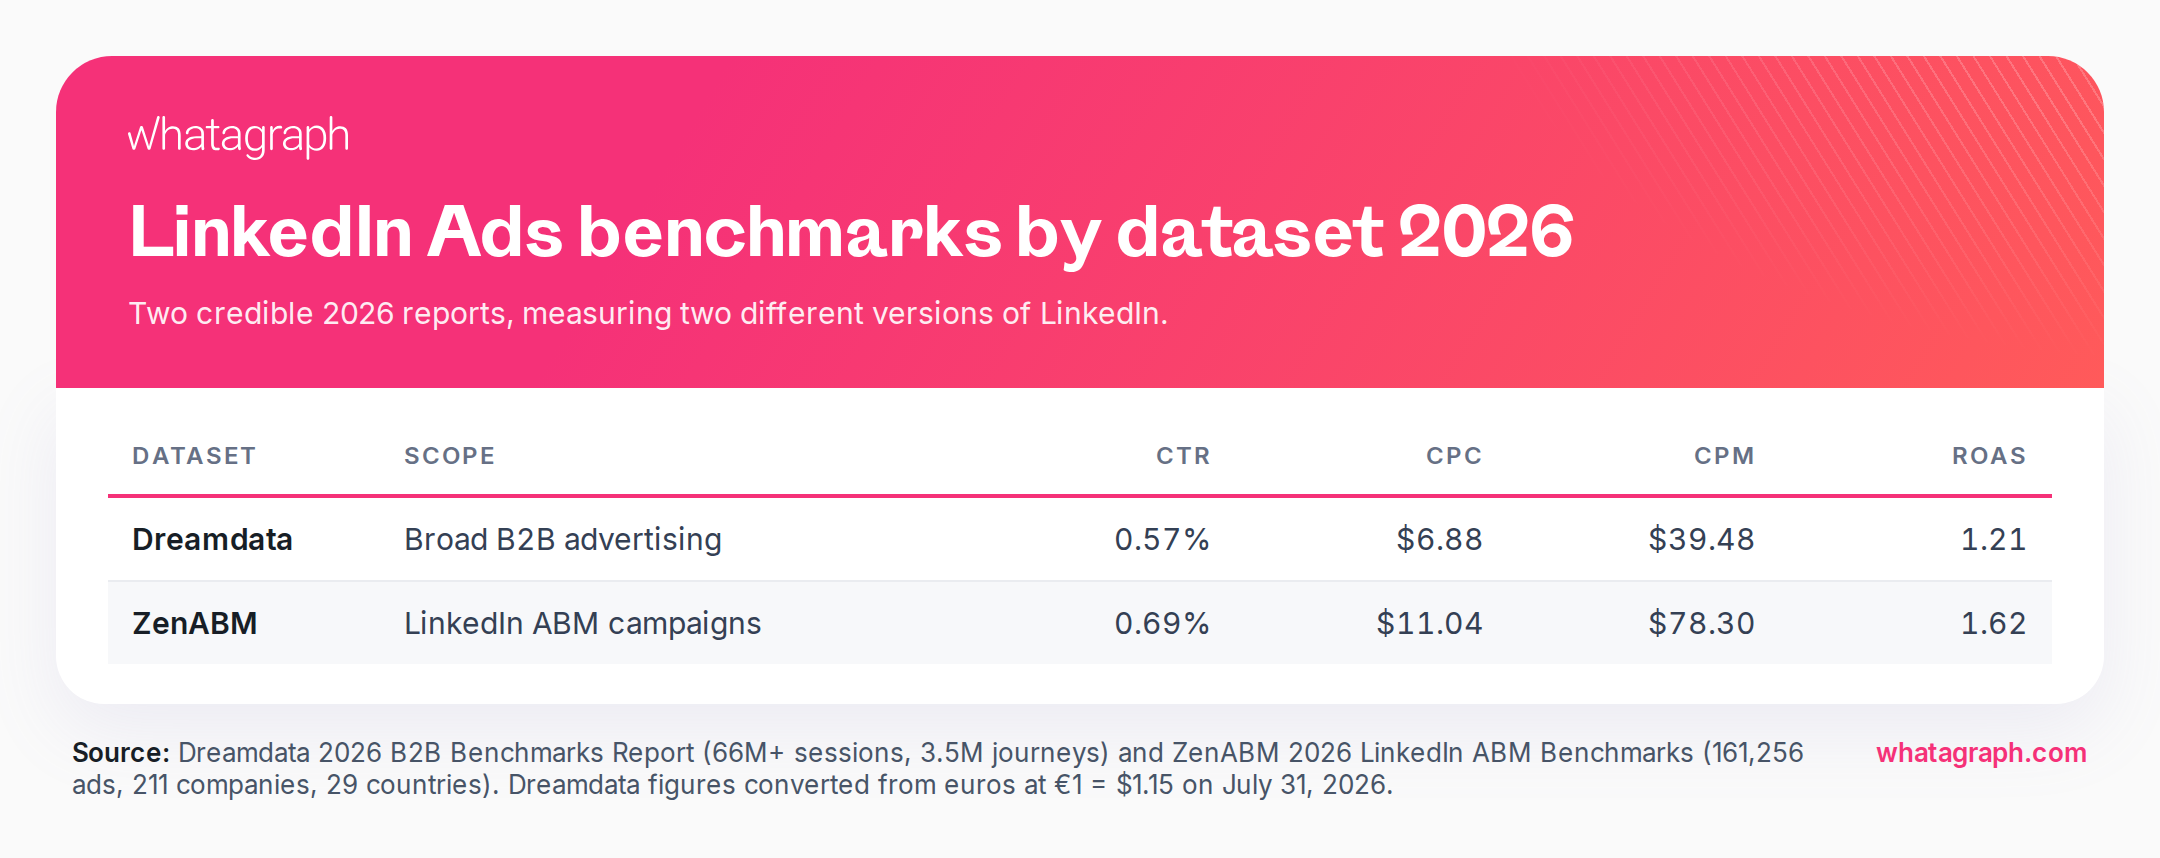
Dreamdata’s broad B2B dataset puts LinkedIn at a 0.57% CTR, $6.88 CPC, $39.48 CPM, and 1.21 ROAS. ZenABM’s account-based marketing data puts the typical company at a 0.69% CTR, $11.04 CPC, $78.30 CPM, and 1.62 ROAS.
Both are 2026 reports built from 2025 performance data, but they measure different versions of LinkedIn.
Dreamdata aggregates campaign and customer-journey data from thousands of B2B customers, covering more than 66 million sessions and 3.5 million journeys. ZenABM analyzes 161,256 ads from 211 companies across 29 countries, representing $5.5 million in LinkedIn ABM spend.
Note: Dreamdata reports monetary figures in euros. I converted them at €1 = $1.15 as of July 31, 2026 and rounded the results. The original values are in the report.
| Dataset | Scope | CTR | CPC | CPM | ROAS |
|---|---|---|---|---|---|
| Dreamdata | Broad B2B advertising | 0.57% | $6.88 | $39.48 | 1.21 |
| ZenABM | LinkedIn ABM campaigns | 0.69% | $11.04 | $78.30 | 1.62 |
What is a good CTR for LinkedIn Ads?
A broad LinkedIn CTR benchmark sits between 0.57% and 0.69% across the two reports. That’s a good first check, but ad format is arguably the better one.
ZenABM reports the following medians:
| LinkedIn ad format | CTR | CPC | CPM |
|---|---|---|---|
| Thought Leader Ads | 2.68% | $2.29 | $49.37 |
| Lead Gen Form ads | 0.45% | $12.33 | $75.59 |
| Single-image ads | 0.42% | $13.23 | $59.15 |
| Carousel ads | 0.32% | $13.30 | $45.28 |
| Document ads | 0.30% | $12.05 | $72.02 |
| Video ads | 0.24% | $15.61 | $38.94 |
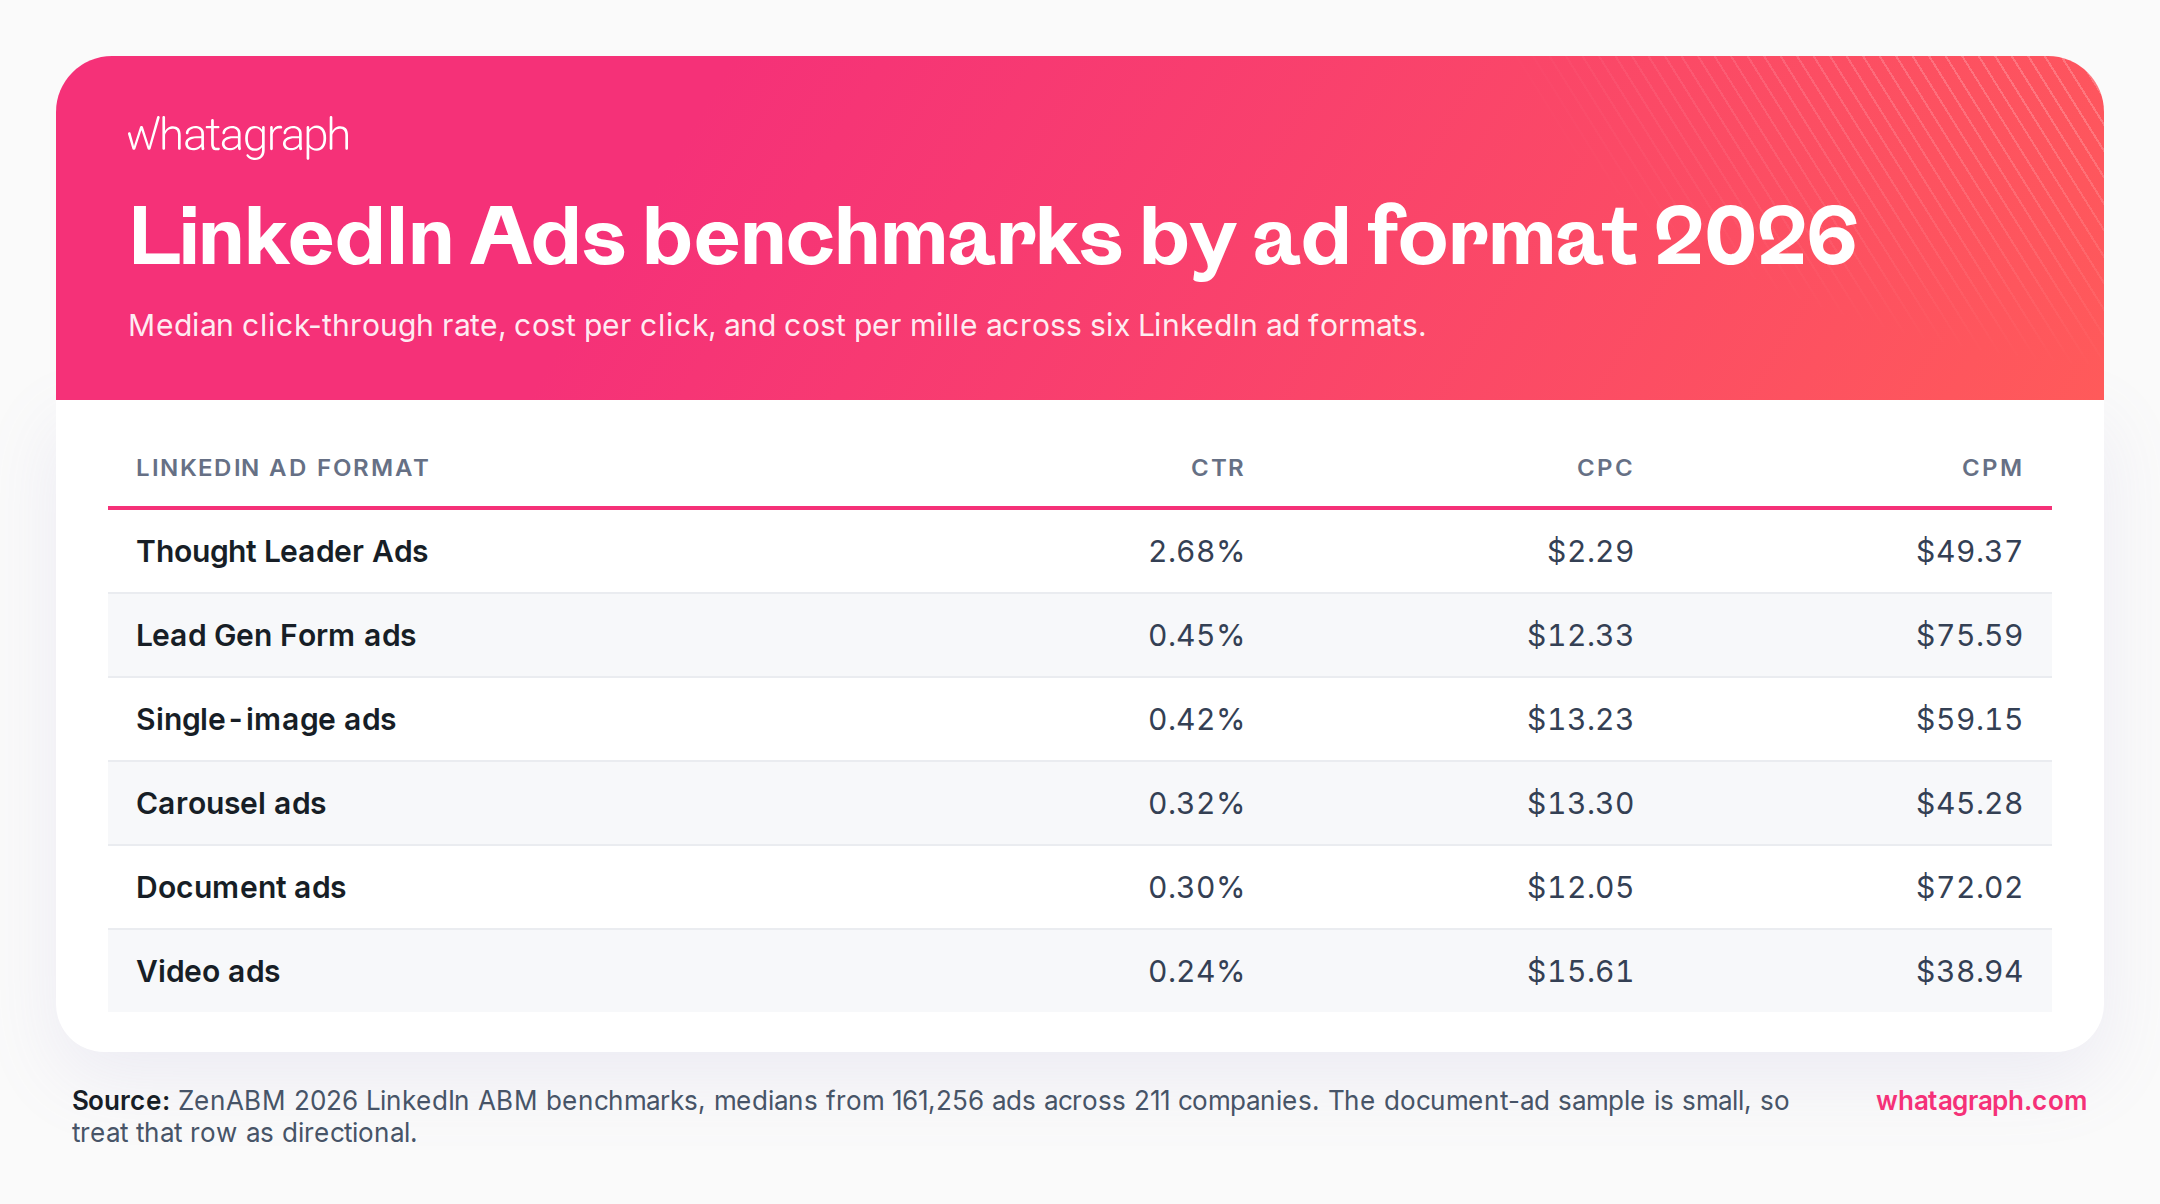
The document-ad sample is small, so treat that row as directional. See how Thought Leader Ads appear to flatten every other format at 2.68% CTR. Then you ask how many people left LinkedIn, and the median falls to 0.29% landing-page CTR.
What is a good CPC for LinkedIn Ads?
Dreamdata’s broad B2B data puts LinkedIn CPC at $6.88. ZenABM’s median for account-based campaigns is $11.04.
Even within one platform, “LinkedIn CPC” can describe two very different purchases. ZenABM’s top performers recorded a 0.21% CTR and $21.91 CPC, both worse than its typical company. They also generated $15.20 in influenced pipeline per ad dollar and a 2.79 ROAS.
ZenABM notes that high contract values help drive that performance, but the broader point holds: the click was expensive because the account behind it could be worth considerably more.
For LinkedIn, therefore, a good CPC reaches the intended companies and buying roles at a cost the eventual deal can support.
LinkedIn Ads ROAS benchmarks
Dreamdata reports a 1.21 LinkedIn ROAS, up from 1.13 the previous year. ZenABM records a higher median of 1.62 for LinkedIn ABM programs, rising to 2.79 among its top performers.
ZenABM also reports $5.21 in influenced pipeline per ad dollar for the typical company. Keep that separate from ROAS:
- Pipeline per dollar compares influenced opportunity value with ad spend.
- ROAS compares attributed closed revenue with ad spend.
The attribution method is important here too. Dreamdata calculates ROAS from closed-won deals over 12 months using a data-driven model, with impressions excluded and extreme outliers filtered. ZenABM, on the other hand, combines LinkedIn Campaign Manager and CRM data and uses impression-based attribution for influenced pipeline.
LinkedIn also might not make sense inside a monthly report. That’s because Dreamdata puts the average B2B customer journey at 272 days and the average time from a first LinkedIn ad impression to revenue at 281 days.
LinkedIn Ads industry benchmarks
The latest LinkedIn Ads benchmarks by industry come from ZenABM’s account-based advertising data. The detailed performance table reports averages rather than medians, so compare these rows with one another, not directly with the median account figures above.
| Industry | Average CTR | Average CPC | Average CPM |
|---|---|---|---|
| Software development | 1.09% | $10.95 | $70.14 |
| IT services and consulting | 1.04% | $11.62 | $69.25 |
| Advertising services | 1.08% | $12.77 | $65.06 |
| Technology, information, and internet | 1.31% | $8.70 | $74.20 |
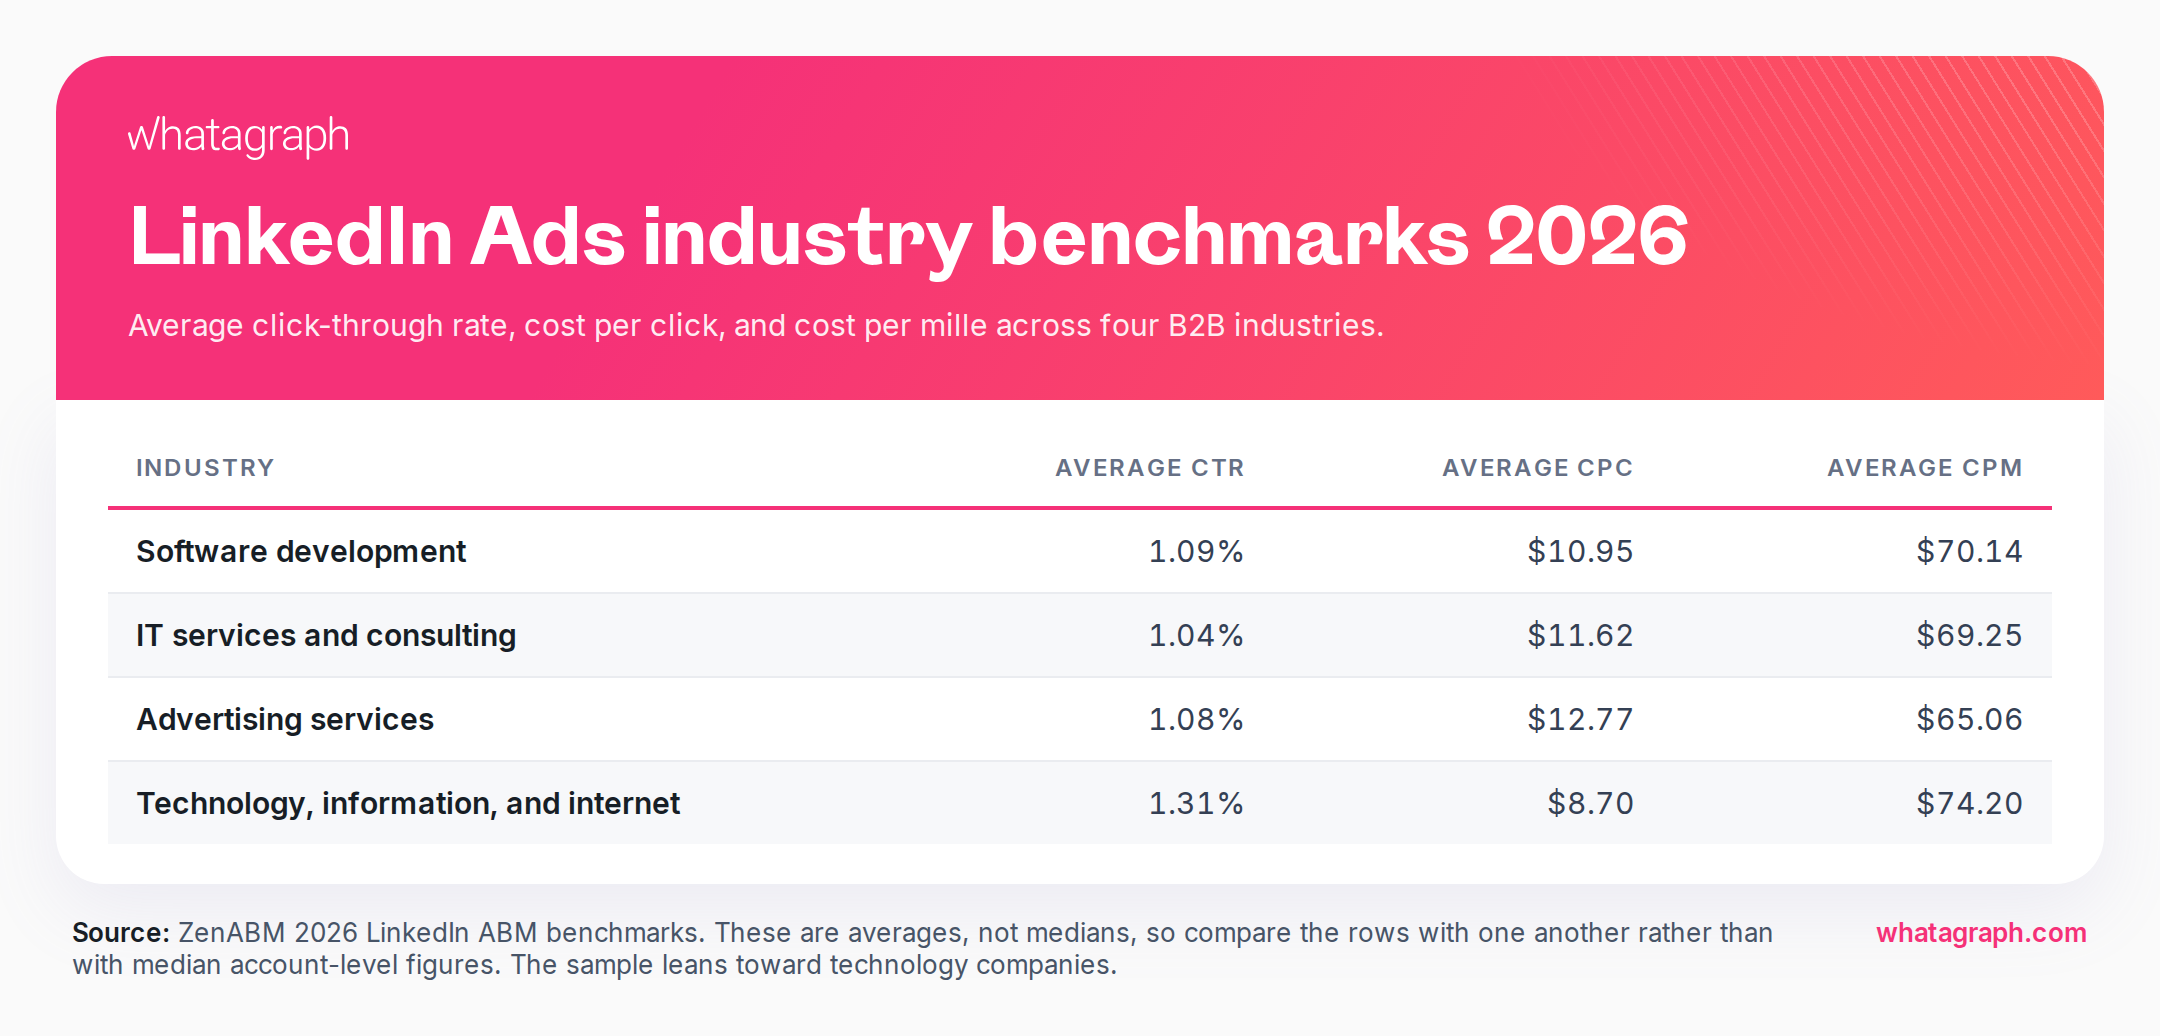
ZenABM’s sample leans toward technology companies, so these LinkedIn Ads industry benchmarks are most useful for B2B technology and services teams running formal ABM programs.
The down-funnel sample becomes thinner still. For example, software development is the only named industry for which ZenABM publishes a dedicated pipeline-efficiency cut: a median 1.63 ROAS and $6.89 in influenced pipeline per ad dollar.
The unit changes the verdict.
In Dreamdata’s dataset, LinkedIn has the lowest cost per company influenced: $80.63, compared with $148.01 for Meta and $126.93 for Google Search. The report also finds that the average B2B deal involves 10 stakeholders.
The other problem is that LinkedIn doesn’t travel alone in a B2B report.
The numbers sit beside Google Ads, and somewhere above both is a single CPL or CAC target. Then the definitions start to drift. LinkedIn counts a Lead Gen Form submission; Google imports a qualified lead from the CRM; and one region waits for a booked demo; another reports the form fill.
Each number may be correct inside its own dashboard, but together, they’re one column with three meanings.
Whatagraph’s Source Groups can bring LinkedIn and Google Ads accounts, or several regional accounts, into one reporting view. Custom Metrics let you define CPL or CAC once and use the same formula and name wherever that data appears.
Change the definition later, and you update the metric rather than rebuilding every report.
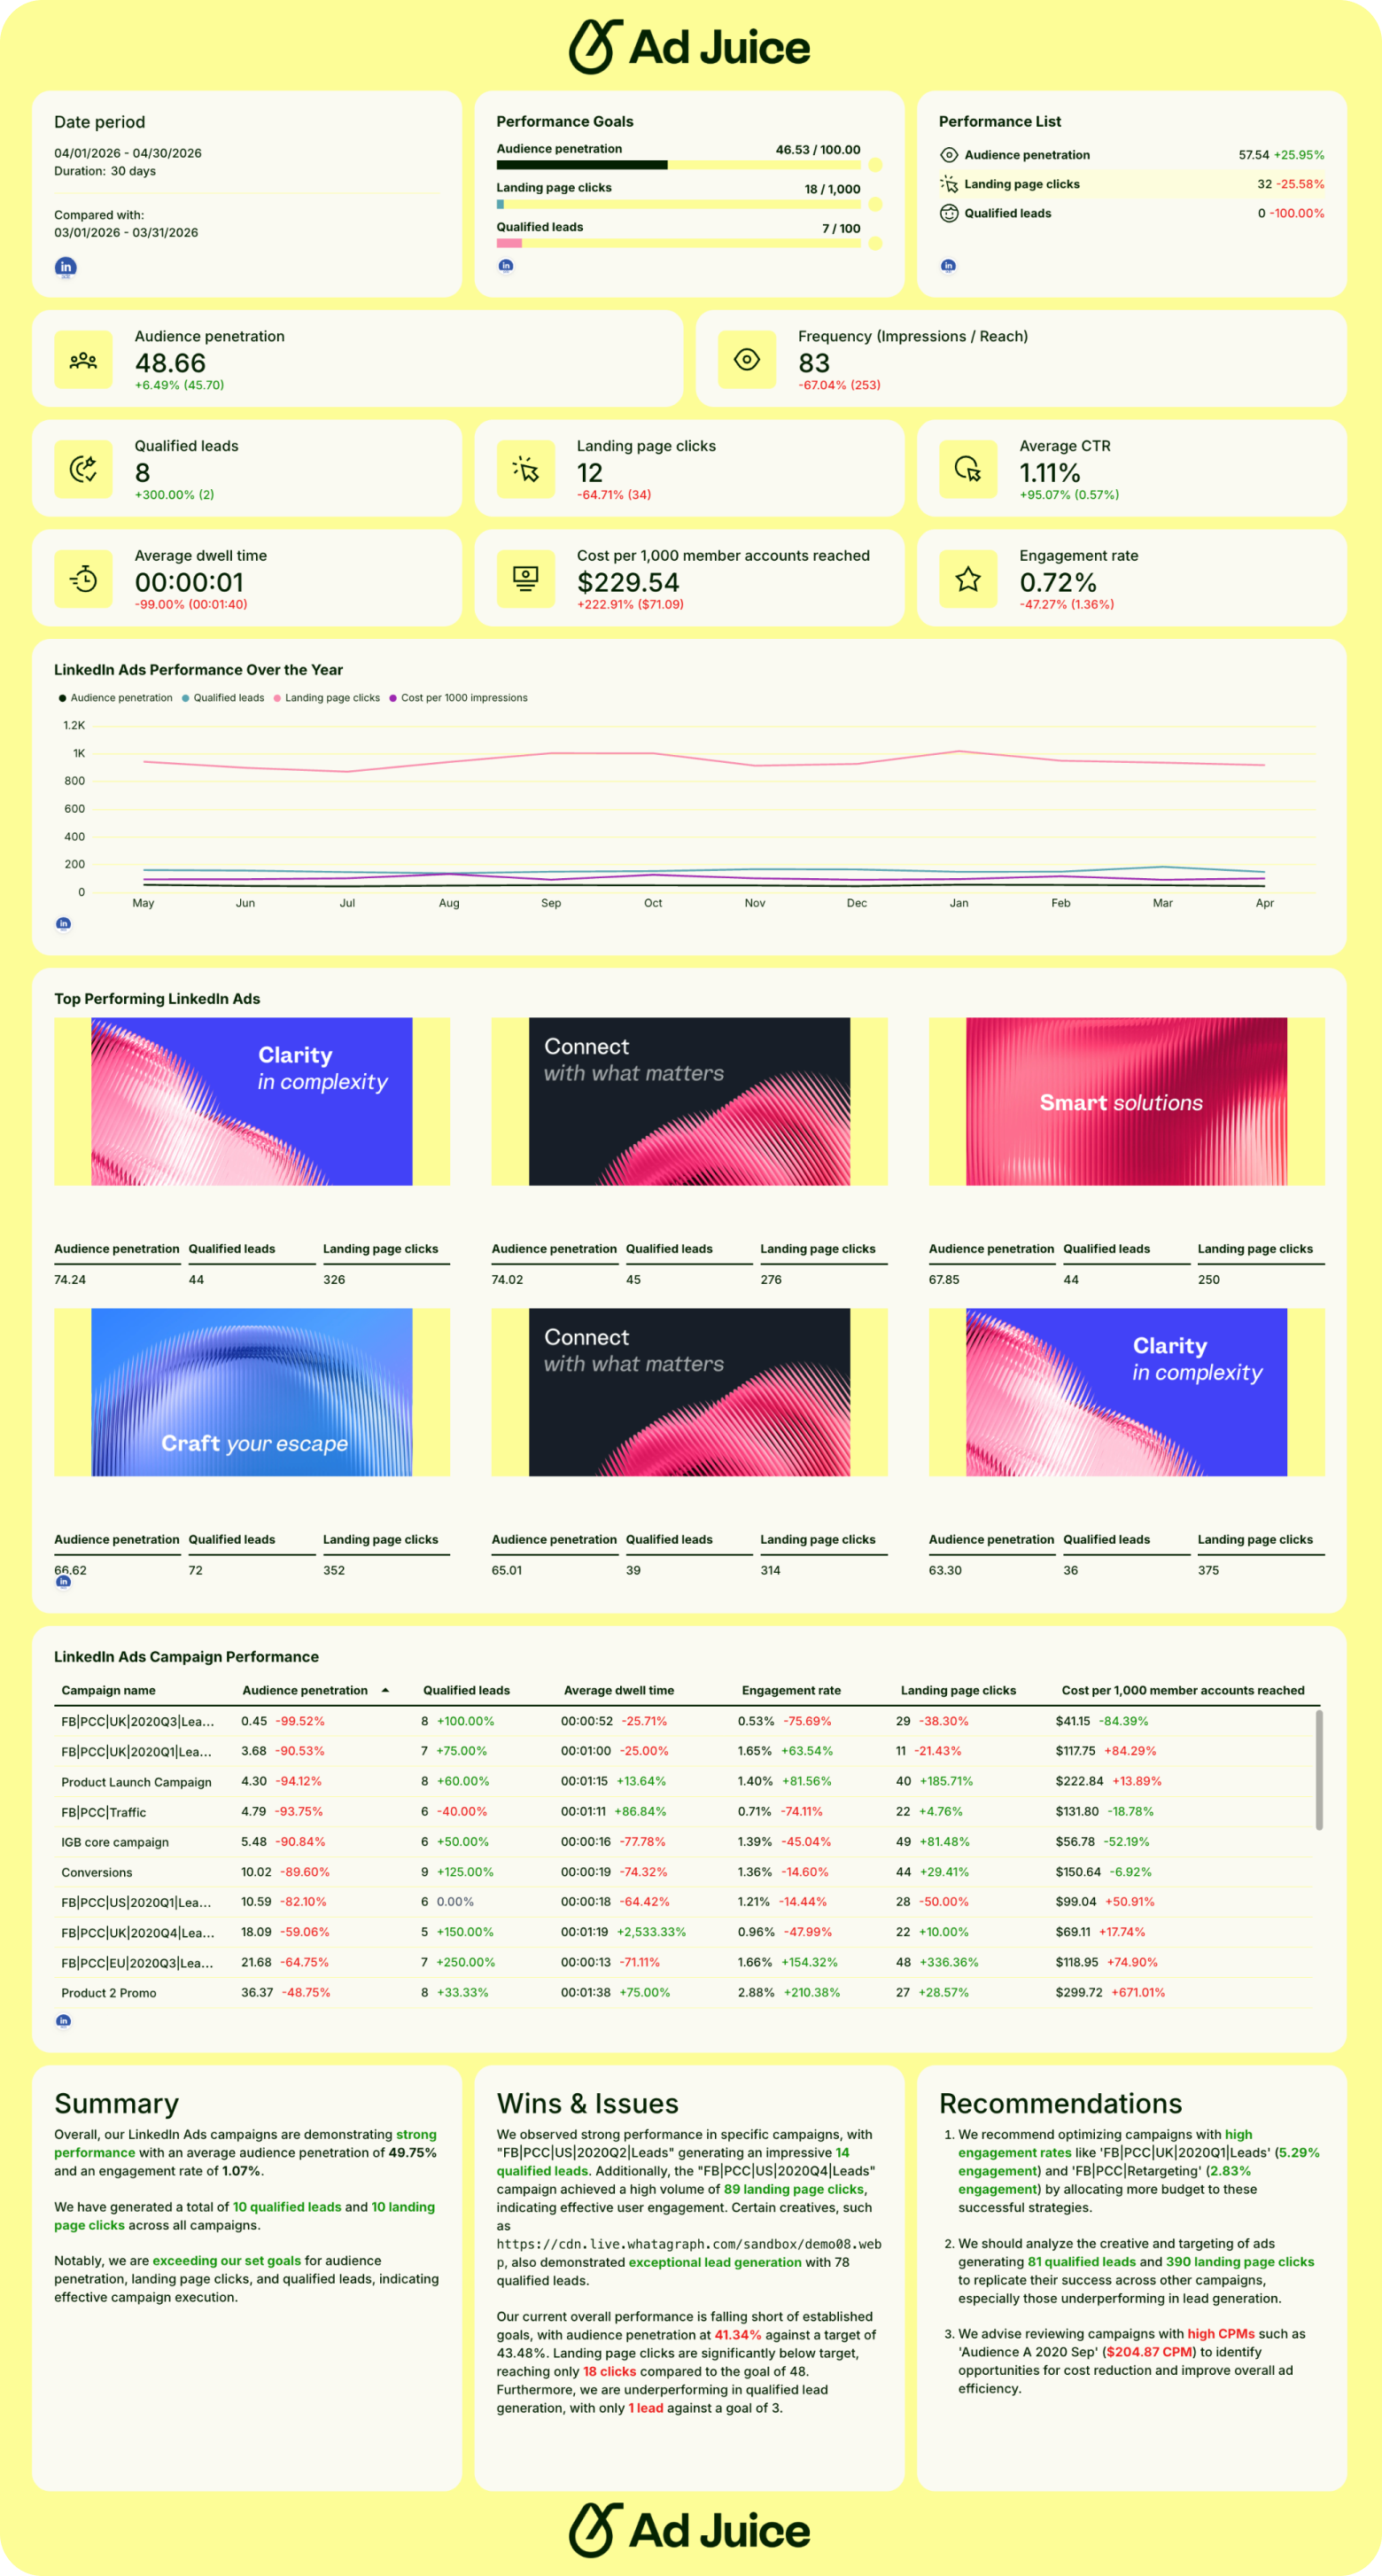
Want a report template to get started with? Check out this LinkedIn Ads report co-created with Patrick Cumming, Founder at Ad Juice agency.
Bing/Microsoft Ads benchmarks for 2026
First, the name. Bing Ads became Microsoft Advertising in 2019, but a lot of PPC marketers still call it Bing out of habit, so Bing it is.
Even then, Bing is shorthand. Microsoft Search campaigns can also run across partner sites such as Yahoo, AOL, DuckDuckGo, and Ecosia, depending on your settings. Your account-wide benchmark may therefore include more than Bing traffic.
Second, you’ve already seen the largest current search benchmark dataset that includes Microsoft Ads. LocaliQ’s $5.42 CPC and 6.64% CTR blend Google and Microsoft campaigns, with roughly 15%-20% of the budget going to Microsoft. That’s useful context, but not a clean Bing number.
Is Bing Ads cheaper than Google Ads?
In BrightBid’s current B2B comparison, yes.
| Metric | Bing Ads | Google Ads | What’s the difference? |
|---|---|---|---|
| Average click-through rate | 3.10% | 3.25% | Google is higher by 0.15 percentage points. |
| Average cost-per-click | $1.45 | $2.85 | Bing is 49% cheaper. |
| Average conversion rate | 3.50% | 4.10% | Google is higher by 0.60 percentage points. |
| Average cost per acquisition | $38.50 | $48.00 | Bing is 20% cheaper. |
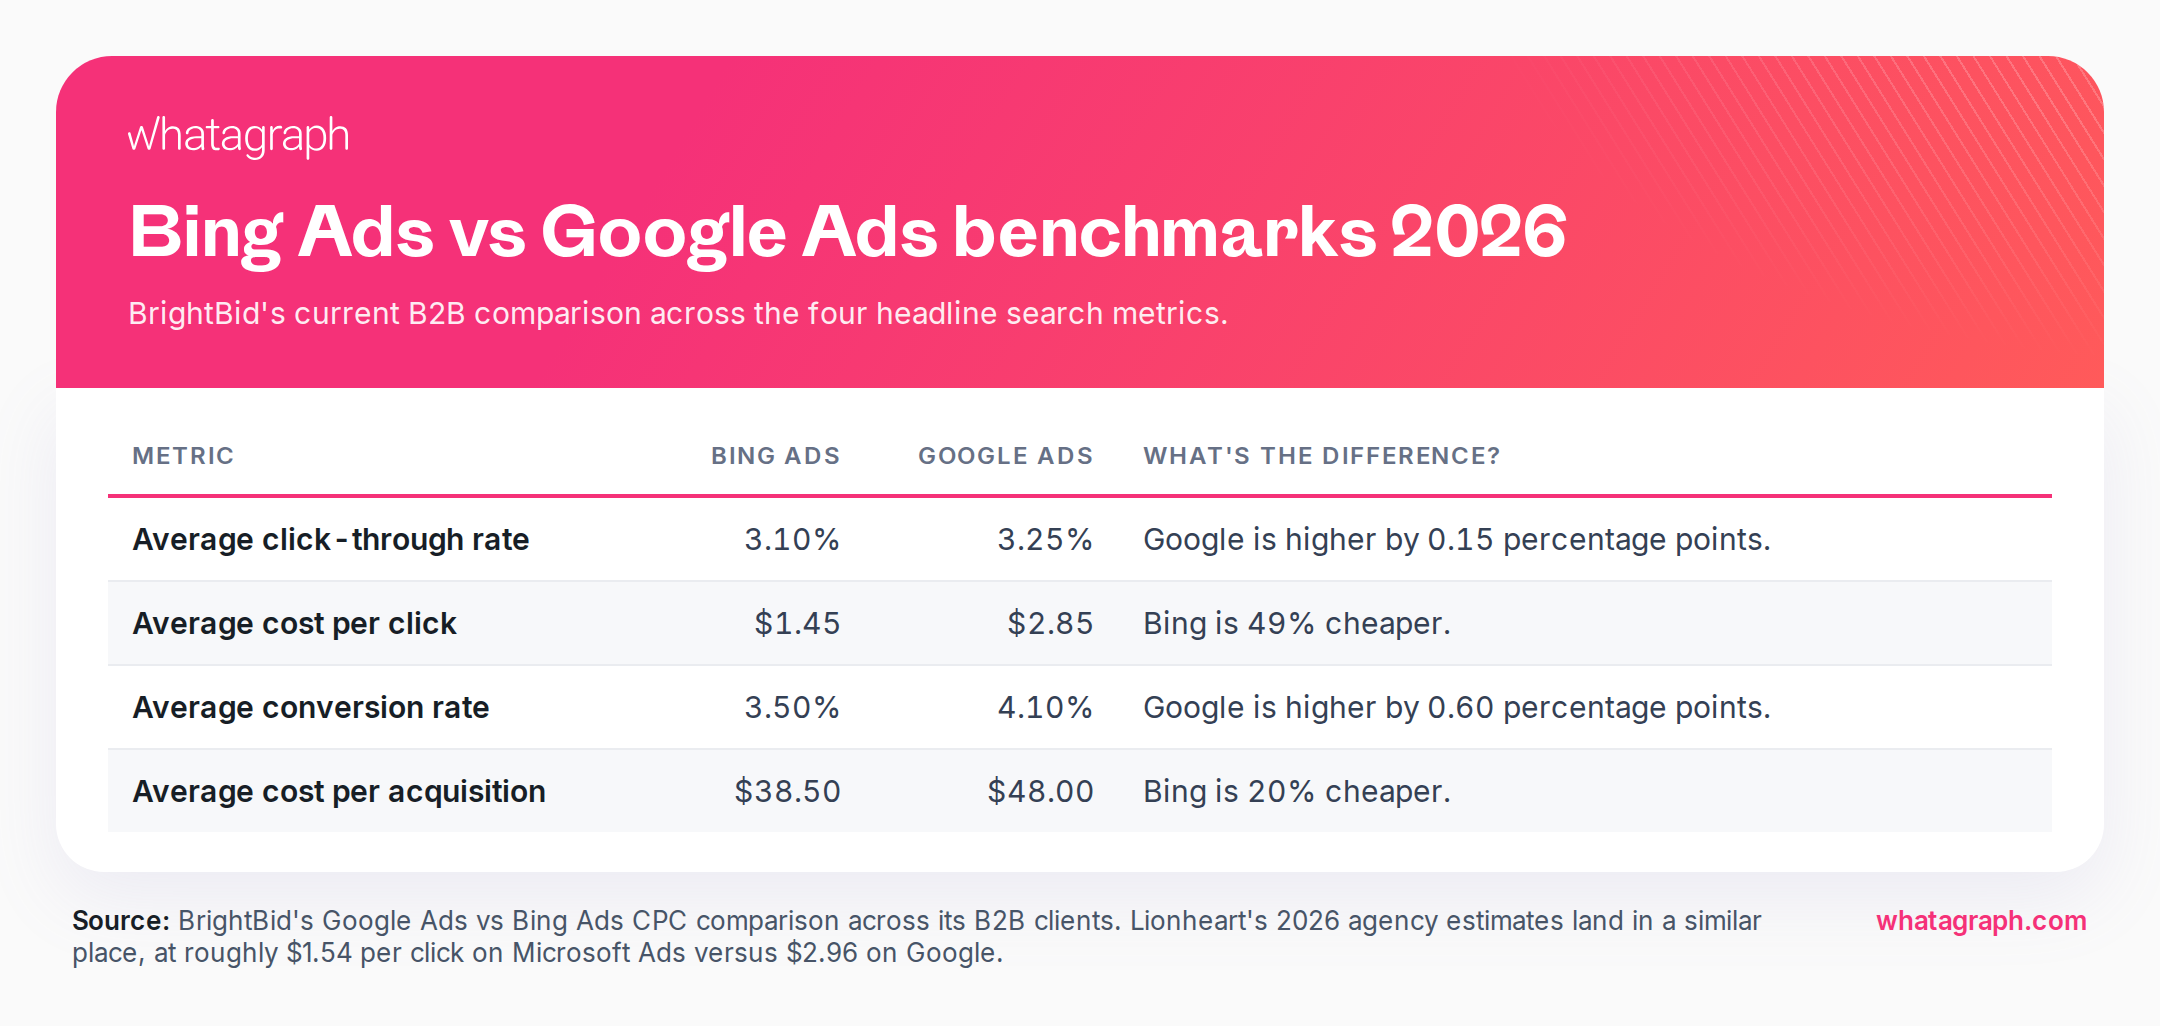
Google won the engagement and conversion-rate columns, but only narrowly. Bing’s cheaper auction more than covered the gap, leaving it with a 20% lower acquisition cost.
Lionheart’s 2026 agency estimates land in much the same place, at approximately $1.54 per click on Microsoft Ads versus $2.96 on Google. The agency estimates that Microsoft CPCs run 33%-60% lower for comparable keywords.
The answer, then, is not that Bing is always cheaper; it’s that the best current side-by-side data gives you good reason to test whether it’s cheaper for the same searches in your own account.
Bing Ads CPC benchmarks
A practical 2026 Bing Ads CPC benchmark is roughly $1.45 to $1.54 in the two current agency datasets available. BrightBid reports $1.45 across its B2B clients.
But industry, device, and competition can move that figure quickly. For instance, Lionheart estimates that legal keywords costing $8-$14 on Google may cost $5-$9 on Microsoft.
Why is the auction cheaper at all? Because it's emptier; agencies put Microsoft's share of typical search budgets at around 6%, and both Lionheart and BrightBid, independently, recommend allocating 10%-25% of search spend to it.
Microsoft also has a specific B2B advantage. You can use LinkedIn profile data to adjust bids by company, industry, or job function, and it lets you bid differently when Microsoft recognizes someone in the group.
That's search-priced clicks for audiences that cost $11.04 apiece on LinkedIn itself, per ZenABM's data earlier in this guide. The trade-off is device. Bing's audience lives overwhelmingly on desktop, so mobile-heavy categories should stay Google-weighted.
Google and Bing are easiest to compare while they’re still in a table. Once the campaigns are live, the numbers retreat to separate dashboards.
A blended CPC must divide total Google and Microsoft spend by their combined clicks, while a blended conversion rate must divide combined conversions by combined clicks.
Whatagraph’s Source Groups can bring Google Ads and Microsoft Advertising accounts into one cross-channel view and aggregate the metrics they share. When campaign dimensions or fields need to be matched more deliberately, a Blended Source can merge them into one structured dataset.
Bing Ads CTR benchmarks
The most defensible current figure here is BrightBid’s 3.10% CTR for Microsoft Ads, compared with 3.25% for Google in the same B2B dataset.
You’ll also see 2.83% quoted as the average Bing Ads CTR. That number comes from WordStream’s platform-specific study published in 2017. That’s useful historical context, but it’s not a 2026 benchmark.
TikTok Ads benchmarks for 2026
Triple Whale’s full-year 2025 ecommerce data puts TikTok at a 1.77% CTR, $13.26 CPM, 2.01% conversion rate, $32.74 CPA, and 2.21 ROAS.
WordStream’s broader 2026 cost guide offers directional ranges instead: $0.30 to $1.50 per click, $4 to $10 per 1,000 impressions, and $0.01 to $0.07 per video view.
Which KPIs should you track for TikTok advertising?
TikTok’s reporting glossary organizes creative performance around 2-second video views, 6-second views, completion thresholds at 25%/50%/75%/100%, and average play time.
| KPI | The question it answers |
|---|---|
| Two-second video views | Did the opening frame, line, or visual stop the scroll? |
| Six-second video views | Did viewers stay beyond the initial hook? |
| Views at 25%, 50%, 75%, and 100% | At what point did viewers begin to leave? |
| Average play time | How long did the average viewer keep watching? |
| CTR and CPC | Did that attention produce site traffic, and what did each click cost? |
| CVR and CPA | Did those clicks convert, and at what cost? |
| ROAS | Did the attributed revenue justify the ad spend? |
Note that hook rate and hold rate aren't native TikTok metrics. TikTok Ads Manager gives you the inputs, including 2-second views, 6-second views, and completion checkpoints, and then you build the ratios yourself. That means every hook rate you've ever been shown was somebody else’s calculation.
But TikTok’s standard six-second view can also count:
- A video shorter than six seconds that was completed.
- An engagement during the first six seconds.
The hook rate is often calculated as 2-second video views divided by impressions. TikTok counts a 2-second view when the video plays at least two seconds within a single impression, replays excluded, so the ratio reads cleanly as a scroll-stop test.
But the hold rate is where reports diverge. While some teams divide 6-second views by 2-second views, others divide views-at-25%-completion by 2-second views.
TikTok publishes the definitions, but not a credible all-industry benchmark for hook or hold rate. For those derived KPIs, your own rolling median, segmented by objective, audience, and video length, is the more defensible comparison.
TikTok cost and conversion benchmarks
Triple Whale’s 2025 ecommerce data shows TikTok becoming better at generating clicks and less efficient at turning them into revenue:
| Metric | 2025 benchmark | Year-over-year change |
|---|---|---|
| CTR | 1.77% | +13.74% |
| CPM | $13.26 | +16.00% |
| Conversion rate | 2.01% | –6.20% |
| CPA | $32.74 | +8.64% |
| ROAS | 2.21 | –5.70% |
| AOV | $74.12 | +2.68% |
More people clicked, but a smaller share converted. Where reach became more expensive, CPA rose, and ROAS fell.
That’s also why a 2.21 ROAS shouldn’t be read as TikTok’s passing grade. The number is the top-line result for ecommerce brands in this particular dataset. Whether it works for you depends on margin, customer lifetime value, returns, and fees.
TikTok Ads benchmarks by industry
Triple Whale presents the industry figures as medians. The top-line figures use a different aggregate cut, so the vertical rows will not necessarily reconcile with the overall benchmark:
| Industry | CTR | CPM | CVR | CPA | ROAS |
|---|---|---|---|---|---|
| Apparel and accessories | 0.69% | $4.24 | 2.37% | $21.85 | 2.49 |
| Beauty | 0.58% | $5.28 | 2.19% | $18.82 | 0.74 |
| Home and garden | 0.68% | $5.69 | 2.42% | $21.36 | 1.97 |
| Food and beverage | 0.58% | $6.33 | 2.17% | $19.84 | 0.49 |
| Toys, art, and collectibles | 0.58% | $4.56 | 2.38% | $20.94 | 1.55 |
| Sports and outdoors | 0.52% | $3.79 | 1.49% | $19.83 | 1.39 |
| Electronics | 0.73% | $5.17 | 1.85% | $31.25 | 1.68 |
| Health and wellness | 0.57% | $5.34 | 1.68% | $16.87 | 0.72 |
| Pets and animals | 0.49% | $5.21 | 1.91% | $13.46 | 0.08 |
| Lifestyle and boutique | 0.57% | $4.25 | 2.16% | $25.43 | 1.88 |
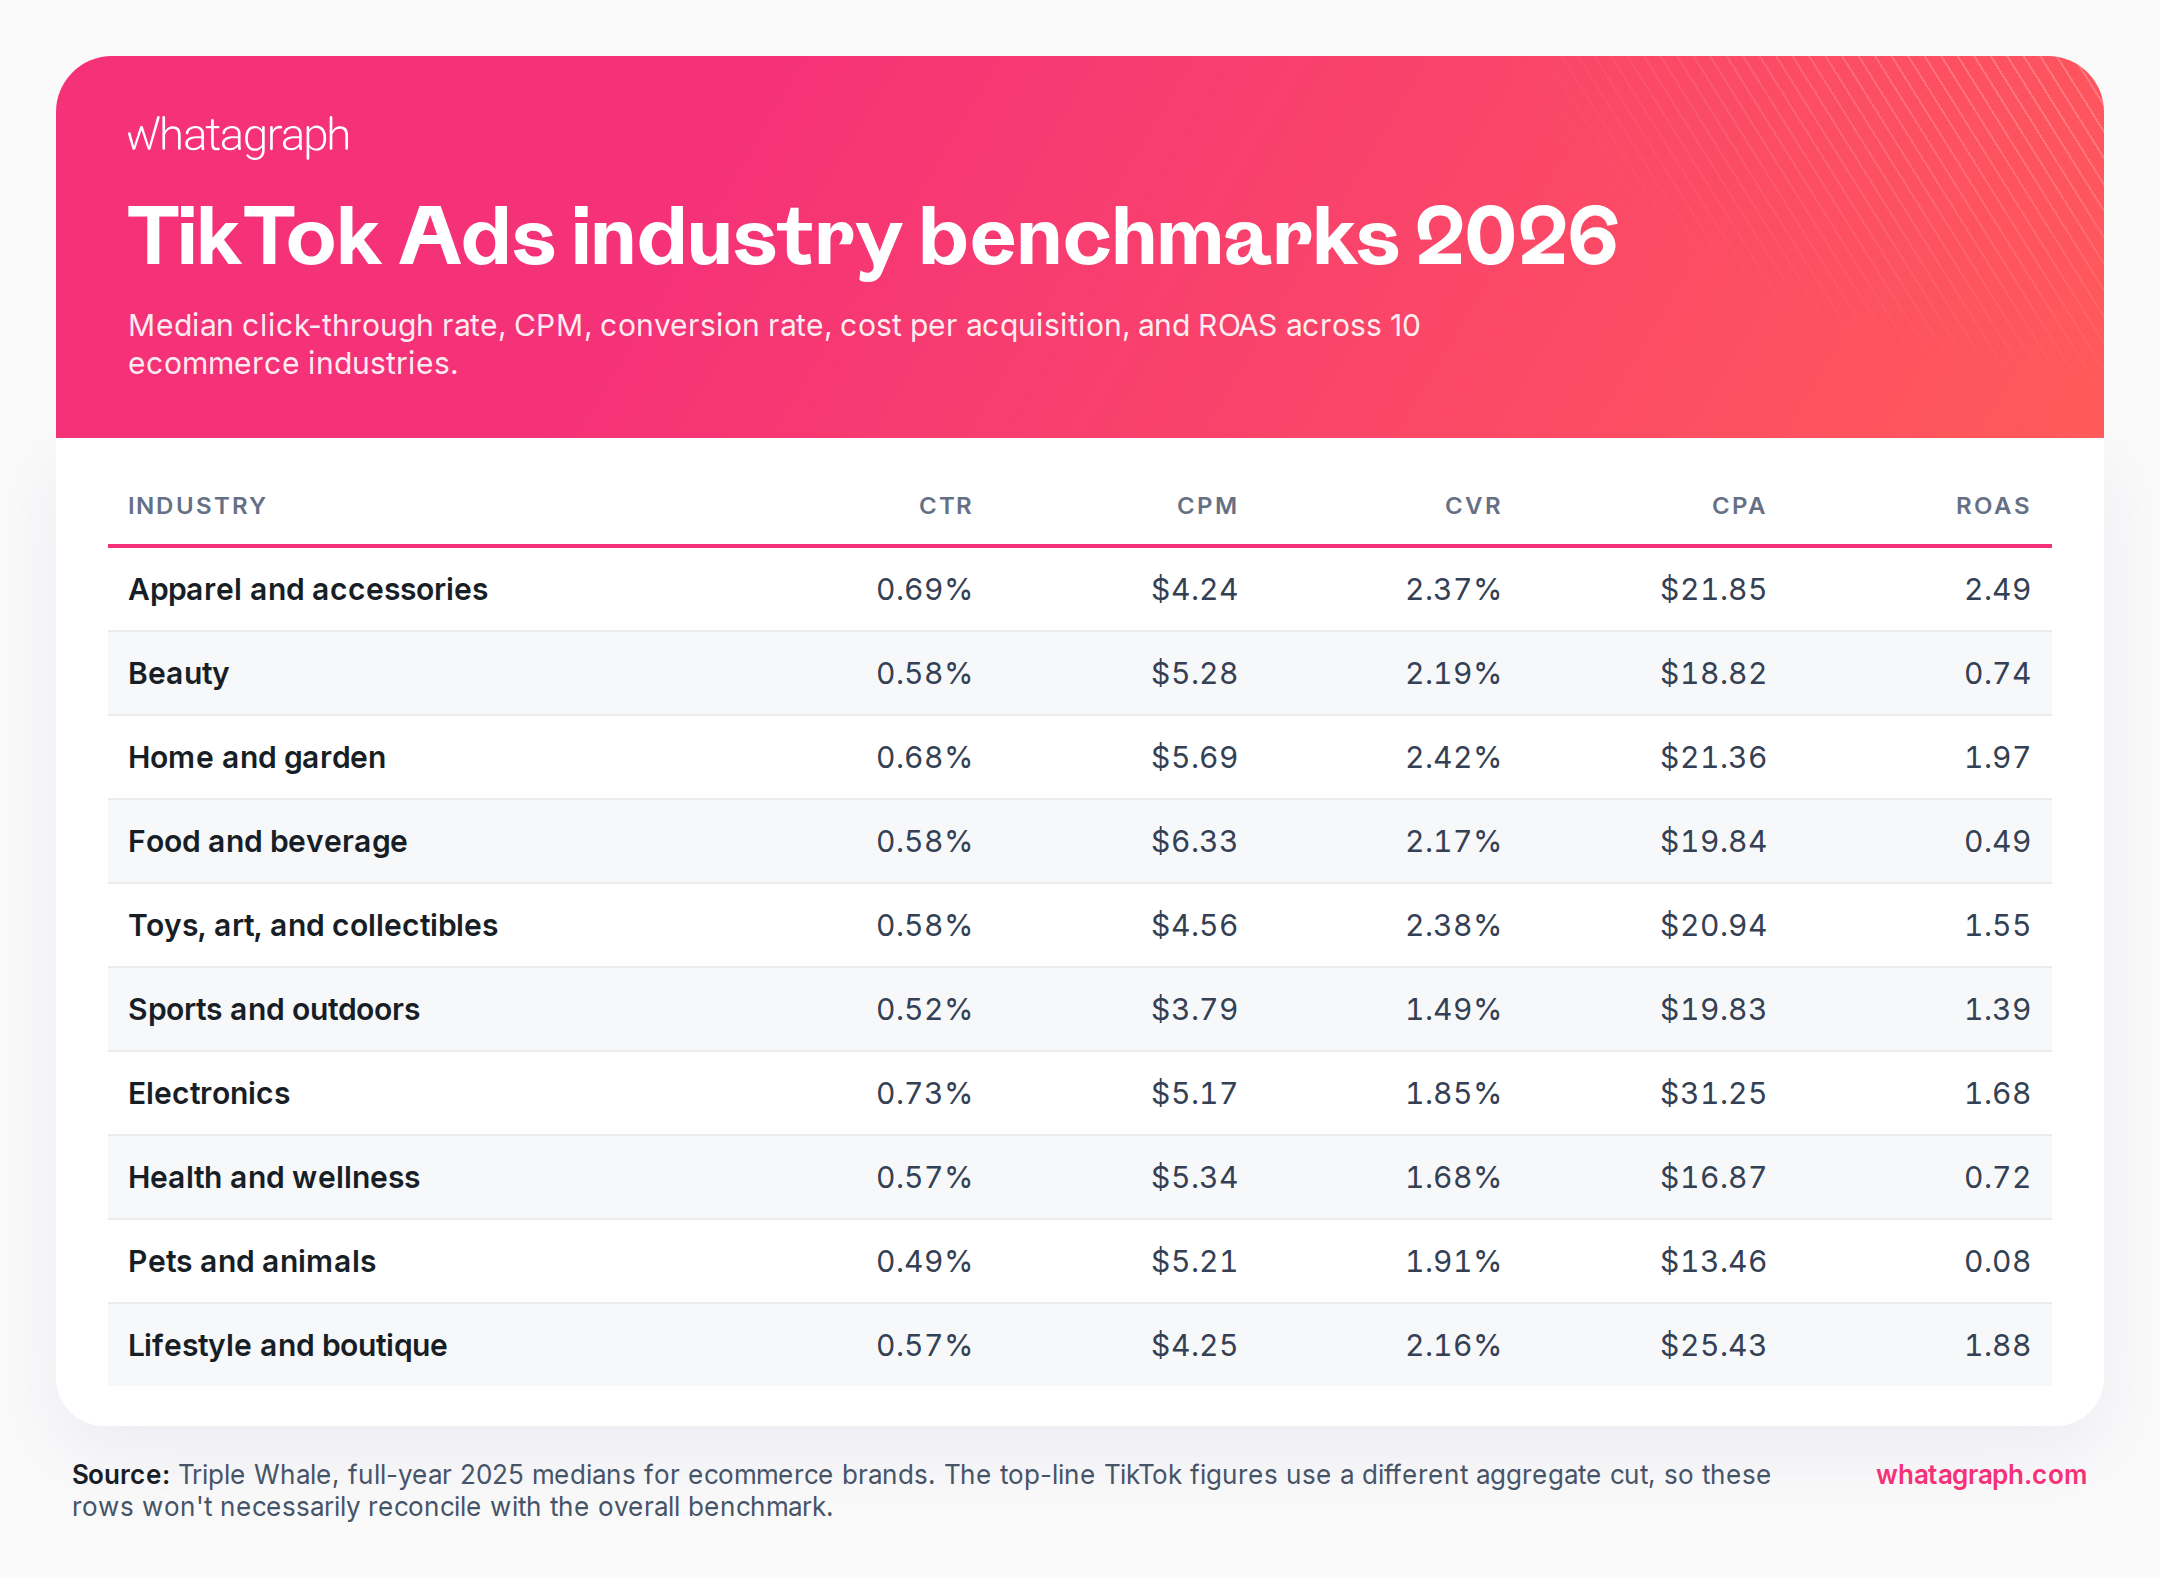
Once again, the columns refuse to elect one winner. Where electronics has the highest CTR but also the highest CPA, home and garden leads on conversion rate; while apparel and accessories produces the strongest ROAS.
TikTok introduces one final reporting problem. The platform’s attention metrics don’t translate neatly to the rest of paid social. If you put them all under video views, your cross-channel chart then measures several different achievements.
Whatagraph’s Custom Metrics let you define TikTok hook rate or hold rate once from the underlying metrics and keep the formula consistent across reports.

You can also standardize the names shown across sources while preserving what each platform measures. The cross-channel dashboard becomes easier to read without pretending that a TikTok two-second view and another platform’s video view are the same event.
Pinterest Ads benchmarks for 2026
WebFX’s latest U.S. campaign data combine WebFX’s internal campaign performance with third-party research and represent median results from hundreds of active U.S. campaigns during 2024 and 2025:
| Metric | Pinterest Ads benchmark |
|---|---|
| Click-through rate | 0.15%-0.25% |
| Cost per click | $0.50-$1.50 |
| Cost per engagement | $0.10-$0.30 |
| Conversion rate | 2%-4% |
Pinterest measures two related actions:
- A Pin click is an in-unit interaction that can lead to content on or off Pinterest.
- An outbound click redirects the user to another web destination.
Pinterest also charges advertisers for Pin clicks rather than outbound clicks. A low CPC can therefore describe inexpensive interaction with the Pin without necessarily describing equally inexpensive website traffic.
A practical Pinterest Ads CPC benchmark is $0.50-$1.50 based on WebFX’s campaign-performance dataset. But its separate survey of 270 marketers produced lower self-reported costs:
| Reported cost | Share of marketers |
|---|---|
| CPC of $0.20 or less | 43% |
| CPM of $1.50 or less | 52% |
| Cost per conversion of $8 or less | 66% |
These figures answer a different question. The campaign benchmark summarizes observed performance across campaigns; the survey records the ranges marketers said they paid.
The CPC distribution is also wide. Around 11% of respondents reported paying more than $3 per click, while another 26% paid no more than 10¢. Your industry, targeting, placement, bid strategy, and the type of click being counted can move the result considerably.
WebFX places the typical Promoted Pin conversion rate at 2%-4%, rising to 5%-8% for luxury and home goods campaigns.
But a Pinterest conversion rate depends on more than how many people bought. Pinterest lets advertisers use one-, seven-, or 30-day post-click and post-view lookback windows. A longer window can capture purchases made after someone discovered or saved a product, but it may also give Pinterest credit for more conversions than a shorter last-click report does.
So compare conversion rates only when the reports share:
- The same conversion event.
- The same click and view windows.
- The same attribution model.
- The same treatment of new and returning customers.
Snapchat Ads benchmarks for 2026
AdLiftr’s early-2026 data puts the median Snapchat Ad at a 1.04% CTR and $0.84 CPC. For DTC ecommerce campaigns, the median cost to acquire a first-time purchaser was $23.40.
The dataset covers 2,431 campaigns from 412 advertisers that spent a combined $11.4 million between February 1 and May 28, 2026.
While this is sparkling clean methodology, remember that this is still one vendor’s customer base. DTC ecommerce made up 38% of the advertisers, mobile apps another 22%, and 58% of the campaigns ran in the U.S.
So treat the results as a current mid-market reference.
Snapchat Ads CPC and CTR benchmarks
Across all objectives, AdLiftr recorded a $0.84 median CPC and 1.04% median CTR. While traffic campaigns bought cheaper clicks, conversion campaigns paid more for access to people the system considered likely to act.
| Metric | Median | 25th-75th percentile |
|---|---|---|
| CPC across all objectives | $0.84 | $0.51-$1.34 |
| CPC for traffic campaigns | $0.71 | $0.43-$1.12 |
| CPC for conversion campaigns | $1.18 | $0.72-$1.94 |
| CTR across all objectives | 1.04% | 0.61%-1.69% |
| CTR for Spotlight placements | 1.36% | 0.83%-2.18% |
| CTR for Story Ads | 0.94% | 0.55%-1.51% |
Spotlight produced the highest CTR in this dataset, while Stories accounted for the largest share of impressions. A campaign can therefore move above or below the overall 1.04% benchmark because its inventory mix changed, even when the creative itself did not.
Snapchat Ads CPM benchmarks
In AdLiftr’s dataset, CPMs were substantially higher for lower-funnel objectives:
| Campaign objective | Median CPM | 25th-75th percentile |
|---|---|---|
| Awareness | $5.84 | $3.20-$9.40 |
| Engagement | $9.10 | $5.40-$13.60 |
| Traffic | $11.20 | $6.80-$16.90 |
| Catalog sales | $19.40 | $11.20-$28.90 |
| App installs | $23.40 | $14.90-$35.20 |
| Lead generation | $24.80 | $15.10-$39.40 |
| Conversions and purchases | $27.10 | $17.40-$41.80 |
CPMs for awareness inventory were less than one-quarter of those for conversions. But that does not make it four times more efficient. The awareness campaign is buying exposure, while the conversion campaign asks Snapchat to find people likely to complete a much rarer action.
Snapchat Ads CPA benchmarks by industry
AdLiftr reports the following median costs for a first purchase, install, or lead. Those outcomes aren’t interchangeable, so the table below names what each number buys:
| Industry | Measured outcome | Median cost | 25th-75th percentile |
|---|---|---|---|
| DTC apparel and accessories | First-time purchase | $19.80 | $12.40-$32.10 |
| DTC beauty and cosmetics | First-time purchase | $23.40 | $14.20-$34.80 |
| DTC food and beverage | First-time purchase | $28.90 | $17.60-$44.20 |
| Mobile gaming apps | Install | $4.70 | $2.10-$9.40 |
| Mobile utility apps | Install | $8.30 | $3.80-$16.20 |
| Fintech and banking apps | Install | $34.10 | $19.40-$58.70 |
| Local services | Lead | $42.80 | $22.10-$71.30 |
| B2B SaaS | Lead | $58.40 | $31.20-$98.40 |
The apparel category produced the lowest ecommerce CPA, while B2B SaaS had the highest cost per result in the table.
But a $4.70 app install isn’t automatically better than a $19.80 purchase, and a $58.40 B2B lead may be perfectly workable when it turns into a high-value contract. The outcome and downstream value have to remain attached to the cost.
Before you benchmark anything…
You need one CPL, one CPC, one CPA, one CPM, one CTR, one CVR, and one ROAS.
These need to be defined once, that means the same thing in every report they walk into. Maatwerk Online runs a hundred clients that way, and gets back a hundred hours a month; "pure profit," in the co-founder's words.
And just as importantly, Maatwerk Online’s specialists spend less time assembling reports and more time working out what the numbers mean.
The benchmarks tell you what normal looks like for 2026. But to find out what true looks like for you, get a demo of Whatagraph.
Published on Aug 05 2026
WRITTEN BY
YamonYamon is a Senior Content Marketing Manager at Whatagraph. With an eye for detail and a knack for always considering context, audience, and business goals to guide the narrative, she's on a mission to create genuinely helpful content for marketers. When she’s not working, she’s hiking, meditating, or practicing yoga.