10 Best Fivetran Competitors in 2025 [Full Comparison Table]
On paper, Fivetran is a capable data-moving tool, but it can be unreliable and expensive, while their customer support can take ages to respond. If you’re looking to move away, you’re at the right place.
In this article, we’ll take you through:
- Top issues with Fivetran
- 10 best Fivetran competitors
- Key features and pricing of each tool

Dec 17 2024●10 min read
With more than 400 data connectors under the hub, Fivetran appears to be great for aggregating scattered data into data warehouses, data lakes, and databases.
Yet online users may disagree. They say Fivetran is:
❌ Buggy: Fivetran suffers from frequent connector breakdowns, even with common sources such as Facebook Page and Google Play Store. Customers with large data volumes report issues with syncs, while the resolution timelines are always in question. According to users, the downtimes sometimes last for days, even weeks.
❌ Limited: Most connectors limit what you can transfer. There’s no way to select specific tables or collections. Fivetran is strictly a “data-moving” tool with no built-in visualization options. To visualize your data, you need to A) move your data to a warehouse and B) connect it to Looker Studio, Tableau, or another BI tool and create a report there.
❌ Expensive: Many users complain about the price, which is often called “extreme” and “not flexible”. Total costs are often unclear, so you may end up with unexpected charges due to the usage-based Monthly Active Rows model.
❌ Missing AI insights: You need to visualize connected data in another tool to analyze it or have a data expert do it for you in Fivetran.
❌ Lacking in customer support: Even critical issues sometimes take days to resolve. There appears to be little proactive monitoring, so users must discover and report connector issues themselves. Users complain about follow-up promises that are never fulfilled or non-technical support staff providing generic responses.
— — —
Sounds familiar? We get you.
In this article, we’ll take you through the 10 best Fivetran competitors and alternatives that will rarely break on you, cost less and come with great customer support.
10 Best Fivetran Alternatives and Competitors in 2025
In a nutshell, here are the best Fivetran alternatives we’ll talk about in this article.
- Whatagraph
- Supermetrics
- Funnel.io
- Tableau
- Power My Analytics
- Klipfolio
- Adverity
- Improvado
- Domo
- Datorama (Marketing Cloud Intelligence)
You already know what features you’re looking for? Compare them in our table:
| Features |
|

|

|

|

|

|

|

|

|
|
|---|---|---|---|---|---|---|---|---|---|---|
| Ease of use | Easy | Hard | Medium | Medium | Easy | Hard | Hard | Medium | Medium | Easy |
| No. of Out-of-the-box Data Connectors | 55+ | 130+ | 500+ | 100+ | 44 | 130+ | 21 | 500+ | 100+ | 100+ |
| Custom API Access |
|
|
|
|
|
|
|
|
|
|
| Data Blending |
|
|
|
|
|
|
|
|
|
|
| Custom Metrics and Dimensions |
|
|
|
|
|
|
|
|
|
|
| Custom Reports and Dashboards |
|
|
|
|
|
|
|
|
|
|
| Campaign Overview and Monitoring |
|
|
|
|
|
|
|
|
|
|
| White-labeling |
|
|
|
|
|
|
|
|
|
|
| Data Update Frequency | Every 30 mins across all integrations and pricing plans | Depends on your pricing plan, from 4 hours to 30 minutes | Depends on the data source | Default is every 12 hours but you can set custom frequencies | Daily or hourly as a paid add-on | Depends on your pricing plan, from 4 hours to 30 minutes | Depends on APIs, from 15 mins to 4 hours | Depends on the pricing plan--twice daily, four times daily, or custom | Default is every 12 hours but you can set custom frequencies | Depends on the data source |
| Data Segmentation and Filtering |
|
|
|
|
|
|
|
|
|
|
| Alerts and Notifications |
|
|
|
|
|
|
|
|
|
|
| Multi-Client Management |
|
|
|
? |
|
|
|
|
? |
|
| User Management | Admin, Manager, or Editor | Account Administrator, Klip Viewer, Klip Editor |
|
Creator, Explorer, or Viewer roles | Hub Owner, Team Member, Billing Contact |
|
Viewer, Editor, or Owner | Viewer, Editor, Workspace Admin, Data Manager, Data Load Manager, Data Analyst | Creator, Explorer, or Viewer | Account Owner, Admin, Read Only |
| Automated Report Sharing |
|
|
|
|
|
|
|
|
|
|
| Data Export | PDF, XLS, CSV | Export dashboards as PDF or image files. Export individual Klips as CSV | JSON, CSV | PNG, PDF, CSV | XLS, CSV | Export dashboards as PDF or image files. Export only individual Klips as CSV | Google Sheets, CSV, Excel | PNG, PDF, CSV | PNG, JPEG, PDF, CSV | |
| AI Insights |
|
|
|
|
|
|
|
|
|
|
| Customer Support | Live chat, email, Help Center for all pricing plans | Email, Help Center | Email, In-app messages, Help center | Tableau community forum, Help Center, Email, Consulting services | Email,Live chat, Help Center | Email, Help Center | Help center, community forums | Service desks to raise requests, Help center, Email | Tableau community forum, Help Center, Email, Consulting services | Email, Help center |
| Dedicated Customer Success Manager |
|
|
|
? |
|
|
|
|
? | ? |
| Data Security and Compliance | ISO 27001, Enterprise SSO, GDPR compliant, AES-256 encryption, Two-factor authentication, AWS hosted servers | AWS hosted servers, 2048-bit RSA key access for servers, no passwords, SSL, RBAC | ISO 27001 certified, GDPR and CCPA compliant, SOC 2 Type II | MFA, SSL/TLS encryption, ISO 27001, ISO 27012, ISO 27018, GDPR and CCPA compliant | 256-bit AES, TLS protocols, ISO-certified, GDPR, Time-based One-Time Password (TOTP) | AWS hosted servers, 2048-bit RSA key access for servers, no passwords, SSL, RBAC | ? | SOC 2 Type II, HIPAA compliant, GDPR and CCPA compliant, SSO | MFA, SSL/TLS encryption, ISO 27001, ISO 27012, ISO 27018, GDPR and CCPA compliant | AWS-hosted servers, OAUTH protocols |
|
Pricing
(with $$$ being the highest)
|
$ | $$ | $$ | $$$ | $ | $$ | $$ | $$ | $$$ | $ |
Let’s dive into each of these tools.
1. Whatagraph
Most suitable for: Medium to large marketing agencies with 10+ employees
Whatagraph is going to be the best Fivetran alternative in 2025 (and well beyond). It's an all-in-one marketing data platform that makes it ridiculously easy to collect, monitor, and report on your marketing data.
So why is Whatagraph the first on our list?
Because it’s the only tool that covers the entire data journey — from connecting data and transforming it to visualization and sharing.
Here’s how Whatagraph works:
- Data collection — You connect your data sources and channels in a few clicks. Your data flows in automatically and refreshes every 30 minutes.
- Data management — You can organize your data sources by teams, accounts, clients, locations, and currencies.
- Data transformation — You prepare your data for analysis. Unify metric and dimension names, create custom metrics and dimensions, or blend data sources. All this is done in a user-friendly point-and-click environment without writing a single line of code.
- Data visualization — Visualize your organized data using drag-and-drop chart widgets or ready-made templates. Create white-labeled reports with custom logos, color schemes, and domains. With Whatagraph, you don’t need to export your data to another data visualization or BI tool. Create professional-looking reports and dashboards in the same platform where you connect and transform your data.
- Data sharing & transfer — Share links to live dashboards and send periodic reports as scheduled PDF emails. Export report or chart data into Excel spreadsheets. Set up data transfers to BigQuery without any coding.
Last but not least, if you ever get stuck at any of these steps, you can type your problem immediately into our live chat box, and our customer support specialists will respond in under 3 minutes.
Our team did extensive research on how Whatagraph compares against Fivetran and found that it overperforms it in these 5 critical areas:
1. More stable all-in-one platform
Fivetran integrates data from various sources to various destinations. From there, you can visualize your data in Looker Studio or a BI tool.
Stability is the first requirement for any data pipeline or integration tool.
This is especially critical if getting data from sources to client-ready dashboards requires using several platforms, as is the case with Fivetran.
In other words, you’d expect such a tool to be the foundation of your data stack.
Unfortunately, customers aren't too happy with Fivetran’s reliability, as we've seen with many complaints in this area.
For example, one user says that they lost “who knows how much time and money because the data tables don't line up properly.”

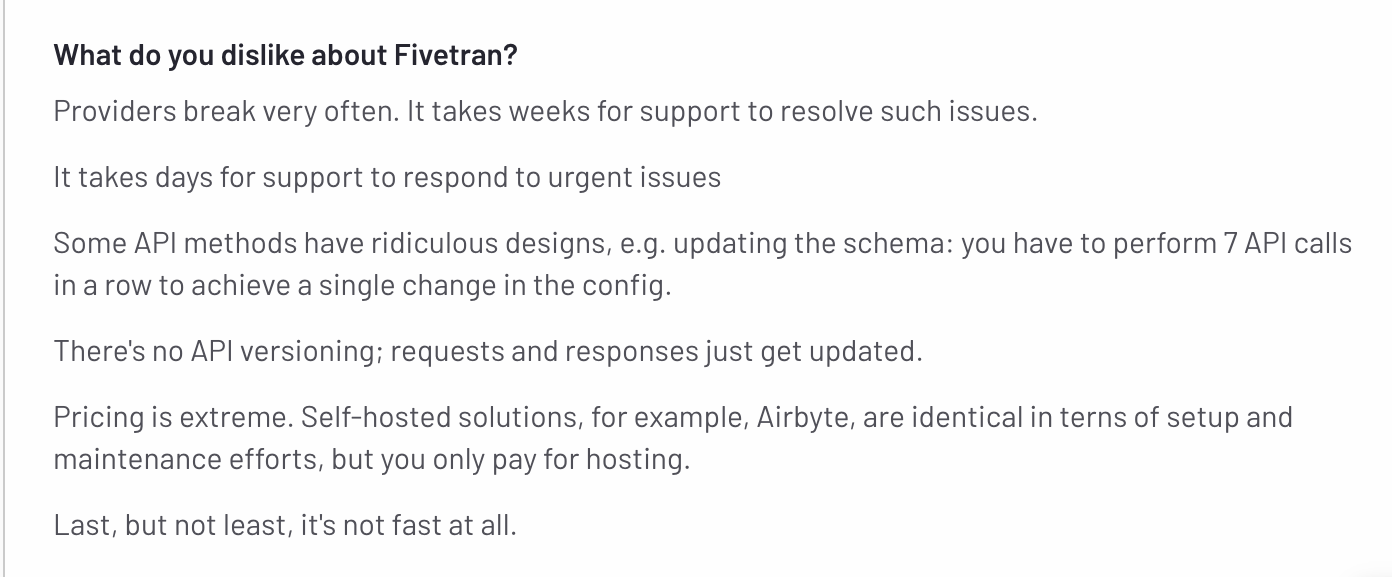
Another user complains about connectors (providers) breaking off, but also about how slow Fivetran can get:
With Whatagraph, on the other hand, you don't need to send your data to a warehouse in order to visualize it… in a third tool.
Everything from connecting your data to cleaning it to visualizing and sharing it takes place in one platform. This means:
- There are fewer chances of data inconsistencies, connection issues, or breakages.
- Your data is safe, secure, and organized on one platform.
- You don’t need to jump from one platform to another.
- You don’t need to learn how to use new tools.
Plus, the integrations we provide at Whatagraph are fully managed. This means they’re more seamless, stable, and reliable.
And our Product engineers regularly maintain these integrations, so you don’t have to.
Fully-managed integrations also mean if there are bugs, we can resolve them quickly without having a third-party company involved. You won’t run into situations where you open up a report and all the data is broken.
Whatagraph also offers a 30-minute consistent data refresh rate across all your sources, so you’ll always see fresh and accurate data on your reports.
Actually, according to data from the past 6 months, we have a 99.95% uptime. This means system outages are very rare.
Our current users love how seamless, stable, and simple the data connection process is. Here’s what one of them said on G2.com:

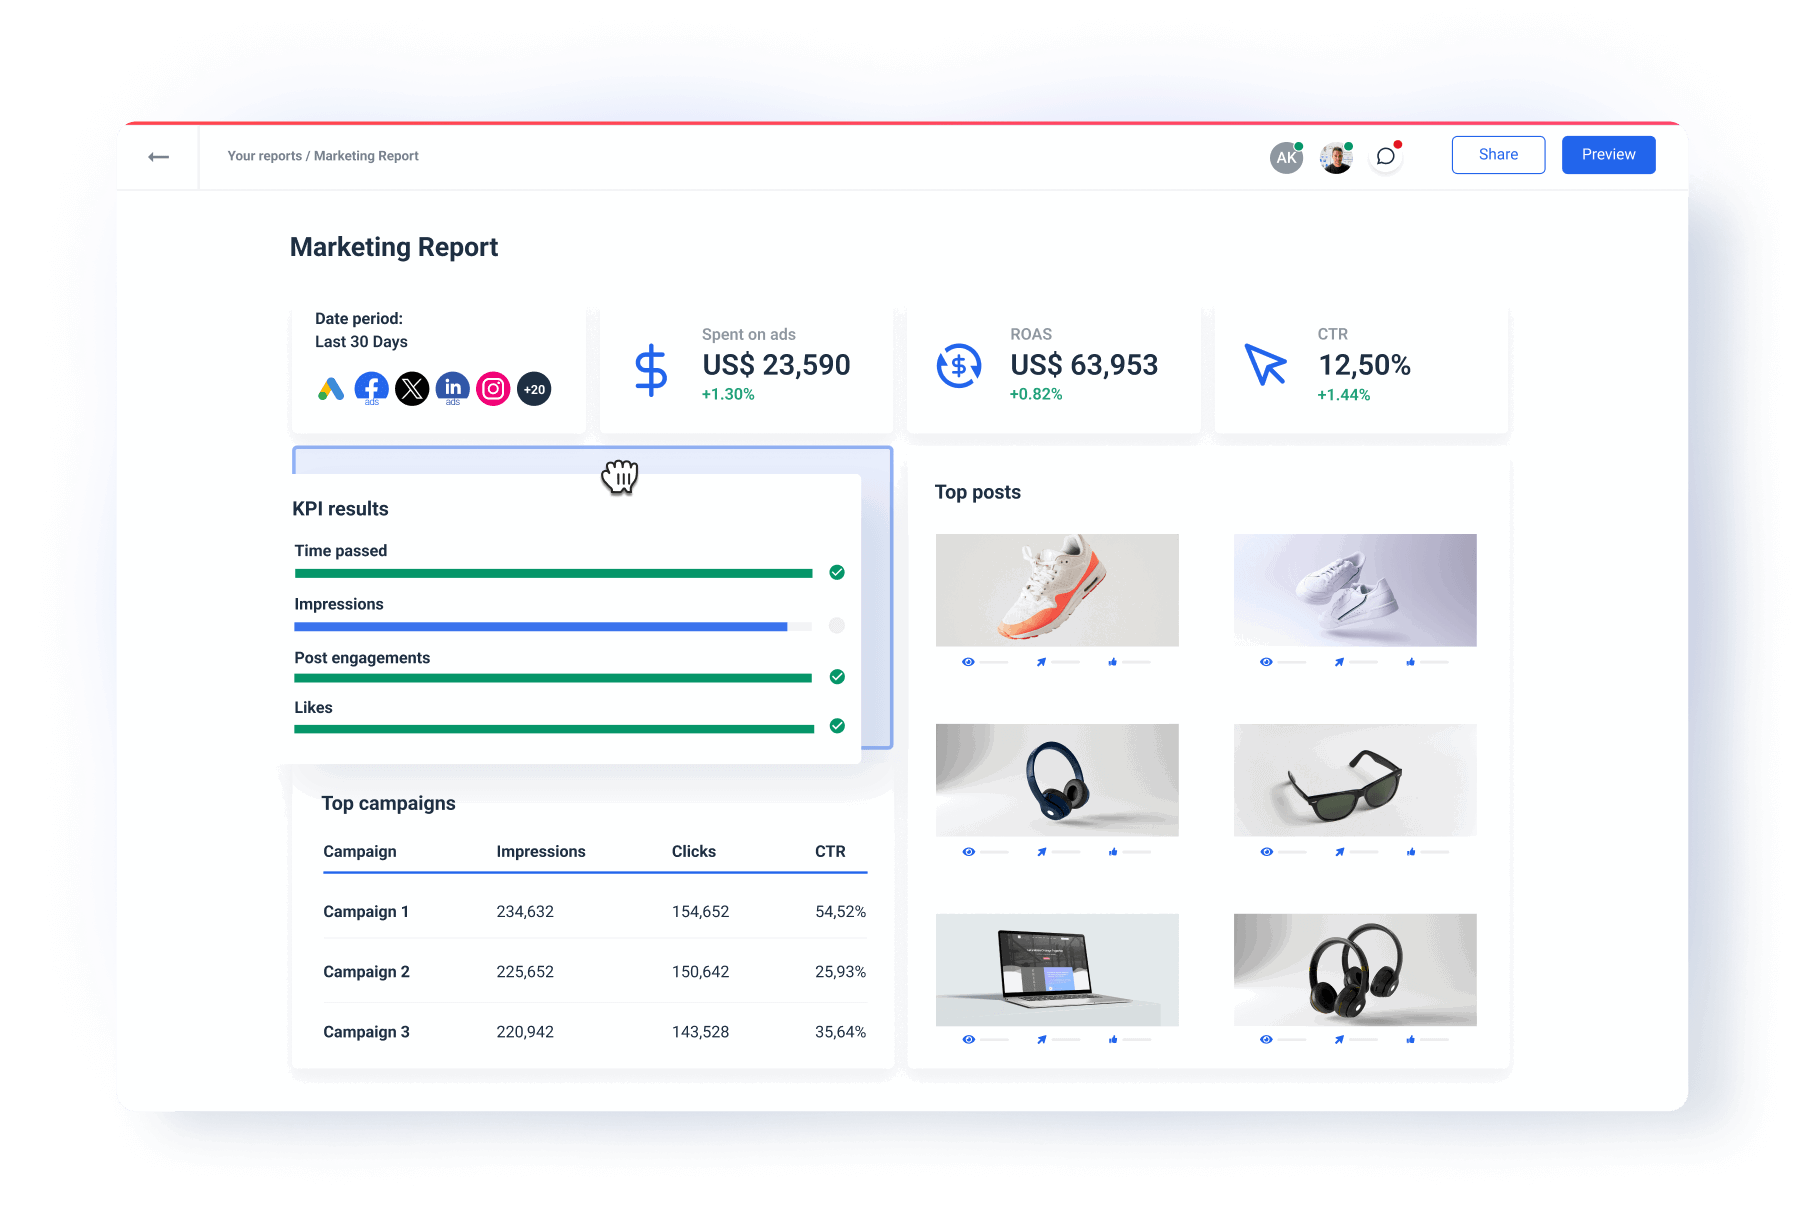
2. Native report and dashboard builder
When you need to report on data with Fivetran, you first need to move it to a warehouse and then use a third-party visualization tool. This adds an unnecessary layer of complexity and requires your team to learn three platforms instead of one.
For example, Looker Studio is not only slow but also has a steep learning curve, especially for non-tech-savvy users. It can take anywhere from 1 to 3 hours to create a performance report from scratch.
Many ex-Looker Studio users told us that they eventually had to hire a data scientist to edit and maintain their reports.
In contrast, we built Whatagraph to be incredibly easy and simple.
Anyone from your team can easily log into Whatagraph and start connecting data and creating reports immediately.
You create ONE dashboard and that doubles down as a report. And you can add widgets inside the report as you go.
Building your first report is easy. You can either:
- Start from a blank page and use our drag-and-drop widgets to add metrics onto the dashboard.
- Use one of our ready-made report templates or dashboard examples.
- Use our Smart Builder to instantly create dashboards for your favorite marketing channels (e.g. Google Analytics 4, Google Ads).
This video shows you how to do it:
You can then add metrics to your report in 5 different ways:
- Build your own metrics and drag-and-drop them onto the dashboard
- Drag-and-drop pre-made metrics onto the dashboard
- Widget templates
- Offline data
- Use Smart Builder
For new users, we always recommend starting from pre-made widgets, which makes life easier and is much faster. You don’t need to write any codes or work with any spreadsheets — just drag and drop on your dashboard, and that’s it.
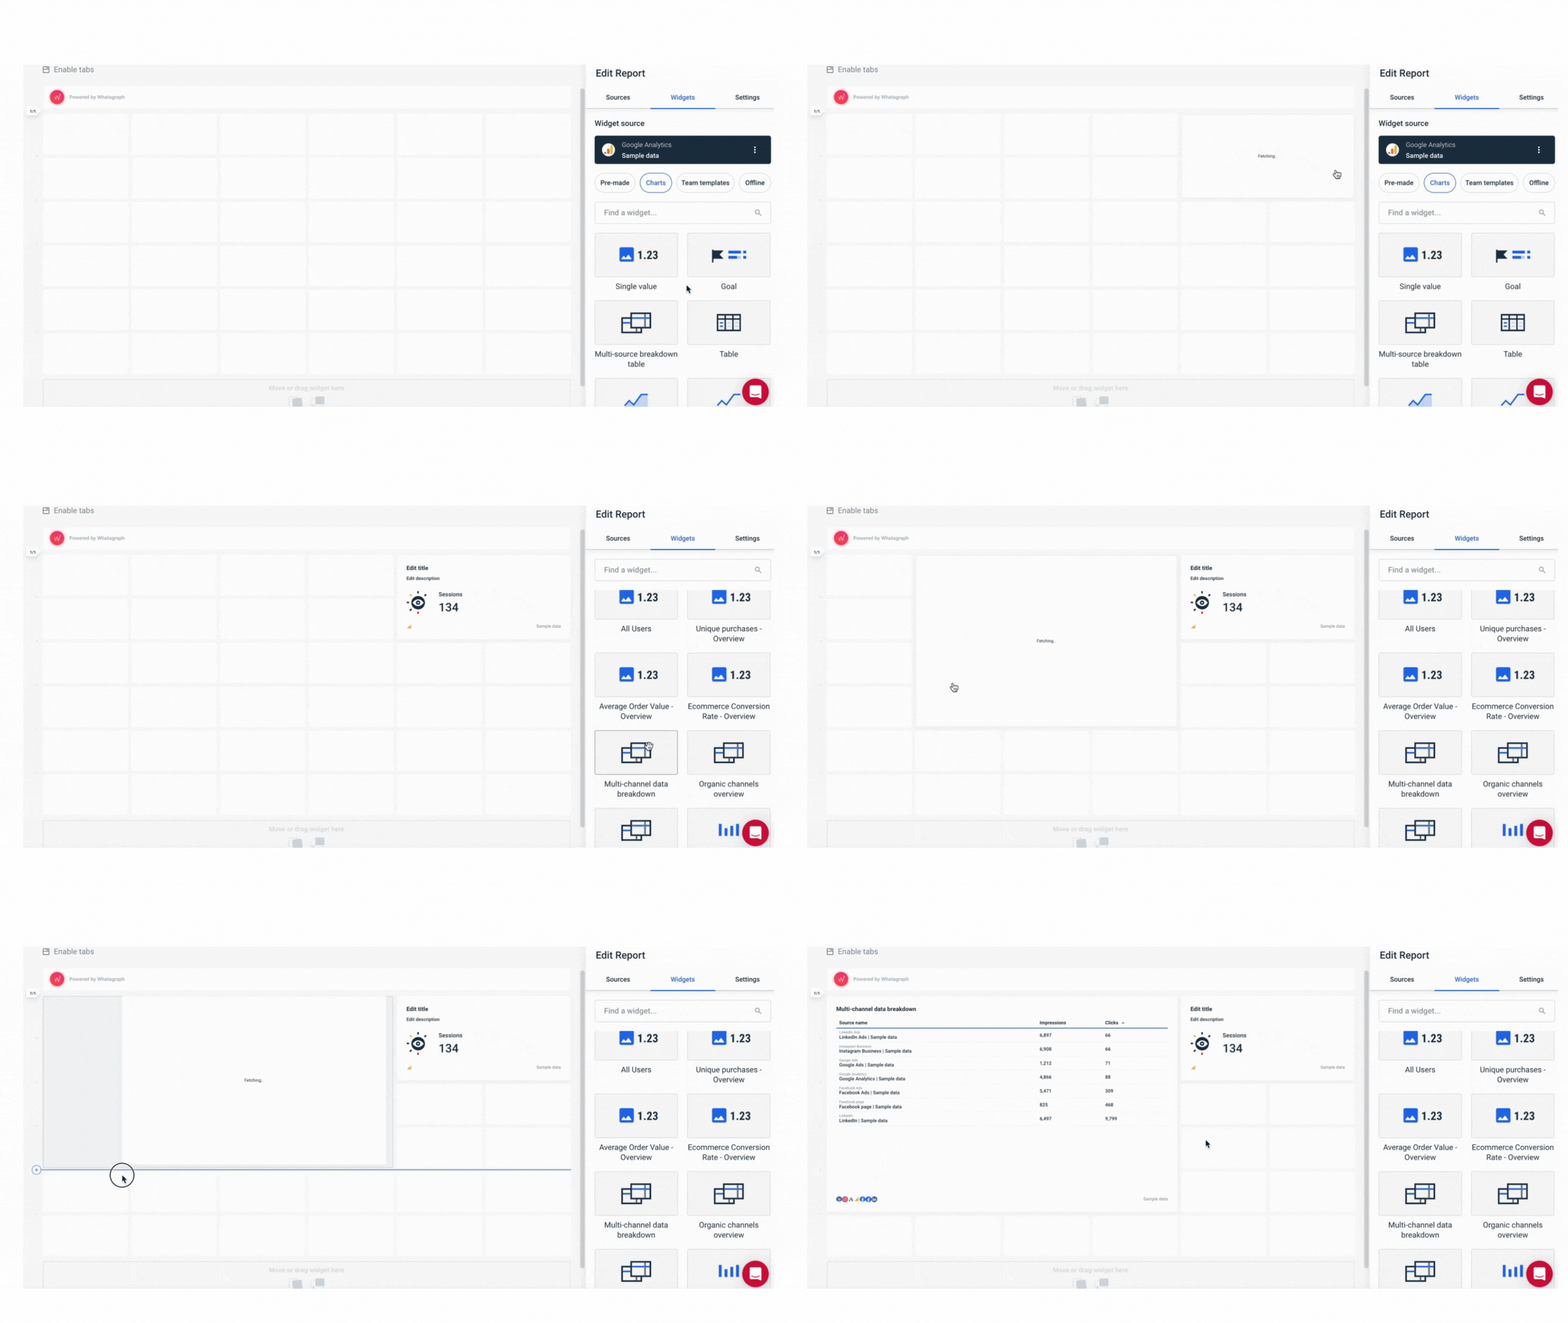
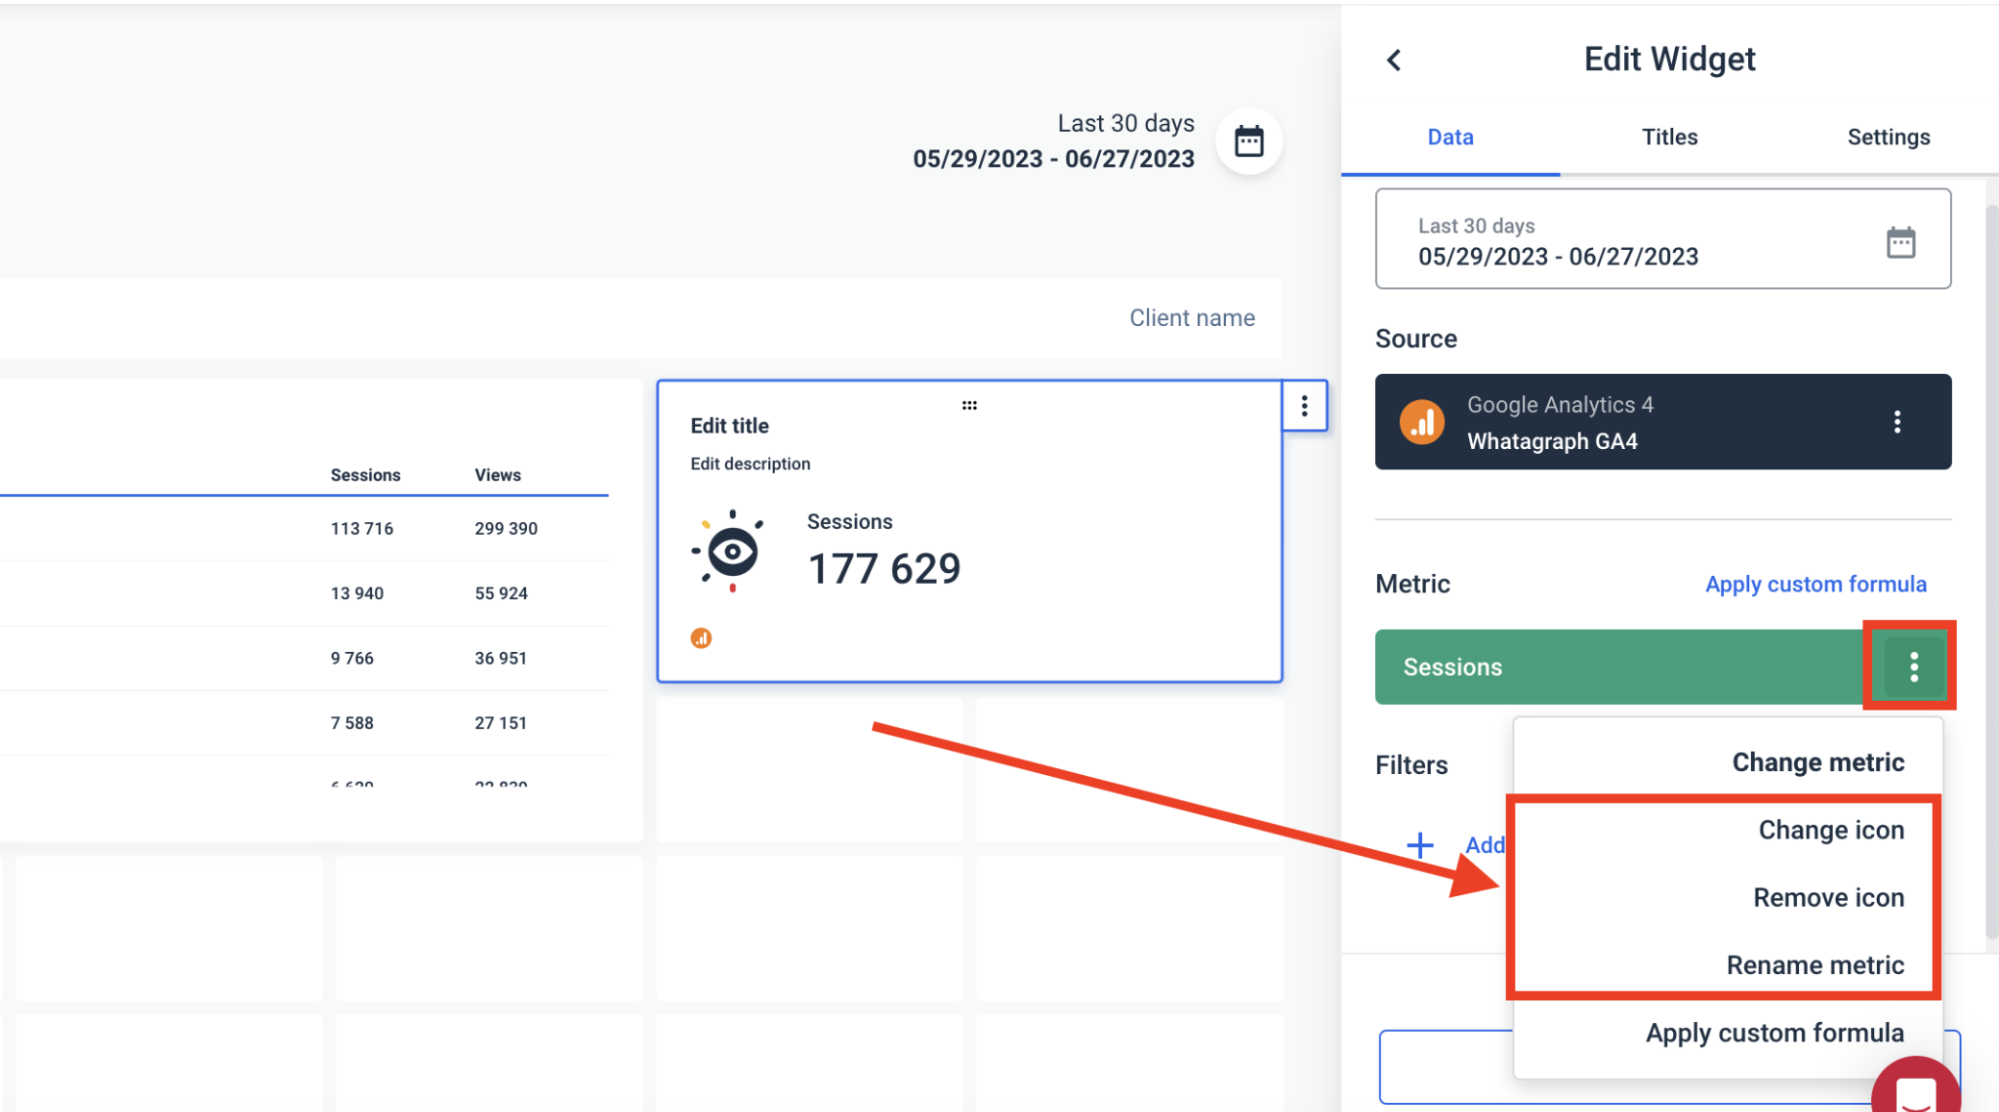
But just because they’re pre-made, doesn’t mean they’re not customizable. You can still:
- Adjust or rename the metric
- Change or remove icons
- Apply custom formulas (e.g. data blends)
- Change date ranges
- Change currencies
- Add or hide footers
- Customize the colors of each widget
If that’s not enough, you can also create custom widgets and save them as “templates” to re-use them the next time. These widgets are also fully responsive. You can resize them however you want—horizontally and vertically.
Want to make your widgets “pop” more? You can add any icons you’d like from our icon library:
![]()
Whatagraph also comes with thoughtful design features that make your user experience smooth as butter. You can:
✅ Link reports together and edit in bulk (instead of one by one)
✅ Add different “tabs” to one report to show performance for each channel or campaign
✅ Insert or delete rows anywhere on your report
✅ Change your report orientation as Portrait or Landscape
We covered a lot of customization options but these are just the tip of the iceberg of what you can do with Whatagraph. If you’d like to learn more, book a call with us and we’ll show you exactly how we can help.
3. AI chatbot and actionable insights
Fivetran doesn't support AI insights. This means you need to either visualize data in another tool or ask a data analyst to extract insights from the data.
Whatagraph solves this problem with two innovative AI features that save you time.
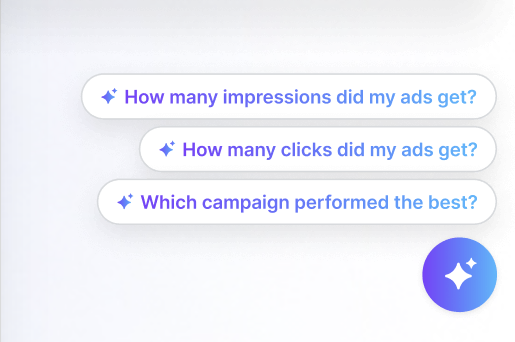
AI data chatbot: You can ask our AI chatbot questions about all your connected data or campaigns in natural language—just like talking to your personal data expert.
For example, “What was the total ad spend from Google Ads and LinkedIn Ads in January last year”?
The best thing is that you don't even have to create a report.
You can connect your sources and ask straight away!
AI summaries for reports: Instead of writing summaries yourself, you can generate AI report summaries and add them to your reports using our Text widget.

If needed, you can also edit the AI summary to add more granular insights or personal comments.
4. Straightforward pricing and more cost-effective
Fivetran has a pay-per-use pricing model, but it doesn’t publicly share its prices. It says that as the volume of data increases, the cost per row goes down.
However, in reality, Fivetran is notorious for trumping up the cost with little transparency as to what caused the increase.
One of the common user complaints is that it’s hard to predict how much the service will cost at the end of the month.

On the other hand, Whatagraph’s pricing is straightforward.
We offer three pricing plans based on the amount of “source credits” and access to customization and data organization capabilities.
You can use source credits to connect data sources, send data from a source to a warehouse, and blend cross-channel data together.
This way, you know exactly what you’re paying for.
Whichever pricing plan you choose, you get:
✅ 55+ fully-managed integrations
✅ Custom integrations via APIs, Google Sheets, and BigQuery
✅ Unlimited dashboards and reports
✅ A consistent data refresh rate of 30 mins
✅ Data transfer to BigQuery and Looker Studio
✅ Dedicated Customer Success Manager
✅ Fast customer support (<1 min first response time) via live chat and email
5. Dedicated customer support
While doing our own research for this article it became clear that Fivetran users’ complaints often have this pattern: unreliable connectors > slow customer support that takes weeks to solve the issue > unclear billing practices.
A user who titled his review “Tool for developers mostly” summed it up:
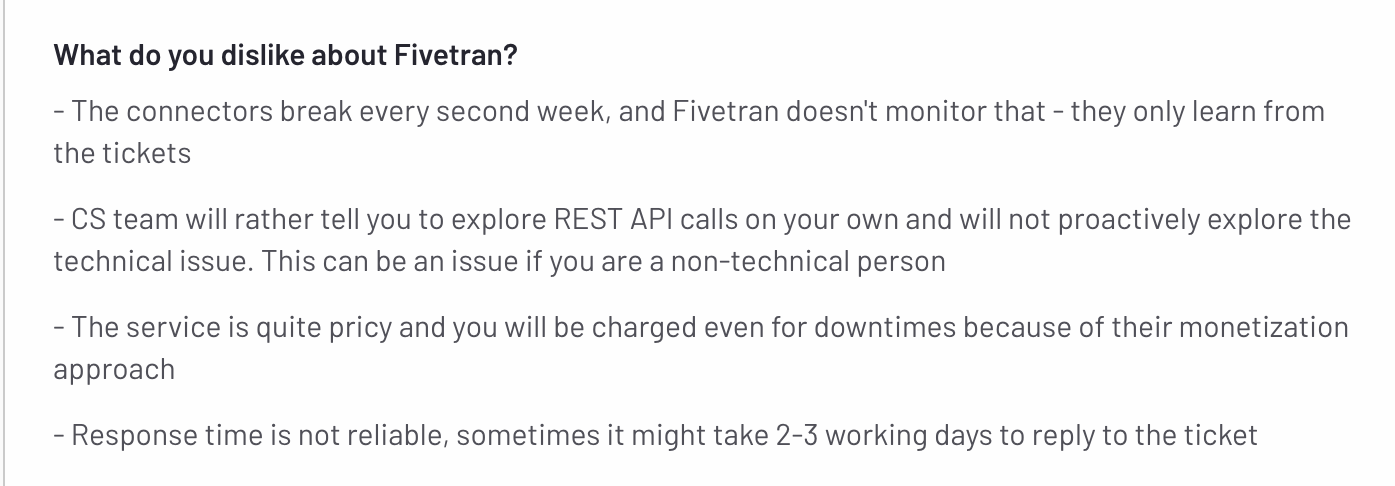
Having your data sources breaking on you is bad enough, even if the fix comes in quickly.
And with Fivetran, that’s not the case.
There are reports of delays that go on for days or even weeks for critical issues.
With the lack of proactive monitoring, it’s not rare that users themselves discover and report connector issues.
Also, support quality reportedly declines after contracts are signed.
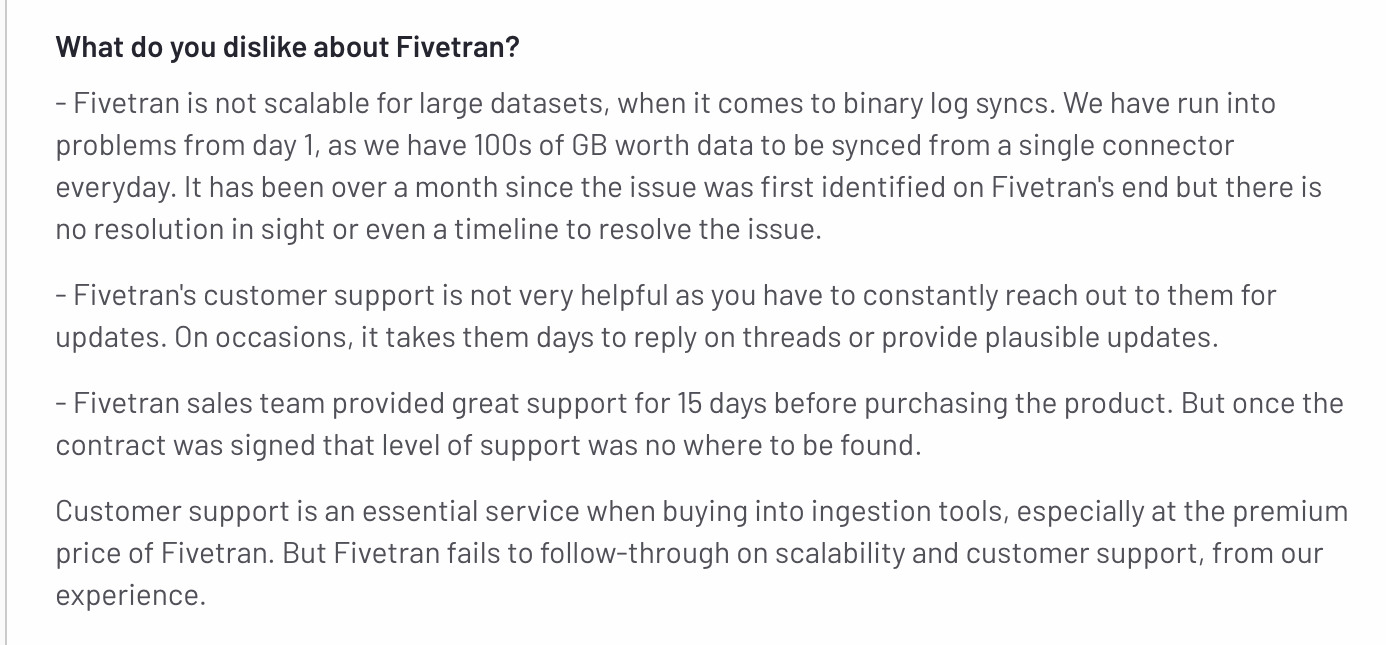
This G2 user says that Fivetran works extremely well with low-volume data sources, like Google Sheets, however, that can’t be said for the customer support.
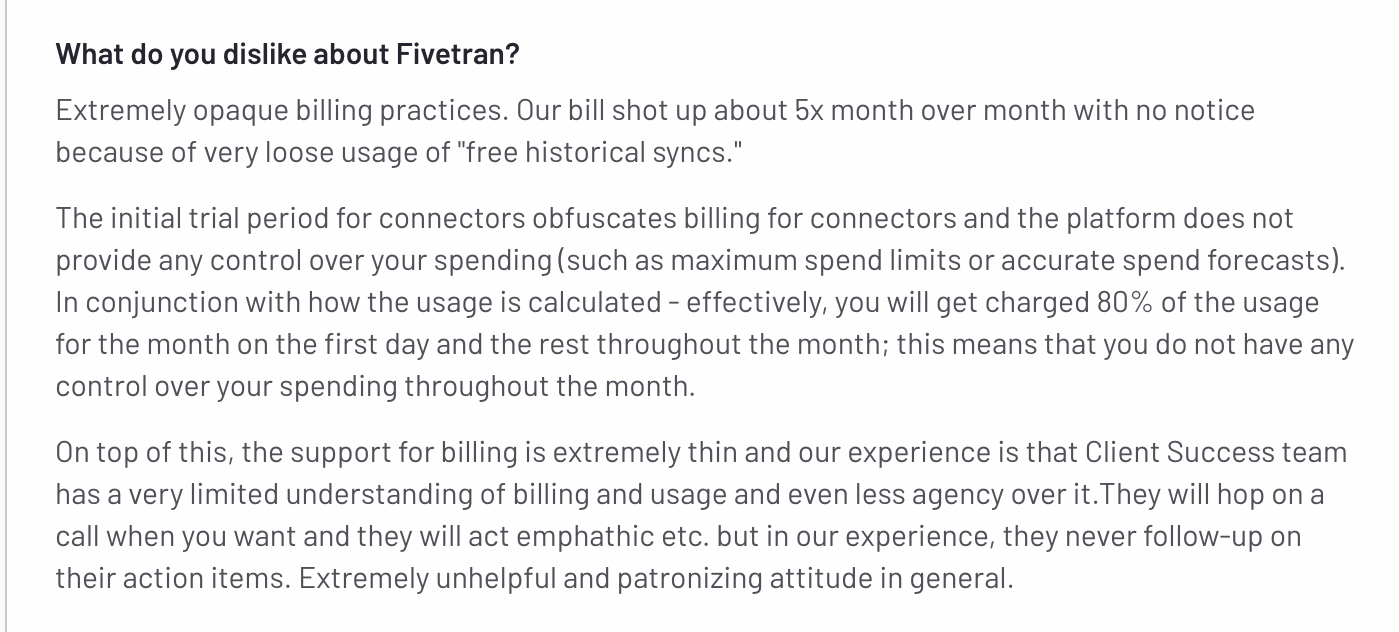
On Whatagraph, customer support is one of the pillars of our product.
If you need any help, you can reach out to our amazing Customer Support team instantly via the live chat on our website.
We respond to inquiries within 4 minutes and resolve issues within 24 hours.
Our more advanced plans also come with a dedicated Customer Success Manager who will help you:
- Set up data connections
- Organize your campaigns, data, clients, and locations
- Blend data sources and create custom metrics and dimensions
- Set up your reports and dashboards
- Anything else that ensures your success
Want to learn more? Book a call and tell us exactly how we can help you.
Key Features
- 55+ native integrations
- Custom integrations through Custom API, Google Sheets, or BigQuery
- Versatile drag-and-drop widgets for reports and dashboards
- Custom metrics, dimensions, and data blends
- Currency conversions
- Library of pre-made dashboard and report templates
- Export to Excel and CSV
- Custom branding and white-label features
- Automated report sharing via email
- Links to live dashboards
- No-code data transfer to BigQuery and Looker Studio
Whatagraph Reviews from Real Users
“To me, Whatagraph is like the Tesla or Mercedes of digital analytics tools, their clean and simple way to present complex marketing data. I highly recommend it to anyone working with marketing analytics who values efficiency and clarity in their reporting.” (Source)
“Whatagraph has a simple user interface that is easy to navigate even for those who don't have analytical skills.” (Source)
“What I like best about Whatagraph is having the ability to create reports fast and easy. No more spreadsheets to do reports, they have a great variety of templates.” (Source)
Pros
- All-in-one marketing performance monitoring and reporting solution
- Easy to use by anyone on your team
- Fast campaign performance and insights
- Stunning visual reports
- Makes results easy to interpret
- Excellent live chat customer support
Cons
- No freemium plan
- Can be expensive for small agencies (under 10 employees) and freelancers
2. Supermetrics
Most suitable for: Enterprises with dedicated data scientist or engineering teams
Supermetrics is a data integration tool that pulls marketing data from over 150 platforms, like Google Analytics 4, HubSpot, and Facebook Ads, into data warehouses and BI tools like Big Query, Snowflake and Looker Studio.
Unlike Fivetran, which requires some technical expertise to set up, Supemetrics is a no-code platform that everyone can use right out of the box.
Through automated normalization flows, Supermetrics helps you eliminate inconsistencies and redundancies from your data, cleaning it before you move it somewhere else.
You can define how you want your data to appear through “Custom Fields”. For example, you can create new metrics or modify the existing ones. Custom metrics and dimensions are also available on Fivetran, but you need to set up transformation rules via SQL/dbt.
Supermetrics also lets you blend data from different marketing platforms, so you can get a unified view of your performance.
However, while in Whatagraph you can combine sources and create rules by just following simple steps, on Supermetrics, you need a data scientist to set up data mapping and transformations.
Similar to Fivetran, Supermetrics doesn’t have the native visualization layer.
A big difference is that Supermetrics has a direct connector to Looker Studio, while with Fivetran, you need to move data to a warehouse first and then connect it to a visualization tool.
The problem is that in both cases, you depend on another reporting tool.
That means third party connectors which can never be as reliable as direct or native integrations. And in the case of Looker Studio, you quickly run into its limitations when you try to scale the volume of data and number of sources.
Key Features:
- 150+ integrations
- Data transfers to business intelligence tools, spreadsheets, and data warehouses
- Native data storage layer called “Supermetrics Storage”
- Automated normalization, custom fields, data blending, and data enrichment rules
- Ad budget tracking
- Real-time and retroactive reporting
- User, role, and access management
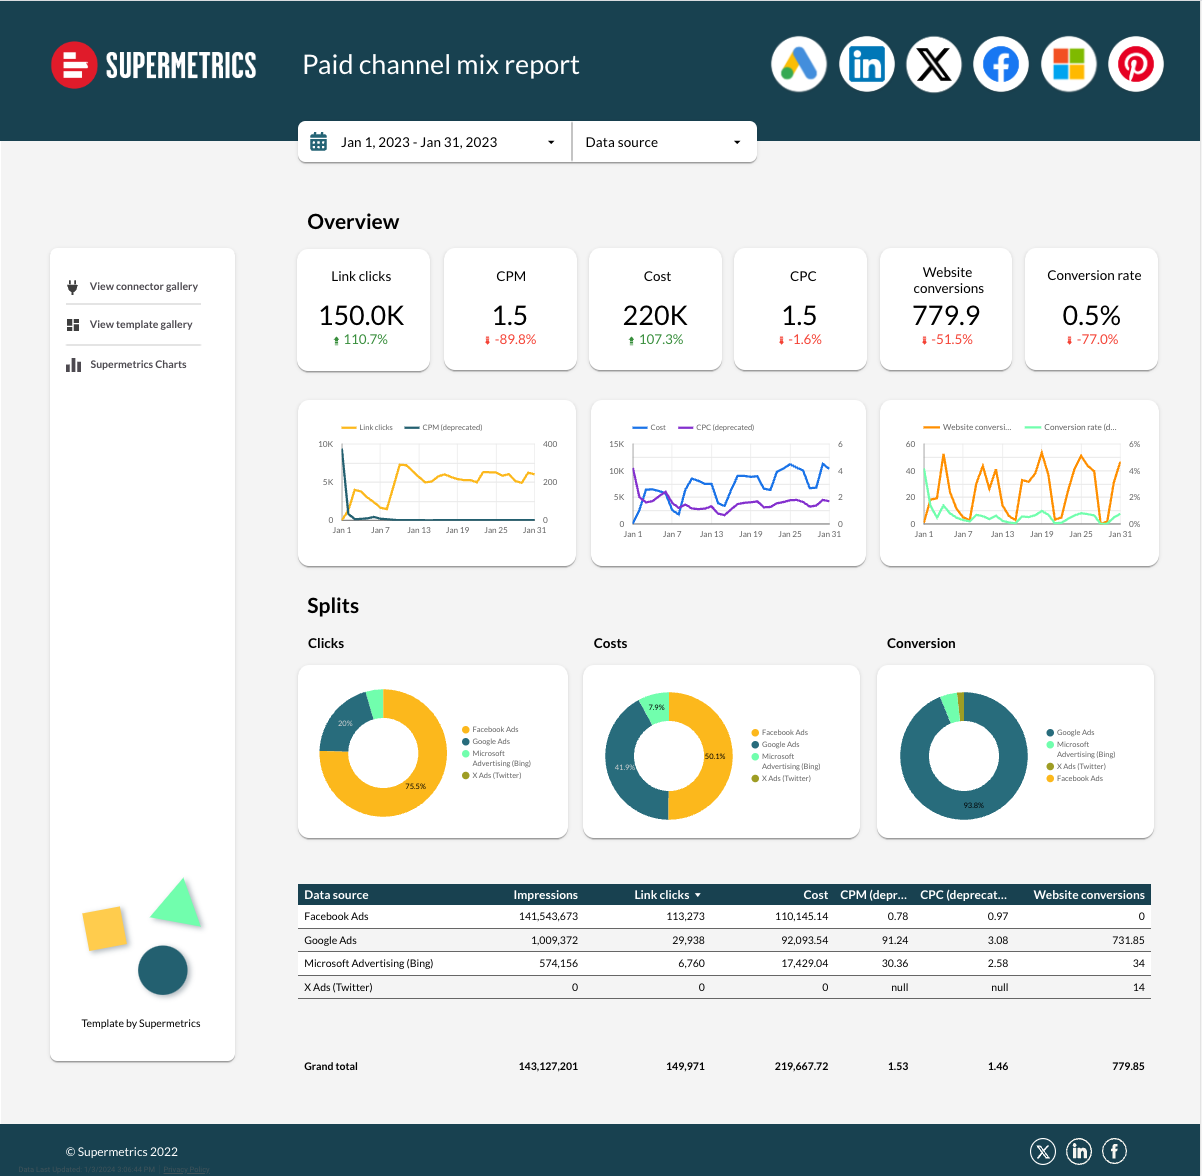
Supermetrics Reviews from Real Users
“It is a very useful which allows me to combine data across sources, so instead of exporting raw data for each source and merge using excel formula, I can do it automatically using Supermetrics.” (Source)
“The tool promises a robust series of direct connectors; however, the connectors rarely update without breaking.“ (Source)
“By far the worst thing is their support. They have set up AI chatbot that automatically closes request without resolving them. There is no way to get to human and no way to resolve some issues by ourselves.” (Source)
Pros
- Simple and easy to use
- Automated no-code data transfers
- Historical data easy to retrieve
- Great for extracting data to BI or ML platforms
Cons
- Loading data to multiple destinations is not available with a single pricing plan
- Adding more data sources requires buying more connectors
- Looker Studio connector can get slow when connected to multiple ad accounts
Supermetrics Pricing
Supermetrics offers pricing plans based on the final destination and the number of data sources you want to connect. However, for most plans, you must contact their sales to get quotes.
3. Funnel.io
Most suitable for: Enterprises with dedicated data scientist teams
Funnel is a solid choice for any large business looking for a data pipeline tool. It pulls data from scattered sources, transforms it, and sends it to data warehouses, BI tools, or spreadsheets.
With a little over 500 data connectors (vs. Fivetran’s 300) to popular marketing platforms and CRM systems like HubSpot, Salesforce, and DV360, Funnel is a highly competitive tool.
You can import your own data using Google Sheets or request the Funnel team to build a missing connector for you.
For a long time, Funnel lacked any visualization dashboard. Recently, it got a basic dashboard, but with just a few customization options, it’s still pretty much an internal tool.
On the other hand, Funnel boasts a powerful Marketing Measurement feature that helps you discover channels and campaigns that drive results, so you can optimize your marketing effort with more confidence.
It comes with AI recommendations on where to increase or decrease spend in relation to marginal CPA and ROAS. You can also create “what-if” scenarios to investigate the impact of budget changes for any channel with just a few clicks.
Another thing where Funnel beats Fivetran is customer support, which users describe as responsive and helpful.
Key Features
- 500+ integrations
- Custom integrations or Google Sheets data import
- Custom dimensions, metrics, and currency conversions
- “Data Explorer” dashboard for data scientists
- Basic visualization dashboards to view key metrics
- Export to data destinations
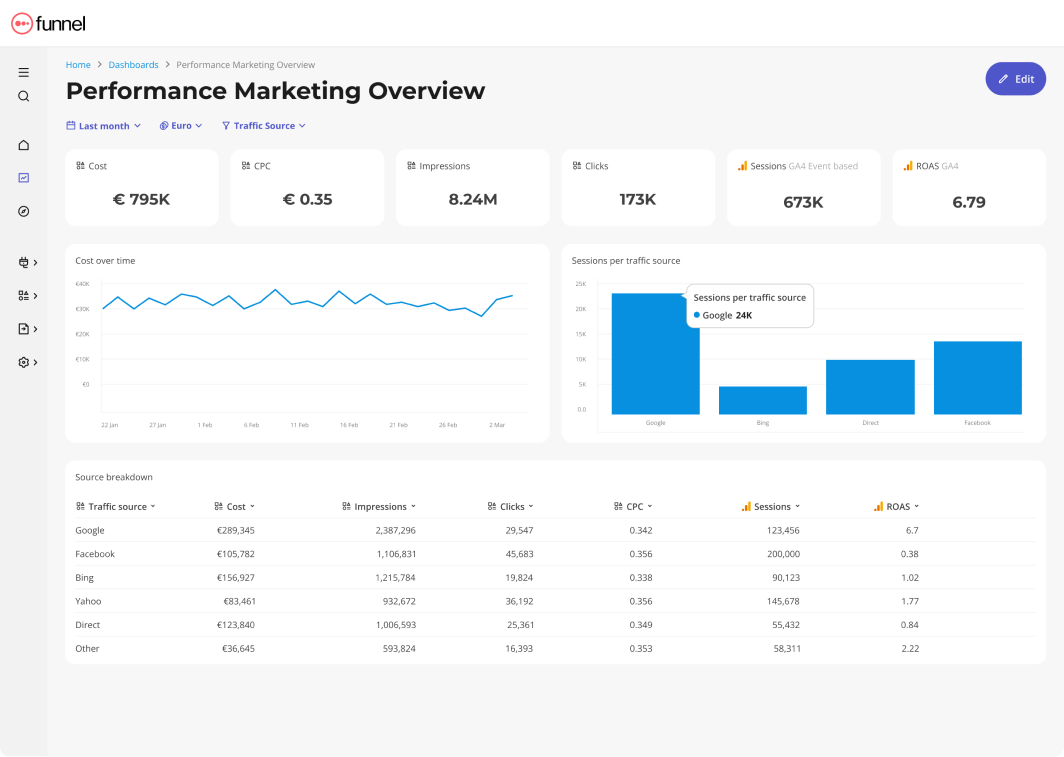
Funnel Reviews from Real Users
“What I like most about Funnel is how customizable it is. Within their Data Explorer you can look at the data in any way please and any possible configuration. you can create custom metrics and dimensions and any type of filter imaginable.” (Source)
“When you got everything set up, which is kind of a lengthy process, Funnel is inutitive and makes your reporting quick and reliable. Customer support is responsive and friendly.” (Source)
“Although the tool is powerful and useful, the incremental price increase makes it a bit harder to sell to our executives, and we need to continuously pause datasources if we no longer use them to save previous flexpoints.” (Source)
Pros
- A wide range of connections with all major marketing platforms
- Low-code data organization interface
- Fast and helpful customer support team
Cons
- Initial steep learning curve
- Occasional bugs in connectors
- Basic native visualization widgets
Funnel.io Pricing
Funnel bases its price on “flexpoints” which are usage credits you can use to add new data connectors, transform data, and move it to destinations.
As of December 2024, there are three distinct pricing plans: Starter, Business, and Enterprise.
- Starter — $1.2 / flexpoint per month. This plan allows you to connect the first 3-5 sources and use 350 flexpoints* for free. It includes 121 core integrations, 3 Core destinations, and the Data Explorer.
- Business — $1.5 / flexpoint per month. Gives you everything in Starter plus 381 additional Business connectors, 37 Business destinations, data source templates, and unlimited workspaces.
- Enterprise — $2.0 / flexpoint per month. The plan designed for organizations operating at scale includes everything in Business plus 11 Enterprise connectors, 1 additional Enterprise destination (Snowflake), data region choice, and technical account management.
This means a larger agency or business with dozens of data sources and destinations could expect to pay anywhere between $1500 to $4000 per month.
4. Tableau
Most suitable for: Data teams at large enterprises
If you want to skip the data warehousing altogether and spring right to a powerful data visualization tool, Tableau is a great choice.
Tableau is a capable business intelligence tool that comes with an intuitive drag-and-drop interface you can use to quickly generate insights and share them as reports with stakeholders.
Compared to Fivetran, which requires you to move data to a data warehouse and then visualize it in a BI or data visualization tool, with Tableau, you can connect your sources and visualize the data immediately.
It supports advanced calculations, data blending, statistical functions, and predictive modeling.
You can analyze complex data in different ways to uncover trends and identify opportunities for optimization using trend lines, forecasting, and clustering.
If you have no prior experience with Tableau, you can purchase “Success Plans” that include personalized support and training.
In addition, Tableau is known for a large and active user community called “Tableau Community Forums”, which is a treasure trove of resources, forums, and online training materials.
Still, keep in mind that Tableau is an enterprise-grade tool that doesn’t come cheap either.
Key Features
- 90+ integrations
- Custom metrics and dimensions
- Data blending
- Drag-and-drop dashboard interface
- AI-powered insights
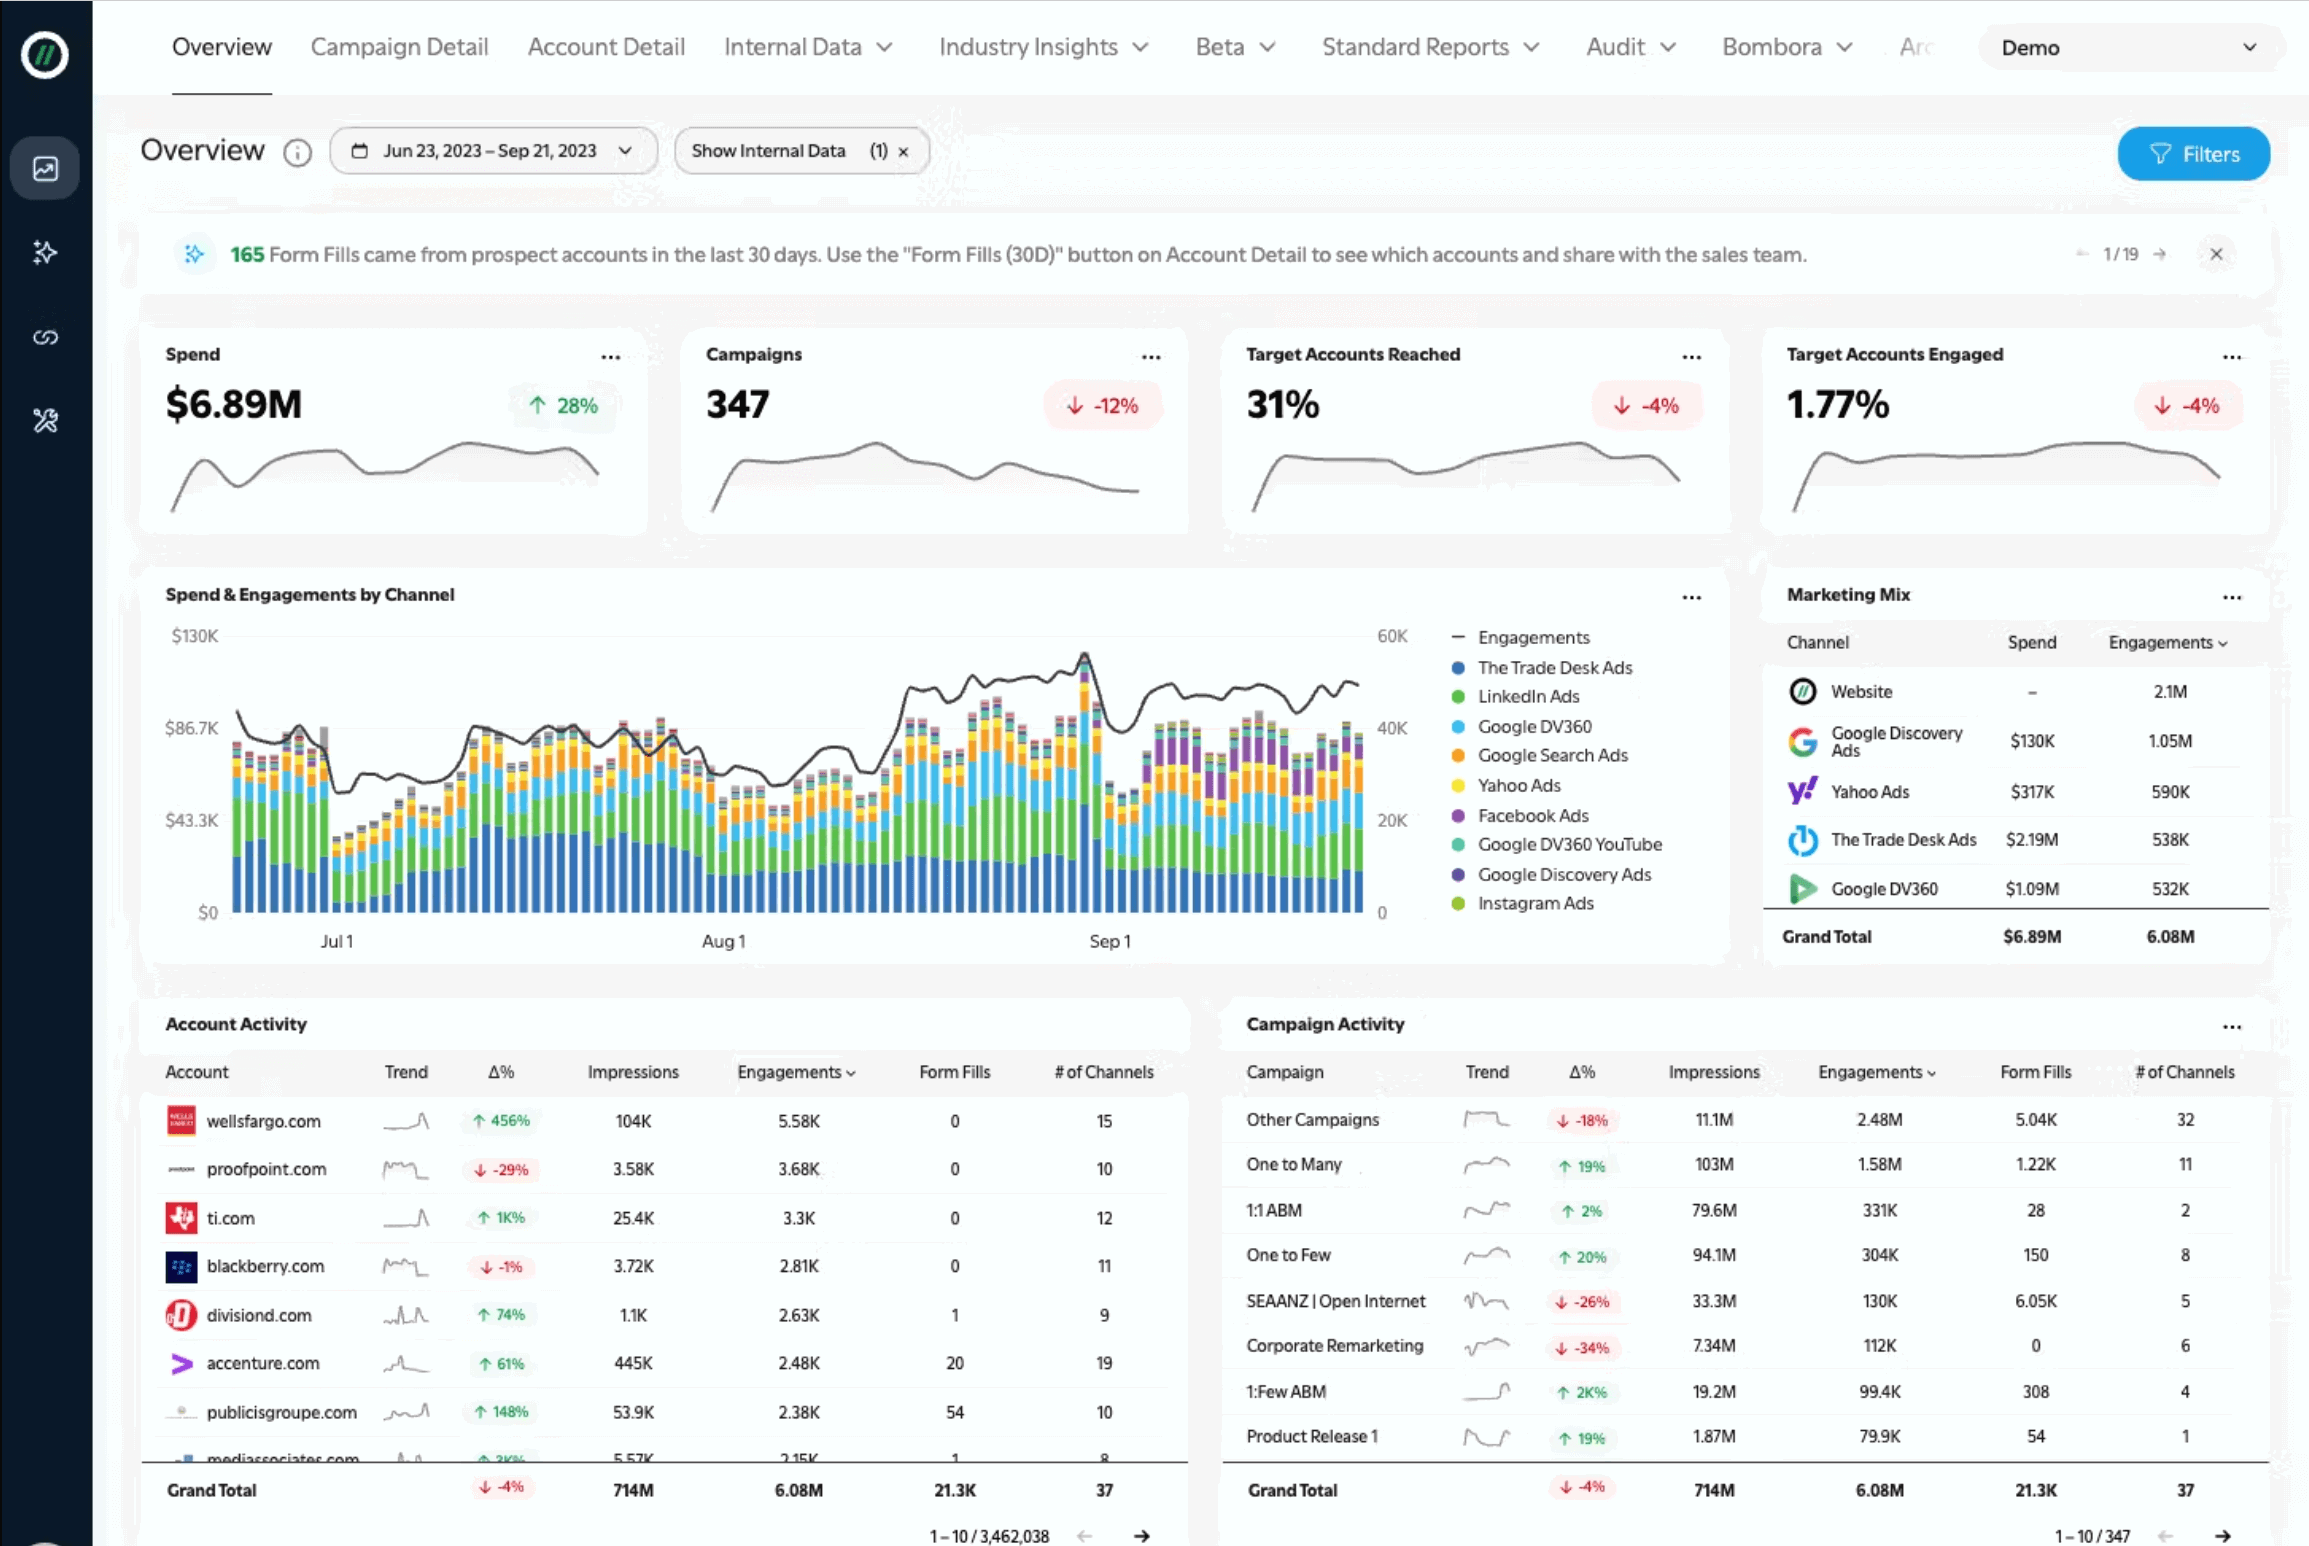
Tableau Reviews from Real Users
“My favorite aspect of Tableau is that it forces me to track my performance by metrics in a more straightforward way. These interactive dashboards let me see my performance at a glance, and identify trends or areas where I need to improve.” (Source)
“The drag-and-drop interface of Tableau is user-friendly especially for individuals lacking extensive technical knowledge” (Source)
“Tableau can be costly, particularly for startups. Even with its flexibility, the licensing model still adds costly, especially when you extend usage across teams or a complete company.” (Source)
Pros
- Powerful data analytics and visualization
- Easy to use and implement
- Seamless data integrations
Cons
- Can be expensive if you need advanced features
- Takes a lot of time to load for large datasets
- All the preprocessing of the data (data cleaning) has to be done beforehand. Data cleaning cannot be done in Tableau
Tableau Pricing
As of December 2024, Tableau offers three pricing plans:
- Viewer — $35/user/month, billed annually
- Explorer — $70/user/month, billed annually
- Creator — $115/user/month, billed annually
5. Power My Analytics
Most suitable for: Data scientists at small businesses and boutique agencies
Power My Analytics is a data pipeline and ETL tool (Extract, Transform, Load) that pulls data from 44 digital marketing platforms and sends it to data warehouses, visualization and BI tools, and spreadsheets.
The main advantage of Power My Analytics over Fivetran is that you don’t need any coding to use it. This makes it more suitable for marketers and non-technical users.
You can use it to blend data from multiple sources, create custom metrics, and dimensions through Looker Studio. With Fivetran, on the other hand, all transformations are done post-load, within a destination using SQL or tools like dbt.
Users on G2.com also praise Power My Analytics’ user-friendly interface. Power My Analytics is also less expensive than Fivetran with plans starting as low as $14.95/month (for one single source).
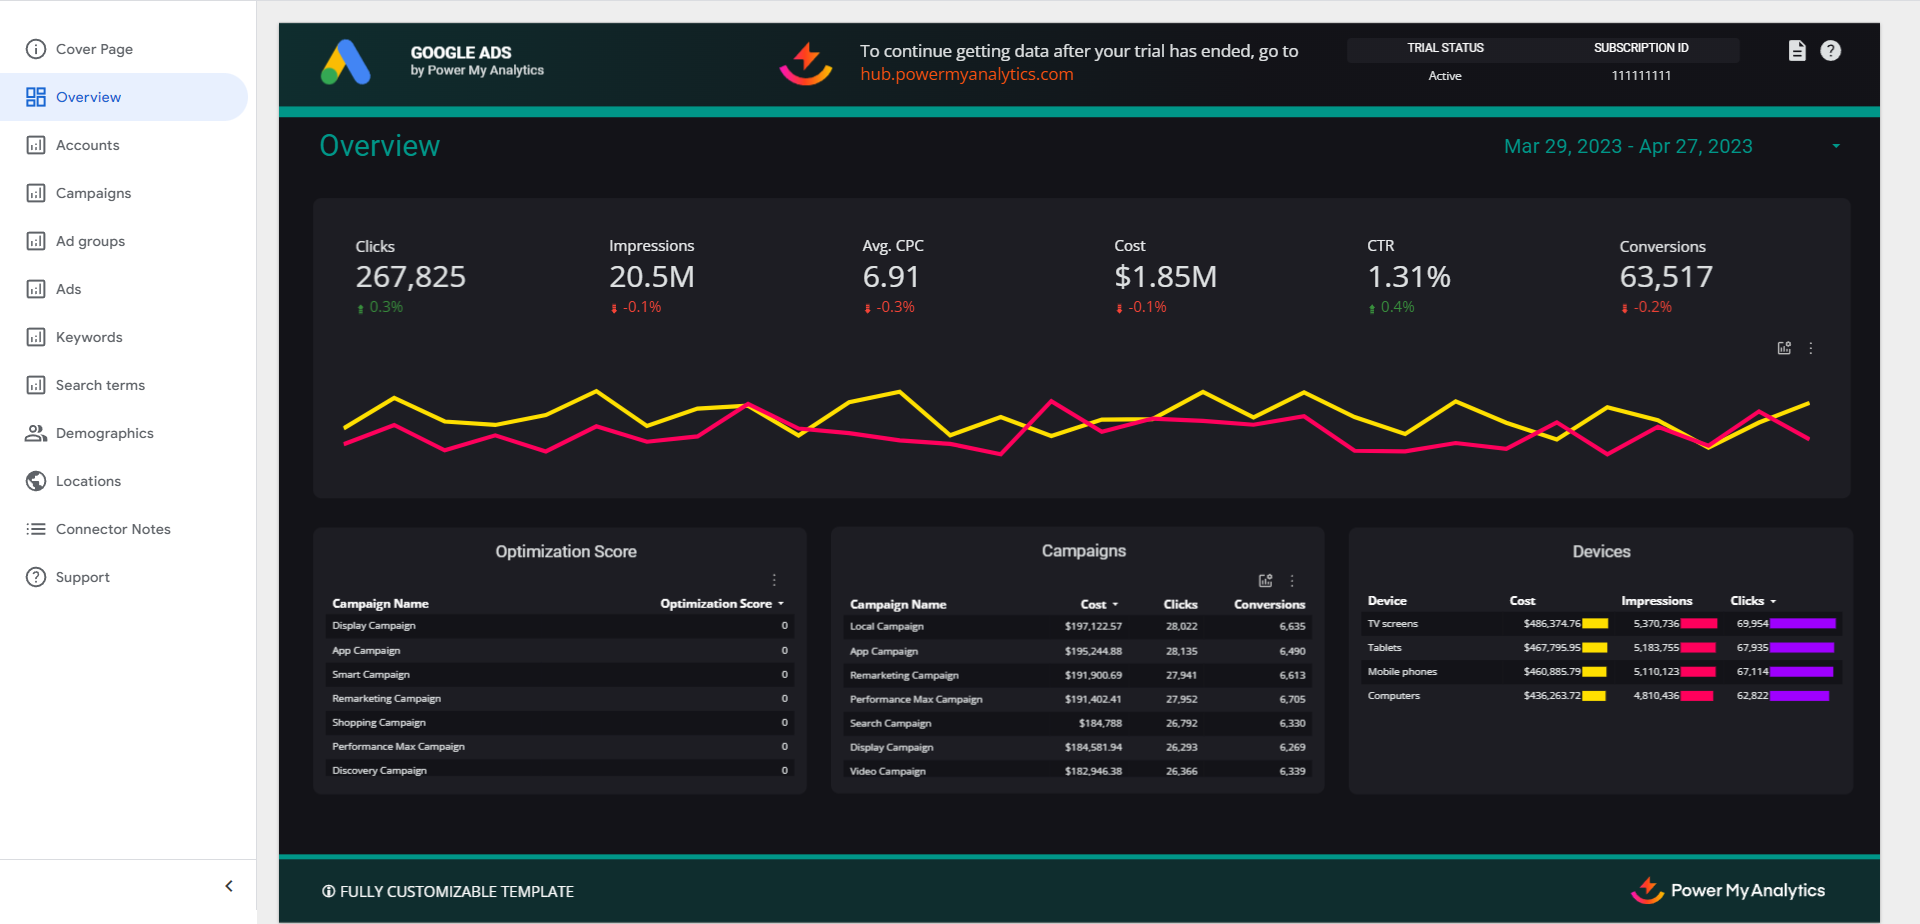
Power My Analytics has a “Data Explorer” dashboard, it’s more suitable for internal reporting and metric tracking, rather than for client reporting.
If you’d like to white-label or customize your reports, you’ll still need to rely on third-party tools like Looker Studio.
Key Features
- 40+ native connectors
- In-house data storage and warehousing
- Data exporting to visualization tools, warehouses, or spreadsheets
- Report templates available for Looker Studio
Power My Analytics Reviews from Real Users
“The help center is written very well and helped me finish creating the data source of my Amazon Ads.” (Source)
“There are preset templates that make it easy to build great insight slides in Google Data Studio.” (Source)
“It's a little confusing to understand how to connect up a dashboard template but overall a great experience.” (Source)
Pros
- Easy to use and set up
- Affordable pricing
- Accurate data and stable connections
Cons
- Limited number of connectors compared to Supermetrics and Funnel
- No live chat
- Limited templates for visualization
Power My Analytics Pricing
As of December 2024, Power My Analytics offers four pricing plans:
- Single — $14.95/month for 1 source, 1 account, and 1 admin
- Business — $39.95/month for 5 sources, 1 account, and 2 admins
- Pro — $99.95/month for unlimited sources, 20 accounts, and unlimited admins
- Enterprise — $295/month for unlimited sources, 20 accounts, and unlimited admins. Comes with your own data warehouse and dedicated representative.
6. Klipfolio
Most suitable for: Large data teams at companies and large agencies
Klipfolio is a data analytics and business intelligence tool in one. It consists of two key products:
- PowerMetrics: Most useful for data teams at large companies. It’s a data analytics platform that helps you centralize, standardize, and share accurate metrics within your organization. Non-data teams can then use these unified and standardized metrics in their dashboards and reports.
- Klips: You use these to visualize your data in regular dashboards and reports. Klips connect to 130+ platforms with an added option to integrate custom sources using a Rest/URL API.
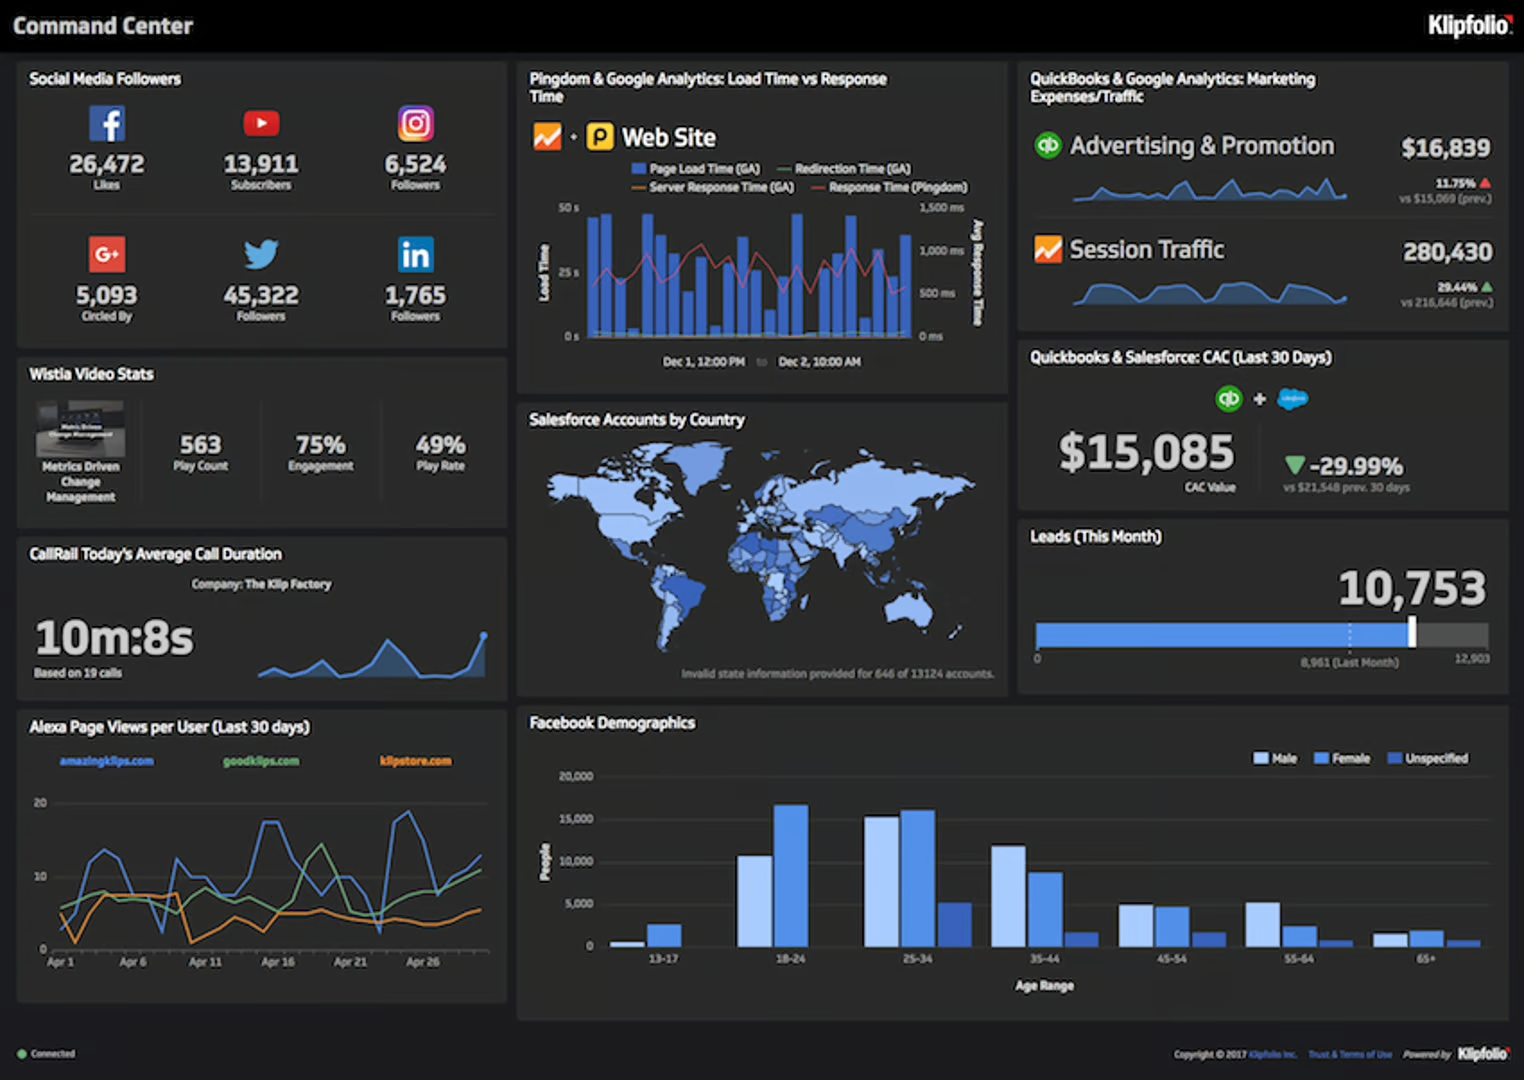
The main advantage over Fivetran is that Klipfolio comes with a built-in dashboard tool (Klips) that lets you visualize your data without having to export it elsewhere.
With Klips, you can:
- Pull data stored on the platform or in the cloud, connect spreadsheets, or write custom visualization queries.
- Visualize selected metrics and complex data.
- Use Excel-style formulas to transform your data, create calculated metrics, and more.
- Build dashboards that refresh data in real time.
Klipfolio users praise the user-friendly interface and drag-and-drop Klips builder.
Unlike Fivetran’s usage-based pricing, Klipfolio’s subscription-based pricing is more suitable for agencies and SMBs.
Still, keep in mind that you need to pay for two separate products: PowerMetrics and Klips if you want the full experience.
Key Features
- 130+ integrations, including warehouses, SQL databases, and file-sharing services
- Data blending, unifying, aggregating
- Custom metrics and dimensions
- AI insights
- Custom dashboards and reports
- Export dashboards as PDF or image files. Export only individual clips as CSV
- Scheduled reports
Klipfolio Reviews from Real Users
“I needed something to convert Google sheets into dashboards to monitor our maintenance logs. Klipfolio we an incredibly intuitive quick solution.” (Source)
“The platform can run a little slow sometimes, particularly when performing complex actions. With Klips, data sources are always fully refreshed when loading up a dashboard, which can drag down the performance when working with multiple data sources at the same time.” (Source)
“I really dislike their training style. It's costly, and you have to pay a lot for a support ninja to help you. If you're a small company, it can run up your bill fast.” (Source)
Pros
- Easy to use and set up
- Powerful data analytics and organization options
- AI insights to help make data-driven decisions
Cons
- Expensive with important features only available as add-ons or in Enterprise plans
- Limited customization for dashboards and templates
- Unhelpful customer support
Klipfolio Pricing
Klipfolio offers three pricing plans for two of their products: PowerMetrics and Klips.
As of December 2024, here are the plans for PowerMetrics:
- 30-day free trial
- Professional: $300/month for 10 users and unlimited metrics.
- Enterprise: Custom pricing for 10 users, unlimited metrics, and priority support.
The Enterprise plan comes with data warehouse integration, AI insights, and custom domains, which are only available as add-ons on the Professional plan.
Klips’ pricing is further divided into plans for businesses and for agencies.
As of December 2024, here are the plans for businesses:
- Base — $90/month for 3 dashboards and 4 hr data refresh rate. No priority support or custom onboarding available.
- Grow — $190/month for 10 dashboards and 1 hr data refresh rate. No priority support or custom onboarding available.
- Team — $350/month for 20 dashboards and 15 min data refresh rate. No priority support or custom onboarding available.
- Team+ — $690/month for 60 dashboards and up to the minute data refresh rate. Includes priority support and custom onboarding.
Here are the plans for agencies:
- Agency Starter — $110/month for 5 dashboards, 5 clients, and 4 hr data refresh rate. No priority support or custom onboarding available.
- Agency Lite — $190/month for 15 dashboards, 15 clients, and 1 hr data refresh rate. No priority support or custom onboarding available.
- Agency Pro — $420/month for 30 dashboards, 30 clients, and 30-min data refresh rate. No custom onboarding available.
- Agency Premier — $1025/month for 80 dashboards, 80 clients, and 30-min data refresh rate.
7. Adverity
Most suitable for: Data analysts and engineers
Adverity is a no-code data integration platform that you can use to connect scattered data sources, cleanse the data, move it to a destination or share it with your team.
Apart from data integrations and API-like connectors that process any type of data or format, you can upload custom data through spreadsheets, Excel, JSON, or .xml files.
With the data on the platform, you can use its transformation engine to clean, normalize, and unify data to prepare it for visualization.
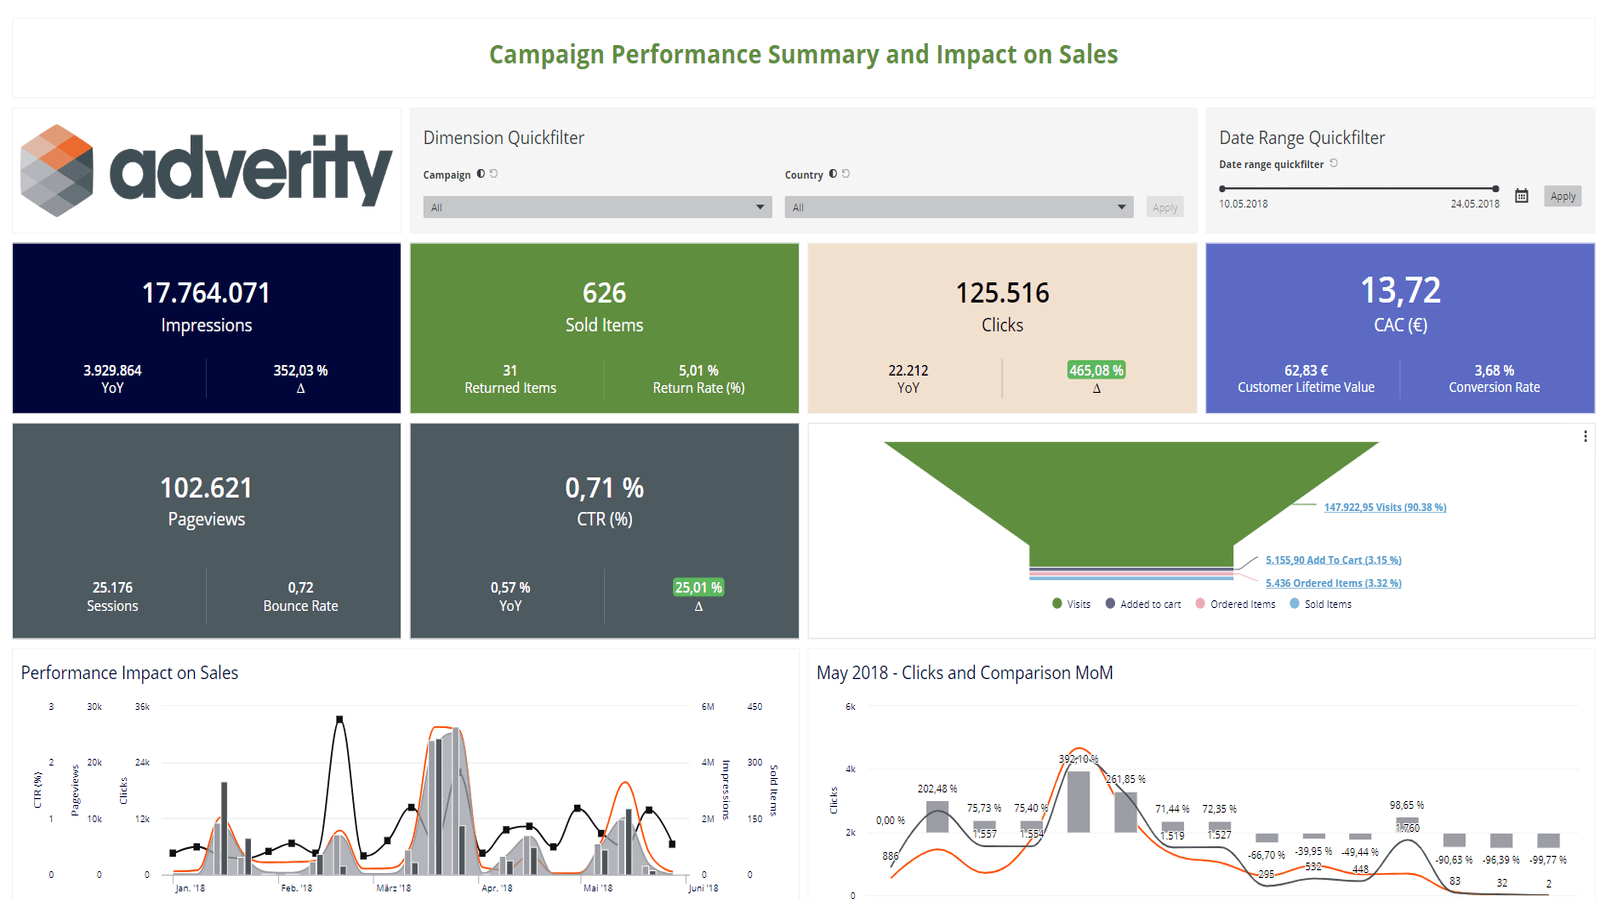
Similar to Funnel and Power My Analytics, Adverity has a basic “Data Exploration” dashboard, where you can view organized data in charts and graphs.
However, these dashboards are not replicable, as you need to create every one from scratch. There is not much you can do to customize or white-label them.
Like Supermetrics, and also Fivetran at one point, you need a third-party visualization tool like Looker Studio to create reports you can share with clients or a wider team.
However, unlike Fivetran, Adverity is praised for its strong customer support team.
Key Features
- 600+ pre-built connectors
- Custom integrations via spreadsheets, Excel files, .json, or .xml files
- Data transfer to databases and data lakes
- AI-powered data transformation engine
- Built-in data governance
- Data Explorer dashboard
Adverity Reviews from Real Users
“What I like about Adverity is its ability to pull data from a wide range of platforms, harmonize, and enrich it, and then push it to a destination of your choice.” (Source)
“Consolidation of different APIs was really easy, it was like discovering Datastudio for the first time but it's a bit better.” (Source)
“The follow-up on tickets could be better. We have to ask for updates very often and get one every time. This implicates that updates are there, but not being communicated, leaving us craving for info.” (Source)
Pros
- No-code ETL transfers
- Predefined data transformation
- A large number of sources and destinations
Cons
- Difficulty to use and set up
- Basic dashboards and reports
- Even the basic pricing may be too expensive
Adverity Pricing
Adverity has a custom pricing model. To find out how much it could cost you, you need to fill out a form and book a demo session. However, in 2022, a G2 user revealed that the pricing starts from 1500 Euros a month.
Test use cases we’ve run at Whatagraph show Adverity is at least 50% to 60% more expensive than us, while not including visualization and custom reports.
8. Improvado
Most suitable for: Data teams and marketing teams at large companies
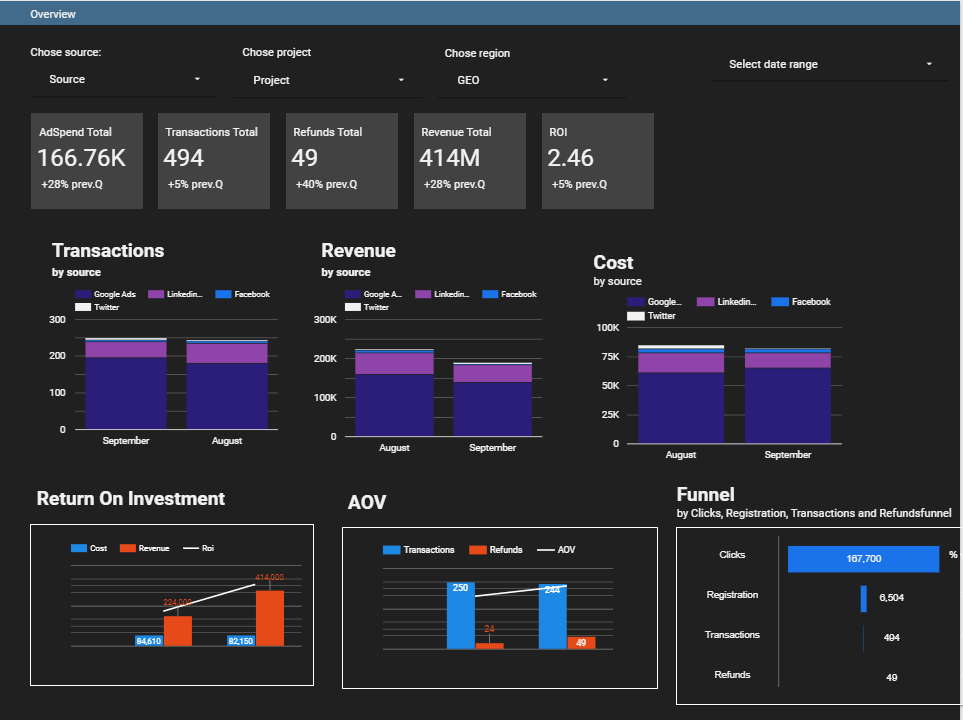
Improvado is an end-to-end data aggregation platform that connects data from marketing platforms, MarTech tools, and CRMs, transforms it, and moves it to different destinations.
You can pull data from over 500 channels to standardize and clean it into unified datasets. From there, you can keep your data in a fully managed storage or push it to data visualization tools, data warehouses, or spreadsheets.
This means that just like with Fivetran, Supermetrics, and Adverity, you need a third-party tool like Looker Studio to visualize your data and prepare it for client-facing reports.
Improvado gives you a small advantage here, as it offers pre-built dashboards that you can use right away with your visualization tool of choice. This way, you don’t need to spend a lot of time creating reports from scratch.
Still, implementing Improvado in your organization can take time, and you’ll either need a data engineer or strong coding skills to build dashboards for different use cases.
Because of this, Improvado is a more suitable tool for enterprises that need a powerful data analytics platform, but it may be overwhelming for marketing agencies and small businesses.
Key Features
- 500+ integrations
- Fully-managed data storage
- Unlimited data destinations
- Pre-built dashboards
- AI-driven data transformations
- Marketing attribution
- AI-powered campaign governance
- AI-insights
Improvado Reviews from Real Users
“Improvado has a lot of out of the box API integrations that help us bring all our data together in 1 place. Adding a new data connection is simple and straight forward.” (Source)
“The set-up takes quite a long time, but once all the sources are added, it becomes much more manageable and less time-intensive.” (Source)
“There is a steep learning curve, and if you aren't familiar with databases, Excel, and data transformations, this could be a really tough software to implement.” (Source)
Pros
- Powerful data analytics
- AI-powered insights
- Helpful customer support
Cons
- Can be expensive for small businesses and agencies
- Long implementation time
- Steep learning curve
Improvado Pricing
Improvado doesn’t share their pricing publicly but from what we can learn from online reviews and blog articles, the total cost can be anywhere between $2,000-$5,000 per month.
9. Domo
Most suitable for: Data teams and tech-savvy marketing teams
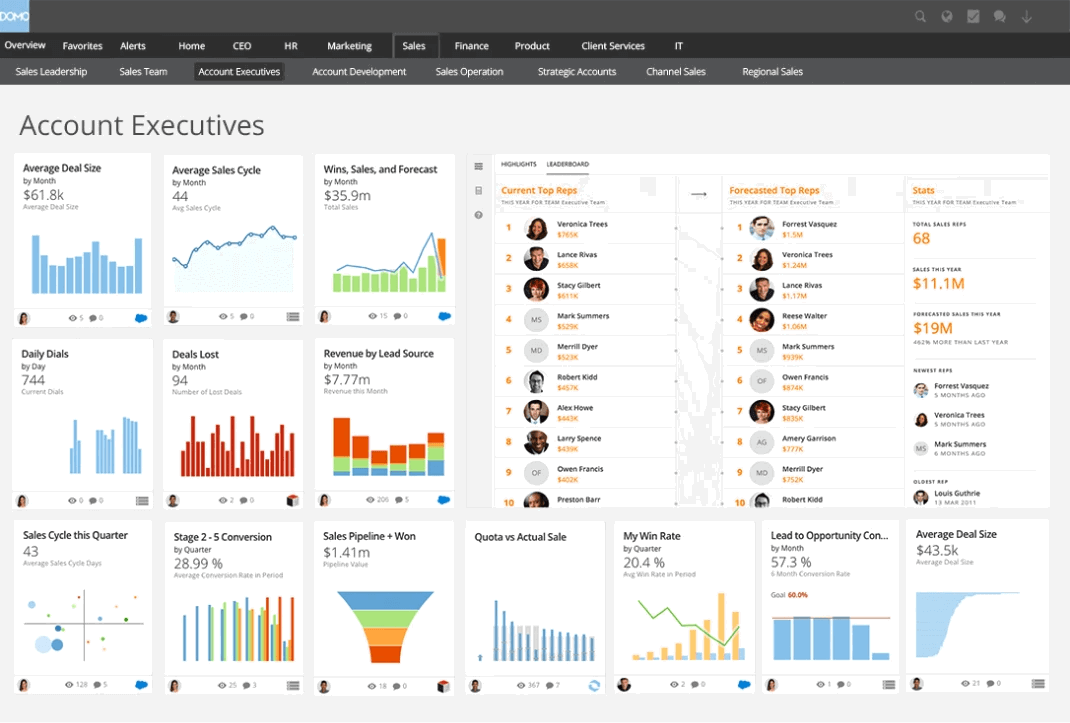
Domo is a cloud-based business intelligence platform that you can use to connect and prepare data, automate reporting, and deliver fast insights that fuel data-driven decisions.
If you’re skilled enough, you can use Domo to create business apps and dashboards or build data experiences that integrate real-time data from any source.
Unlike Fivetran, Domo comes with native data visualization, embedded analytics, and self-service reporting.
These features put Domo as a one-stop data experience solution for executives across departments from sales and finance to marketing, to engineering and HR. Such versatility is supported by over 1,000 data connectors.
Key Features
- Data and workflow apps - pre-built, low-code, or full-code
- Drag-and-drop report and dashboard builder
- 1,000 on-premise and cloud connectors
- Data transformation and ETL
- Embedded analytics
- Mobile app
Domo Reviews from Real Users
“Domo provides options that cater to all data proficiency levels across the product offering, typically a pro full code level, code-less drag and drop function gui, and no code option for novices or very simple tasks.” (Source)
“You won't see much of the themes and creative visuals here. Only limited themes are there which can make almost all the dashboards/apps look similar.” (Source)
“Products have become more buggy since the introduction of app studio in April of 2024. Training is good for the core product but it is difficult to find education on new products/tools.” (Source)
Pros
- Easy-to-use interface
- Real-time data access
- Wide choice of visualizations
- Large number of connectors
- Mobile access
Cons
- Steep learning curve despite user-friendly user interface
- It might require some SQL knowledge
- Performance issues with large datasets
- Costly additional features
- Limited report scheduling options
- Potential downtime issues due to cloud-based infrastructure
Domo Pricing
Domo has a free 30-day trial and three pricing plans, but pricing is not publicly available. You have to ask their sales team for a quote. The pricing is based on the overall usage of the platform and factors such as data storage, data refresh rates, the number of users, the volume of data queries, etc.
10. Datorama (Marketing Cloud Intelligence)
Most suitable for: Marketers and data teams at large companies
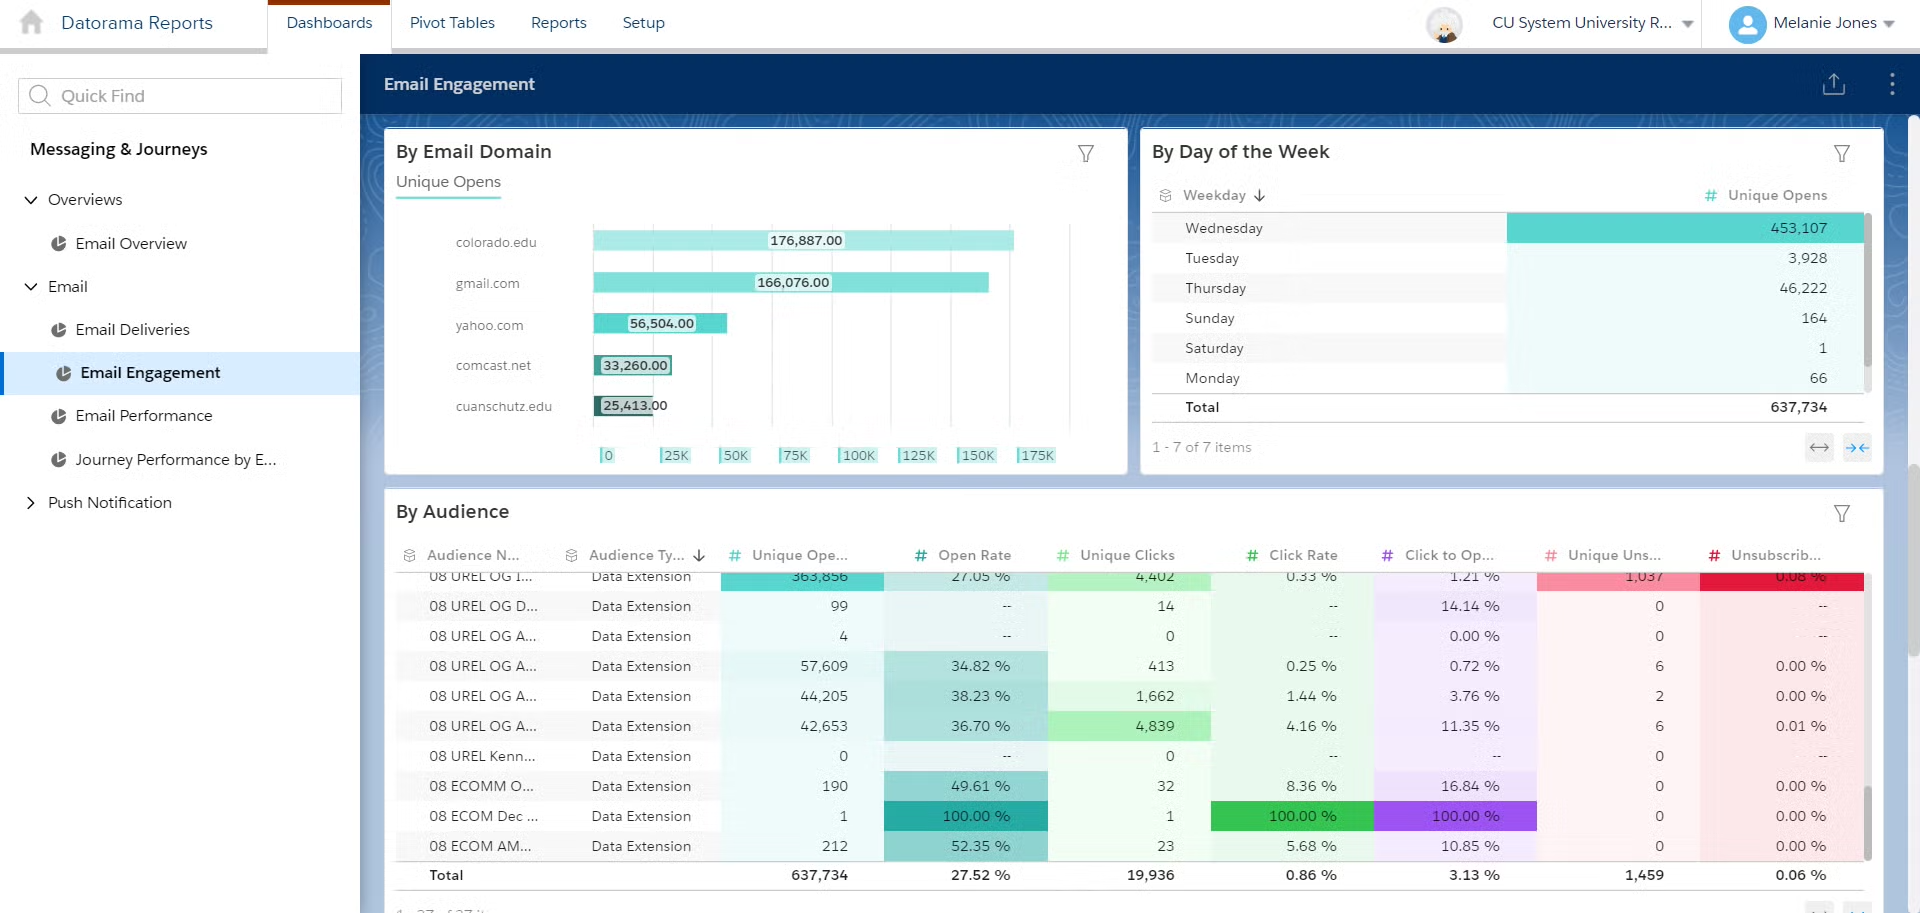
Datorama is a cloud-based, automated marketing intelligence platform that helps users combine, onboard, and visualize data.
Owned by Salesforce and rebranded as Marketing Cloud Intelligence, this platform helps large systems integrate data from all their marketing platforms, build reports, and generate in-depth insights into their marketing efforts.
You can use it to connect cross-channel data to a single dashboard and analyze it for more informed actions. As primarily a marketing intelligence platform, Marketing Cloud Intelligence helps you simplify the marketing data analysis processes.
Although the pricing plan for small businesses starts at $1,500, MCI still has an edge over Fivetran because it can prepare and visualize data natively.
Key Features
- Advanced data management capabilities
- Media planning and media buying optimization
- Workflow builder
- Viewer-facing filters
Datorama Reviews from Real Users
“Salesforce Marketing Cloud Intelligence is very easy to use and very easy to implement. It has multiple features that can be integrated. I frequently use this platform. And also it gives great customer support.” (Source)
Pros
- A large number of data sources and destinations
- Advanced data exploration features
- AI-powered tools
- KPI-oriented insights
- Commendable customer support
Cons
- Bit more complex to use
- Requires some SQL knowledge to maximize usefulness
- Expensive for most potential users
Marketing Cloud Intelligence Pricing
As of December 2024, Marketing Cloud Intelligence comes in four pricing plans:
- Starter Suite — $25/user/month, dynamic email marketing and analytics, out-of-the-box sales processes, seamless customer service, simplified storefront builder.
- Pro Suite — $100/user/month, in Starter plus enhanced, real-time chat, greater customization and automation, sales quoting and forecasting, and access to AppExchange.
- Marketing Cloud Growth Edition — $1500/org/month, Agentforce campaigns, multi-channel journeys, forms and landing pages.
- Marketing Cloud Advanced Edition — $3250/org/month, Agentforce campaigns and AI scoring, path experimentation, unified conversational sms.

WRITTEN BY
Nikola GemesNikola is a content marketer at Whatagraph with extensive writing experience in SaaS and tech niches. With a background in content management apps and composable architectures, it's his job to educate readers about the latest developments in the world of marketing data, data warehousing, headless architectures, and federated content platforms.