Why Is Looker Studio Slow? 6 Ways to Make It Faster
Looker Studio taking too long to load? You’re not alone.
I scoured Reddit threads and community forums and one thing is clear – everyone’s frustrated with Looker Studio's slow load times, broken charts, and dashboards that freeze at the worst possible time.
But we’re here to help.
In this article, you’ll find 6 different reasons why your Looker Studio dashboard might be slow and how to fix each issue.

Jun 16 2025●6 min read


- Why is Looker Studio slow?
- Reason 1: You’re working with large and complex datasets.
- Reason 2: You’re using live connections.
- Reason 3: You’re manipulating data inside of Looker Studio.
- Reason 4: You have too many components or pages in your reports.
- Reason 5: You’re using third-party data connectors.
- Reason 6: You're facing platform-wide performance issues.
- The Easiest Fix: Use Whatagraph for Faster, Smoother Marketing Intelligence
Why is Looker Studio slow?
Looker Studio is slow because of these key reasons:
- You have large datasets.
- You’re using live connections to bring Google data into Looker Studio.
- You’re using finicky third-party connectors to bring non-Google data into Looker Studio.
- You’re then manipulating the data like creating data blends and calculated fields inside of Looker Studio.
- You have too many components or pages in a report.
- It's not you, it's Looker Studio's system issues.
These issues aren’t standalone either – usually two or more are happening at the same time.
In the next sections, we’ll go through each reason why Looker studio loading slow and recommended fixes for each.
Reason 1: You’re working with large and complex datasets.
Looker Studio has a 6-minute limit on handling queries, and large data requests can cause your report to load slowly or time out.
In fact, Tanja Keglić, Performance Marketing Manager at Achtzehn Grad agency, ran into this exact issue.
Before she became a Whatagraph customer, she was using Looker Studio to create reports for a large automotive client with multiple data sources and platforms, which made Looker Studio very slow. She shared:
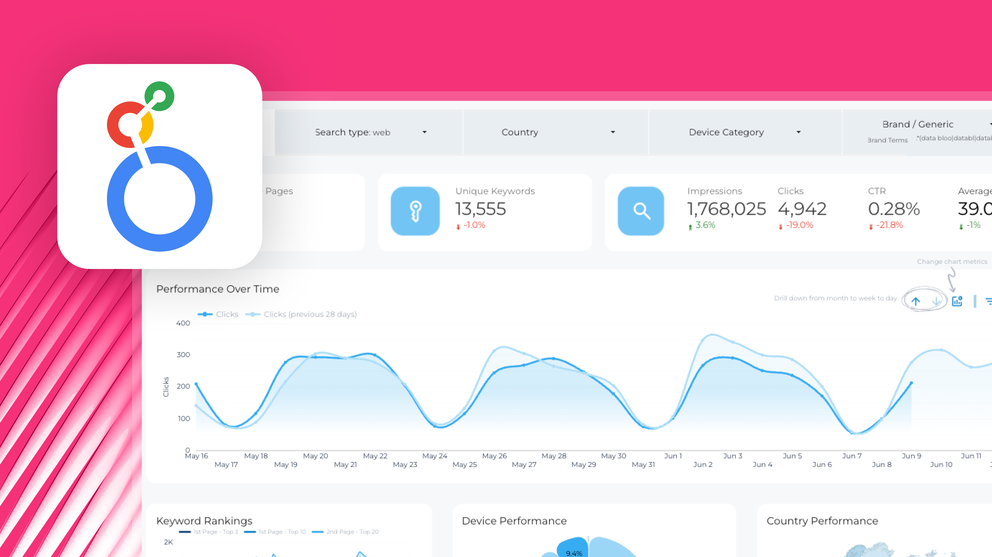
We wanted to see our data quickly, but Looker Studio took so long to load.
This made it difficult to optimize campaigns, answer ad-hoc client questions, and work at the pace her team needed.
✅ How to fix this: Reconfigure your data setup
Keeping your data tight and focused is key to speed up Looker Studio. You can do so in four ways:
- Shorten date ranges: Only show recent data unless you really need long-term views.
- Filter out unneeded rows: Don’t pull in every campaign or ad set, just the top performers or key segments.
- Remove unused fields: Only include the dimensions and metrics you actually use in your visuals.
- Adjust the data freshness rate: Each type of data source in Looker Studio has its own default data freshness threshold, but you can adjust this to be less frequent – e.g. daily refresh instead of hourly. This means you won’t get up-to-date data all the time, but your reports would load faster.
Alternatively, you can switch to a much faster and stable platform like Whatagraph which can handle 10 sources and 100 widgets without slowing down, and has an uptime of 99.95%. This means it can handle large datasets and system-wide outages are very, very rare.
When Tanja switched to Whatagraph, she appreciated how fast the platform was. She said:
Whatagraph is very, very quick when loading the data. Even when I change a source in the report, it’s super quick and I barely ever have to wait.
Plus, you won’t have to trade-off your data freshness. Whatagraph offers a consistent 30-min refresh rate across all your sources, blends, and platforms.
Reason 2: You’re using live connections.
Live data is great, until it starts dragging your dashboard down.
By default, Looker Studio connects live to your data source. This means every time a user loads or filters the report, Looker fetches fresh data directly from the platform: Google Analytics 4, Google Search Console, Google Ads, e.t.c.
If your dashboard has multiple data sources (and most do), that’s several real-time queries firing at once.
The issue worsens when those data sources are external or under load. Public cloud APIs, custom connectors, or self-hosted databases (like Redshift or PostgreSQL) can add extra network latency, timeout errors, or fail to respond altogether.
And when your dashboard depends on live data, any hiccup on the source side breaks the whole experience.
✅ How to fix this: Use extracted or cached data
Instead of live data, use a snapshot of your data - also known as extracted data source.
You can do this through Looker Studio’s “Extract Data” connector. Instead of querying live data every time someone opens the report, Looker pulls from a preloaded subset of your data.
What it does:
- Lets you choose specific fields, filters, and date ranges to limit the amount of data loaded
- Works with any data source
- Allows you to apply your own aggregations (e.g., Sum, Average) for more flexible analysis
How to do it:
- Go to Looker Studio → Create → Data Source → Select Extract Data.
- Pick your existing data source.
- Choose only the metrics and dimensions you need.
- (Optional) Add filters or apply a date range to limit the data further.
- (Optional) Turn on Auto update and set a refresh schedule.
- Click Save and Extract—then connect this source to your report.
Keep in mind: Extracts have a 100 MB limit, and the data is static unless you enable auto-refresh.
For more information, you can check out Google’s documentation.
This approach is ideal when you don’t need real-time data but want a dashboard that loads fast.
The other option is to pull your data into Google Sheets or Google BigQuery first, and then connect Looker to that source. It’s more reliable and way faster.
But then this also means the process would still be quite manual, you’d still be lost in different spreadsheets and tools, and there’s a lot of room for human error in your data.
Reason 3: You’re manipulating data inside of Looker Studio.
Looker Studio was built for data visualization, not data transformation.
When you manipulate your data, like creating custom dimensions, calculated fields, complex filters, or do data blending inside Looker, it slows down the platform.
This is because every time you open a dashboard or change a filter, Looker has to:
- Pull raw data from each data source
- Apply your calculations and transformations
- Then render the visual
That’s a lot of processing happening in-browser, especially if you have large datasets.
Also, these transformations are not not reusable across dashboards, which means you'll need to recreate logic every time, increasing maintenance overhead and report load time.
In fact, Himanshu Sharma, Founder at OptimizeSmart, GA4 and GTM agency says:
Looker Studio is not meant for data manipulation. It is neither a spreadsheet nor a data warehouse. When you manipulate data in Looker Studio, it slows down your report.
✅ How to fix this: Manipulate your data in Google Sheets, BigQuery, or Whatagraph
The better alternative is to clean and prepare your data before it hits Looker Studio.
You can do so in two key ways:
- Google Sheets works well for small to medium datasets. You can structure your tables, apply formulas, and only pass in what you actually need.
- BigQuery is a better option for large datasets. You can pre-aggregate data with SQL, and if you enable BI Engine, it can return query results almost instantly.
- Whatagraph works for all kinds of datasets. You can connect all the data you need using our native, plug-and-go connectors and transform it any way you want through no-code flows. Then, pick metrics and dimensions, preview your data table, and start an automated transfer to Looker Studio.
Or, you can just use Whatagraph for the entire data flow from connection → transformation → visualization.
While Looker Studio is limited to 5 data sources per blend, with Whatagraph, you can create blends from unlimited sources.
And you won’t need to tinker with spreadsheets or BigQuery to manipulate your data – you can simply set everything up in no-code workflows.
For instance, say you want to see the total ad spend across three paid-per-click (PPC) channels – Google Ads, Facebook Ads, and LinkedIn Ads. You can simply create what we call a “Source Group” in literal seconds like so:
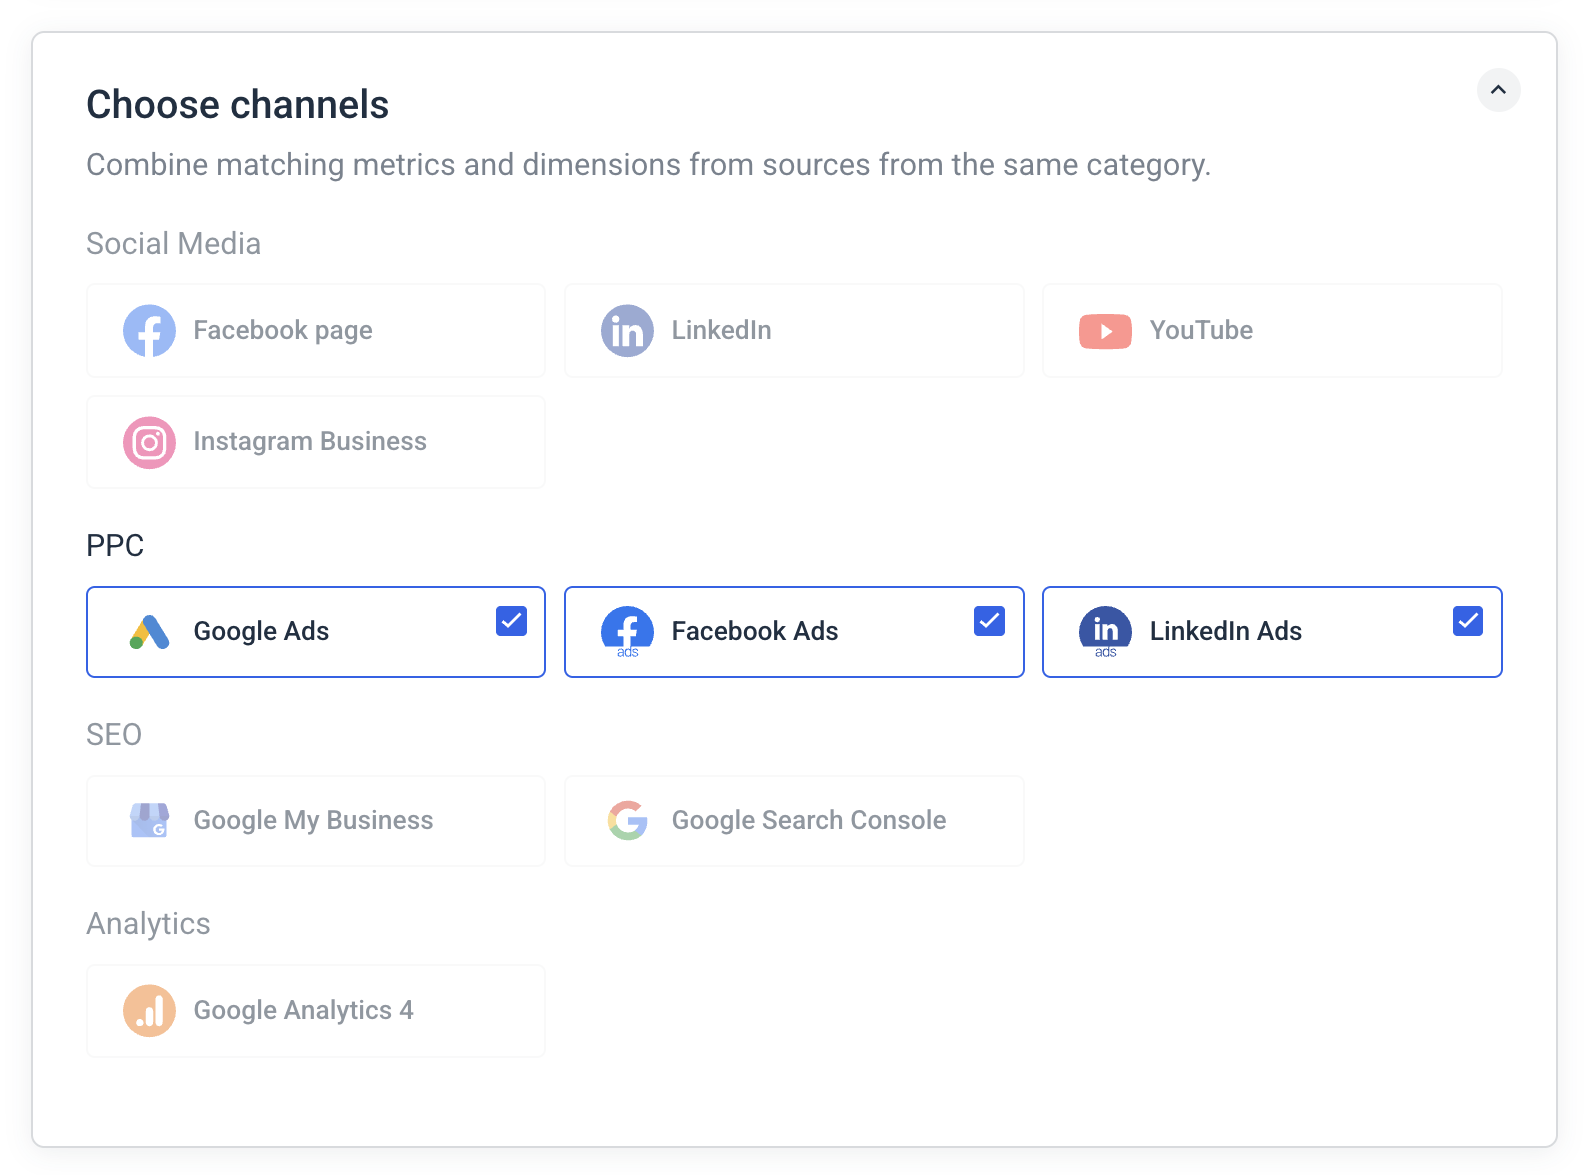 Then, you can select the report types, sources, and currencies you want to see your data in, and save this as a template you can re-use the next time.
In your report, you can then add a widget, choose this Source Group, and visualize any metrics you want from these three channels combined.
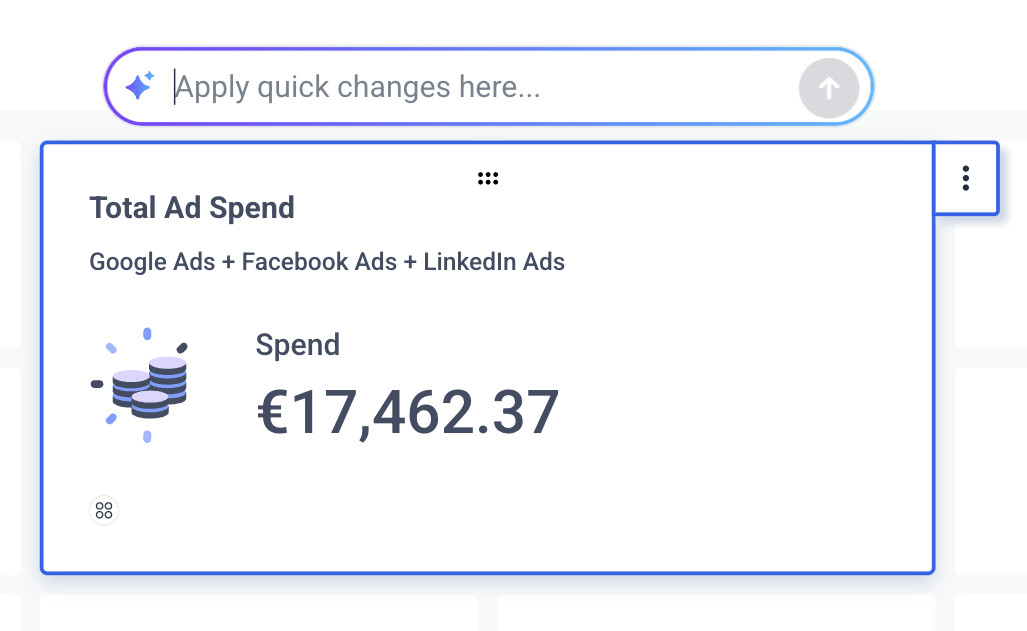 See that “Apply quick changes here…” box?
You can ask AI to edit that widget for you however you want. For example, say you want to change the metric to “Impressions” instead of “Spend” . You don’t need to do it manually – you can just ask AI and it’ll be done in seconds.
Reason 4: You have too many components or pages in your reports.
Every visual element on your Looker Studio dashboard, scorecards, charts, tables, filters, sends its own query to the data source.
That means if you’ve got 15 charts, 3 filters, and a date selector, Looker is sending 20+ queries all at once. Multiply that by live data connections and large datasets, and your dashboard slows down significantly.
Even if your data sources are small, the sheer volume of visual components can overwhelm the platform, especially when users scroll or interact with filters.
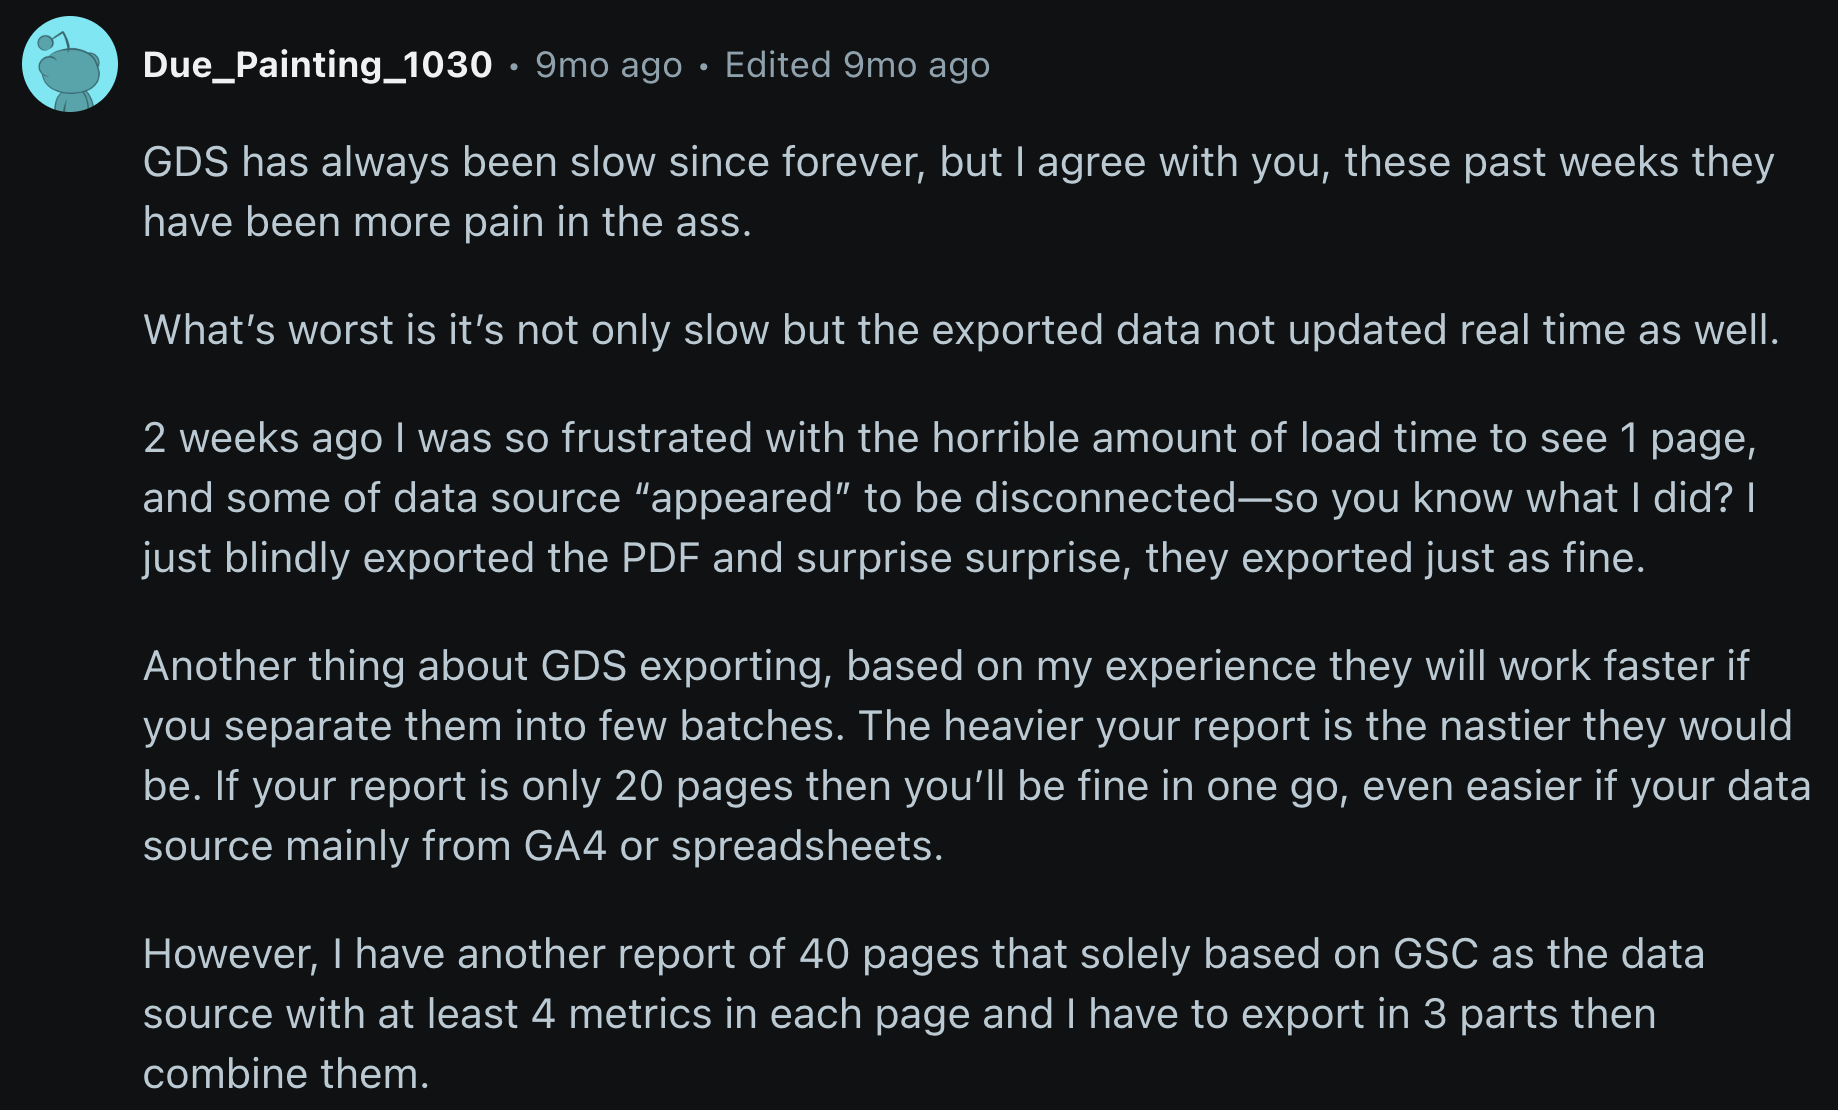
Another thing is, if you have over 20 pages in one Looker Studio report, it’ll take a long time for you to export them.
In fact, a Looker Studio user in this Reddit thread says “the heavier your report is, the nastier they would be.”
✅ How to fix this: Use fewer components and split reports into pages
This might seem obvious but the solution is to use fewer charts and components on each page.
Here are three ways you can do so:
- Combine metrics: Instead of having different scorecards, use one table to show your metrics together (e.g. clicks, impressions, CTR). For instance, MeasureSchool combined 3 scorecards into one table with 3 metrics and it reduced API calls by 66% and noticeably sped up performance.
- Avoid duplicate charts: If two charts show similar data, use filters instead of creating both.
- Split your dashboard into pages: Don’t put everything on one screen. Break it up into tabs so it loads faster.
Reason 5: You’re using third-party data connectors.
If you’re using third-party data connectors like Supermetrics or Funnel.io to pull in data from non-Google platforms, they’re going to slow down your reports.
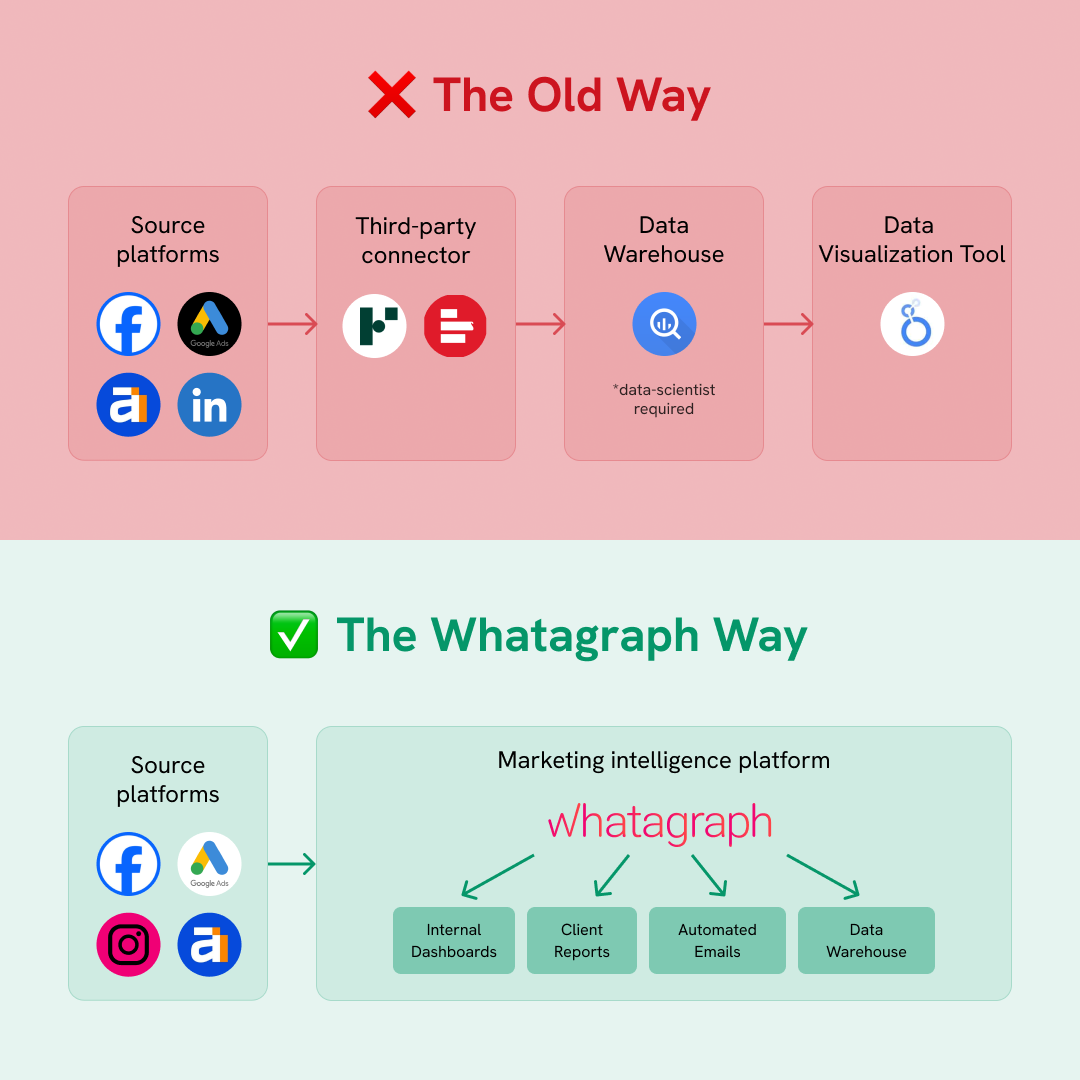
Each third-party connector adds an extra step between Looker and your data. So instead of one system talking directly to another, it’s:
Source platform → Third-party connector → BigQuery or spreadsheets→ Looker Studio
That means:
- More API calls
- More chances for delays or errors
- And a lot more waiting when loading your report
For instance, Tanja, Performance Marketing Manager at Achtzehn Grad, was using Supermetrics to pull non-Google data into Looker Studio.
Supermetrics connectors frequently broke, sources failed to load properly, and she had to either waste time fixing them herself or contacting Support for help. She said:
It’s such a pain to reconnect a lot of sources and accounts, and it takes so much time, which you don’t have when you want a quick report.
✅ How to fix this: Use an all-in-one marketing intelligence platform
The best solution is to upgrade to an all-in-one marketing intelligence platform that allows you to connect to BOTH Google and non-Google platforms natively.
That's exactly what Whatagraph is.
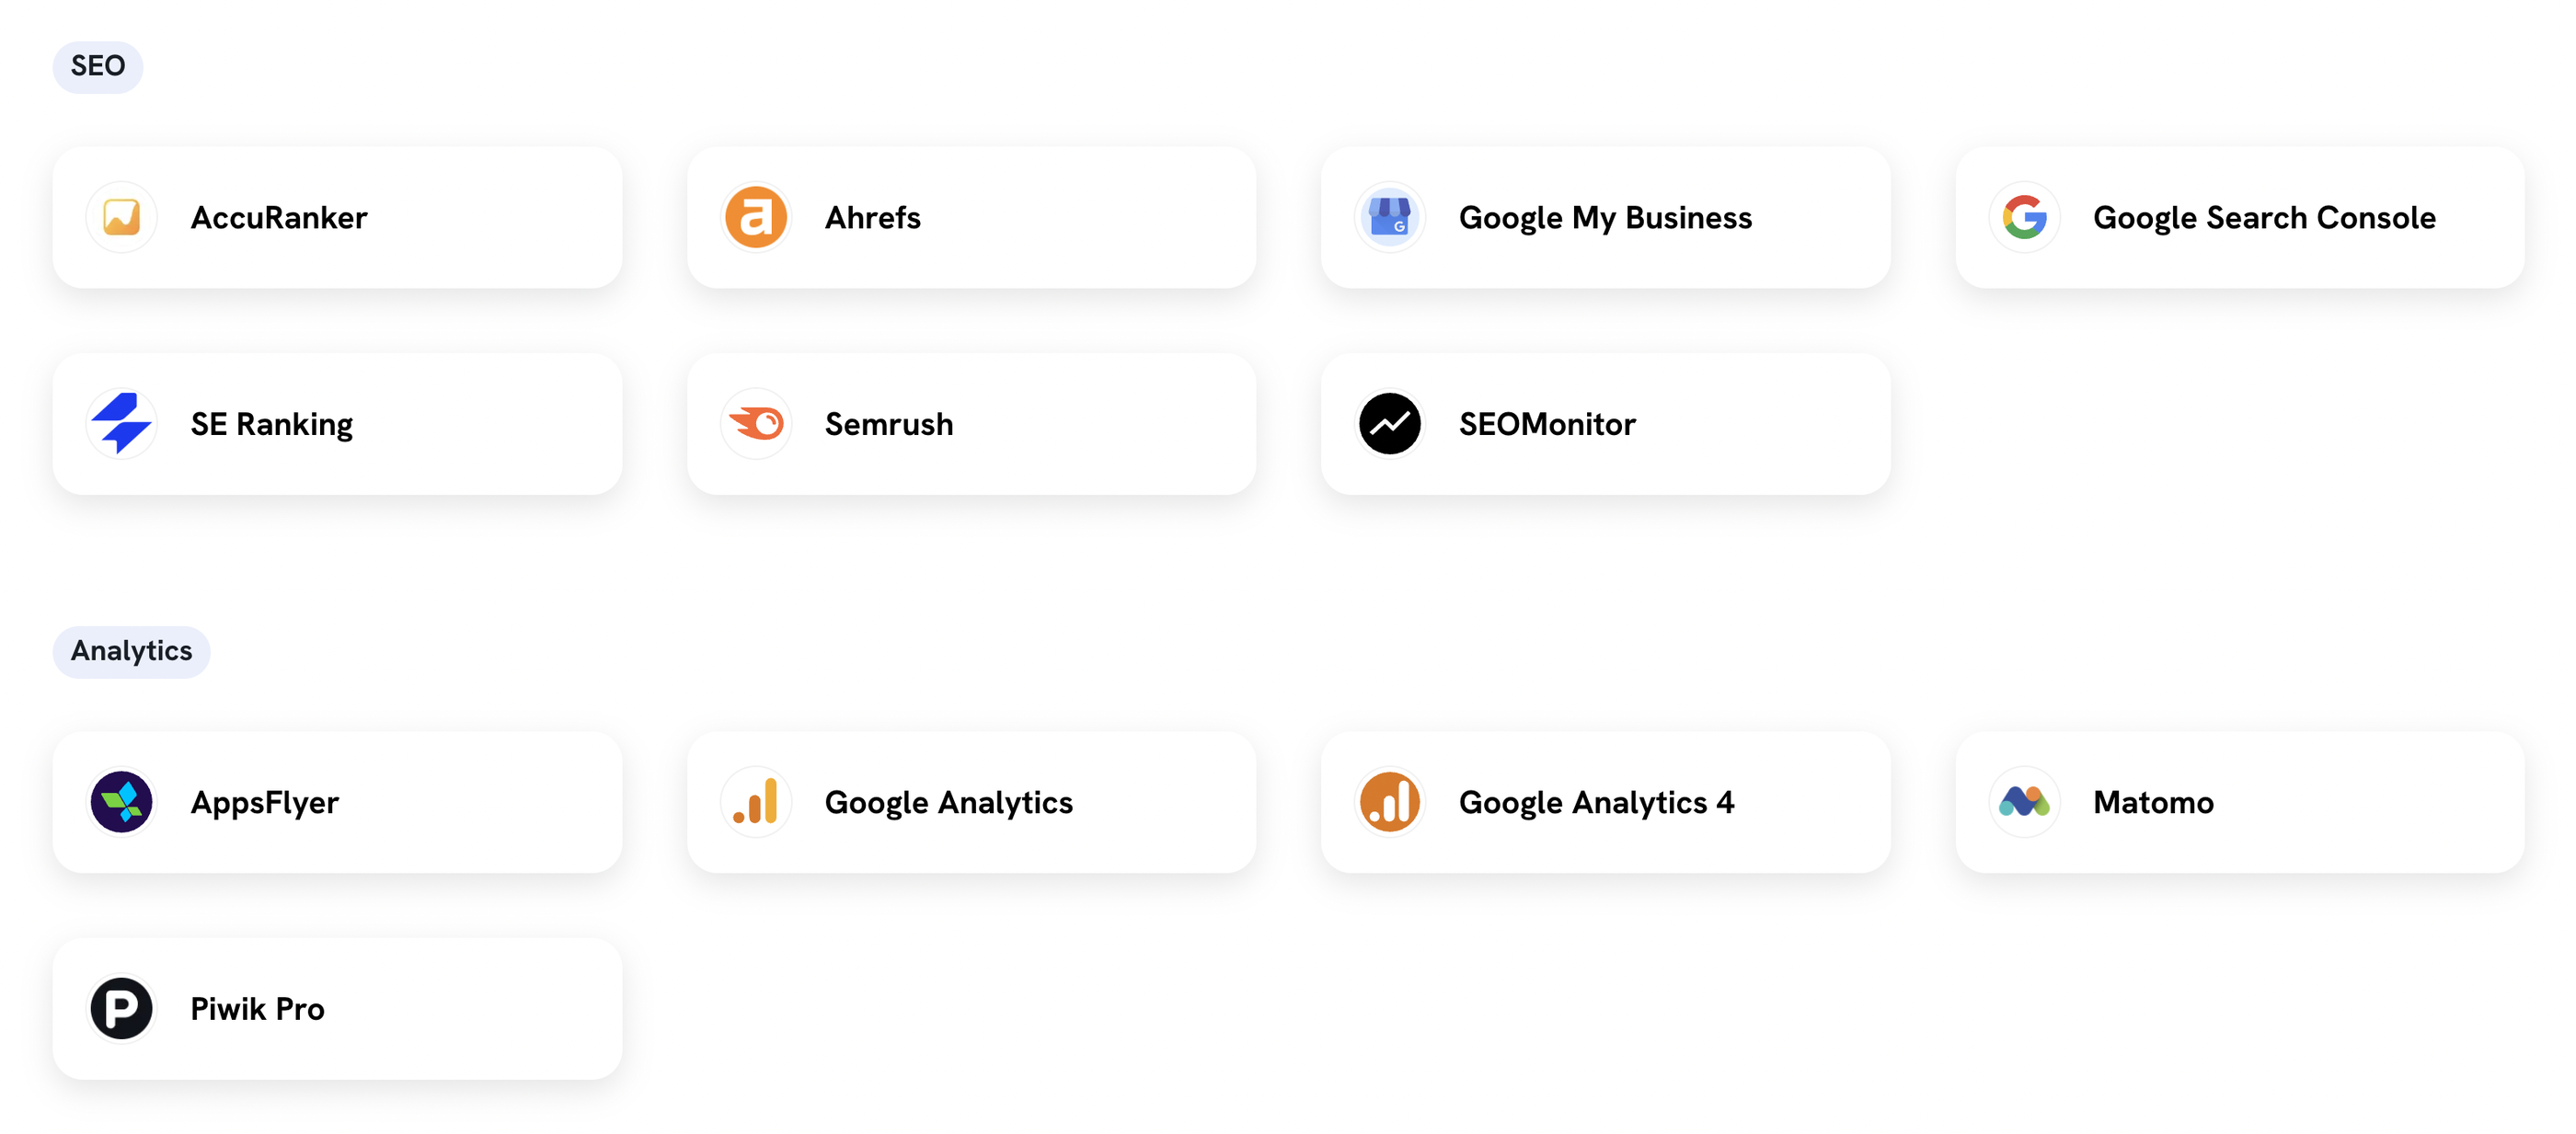
We’ve got 55+ native integrations to popular and niche marketing platforms, including Meta, LinkedIn, Google Ads, GA4, TikTok, Amazon Ads, and more.
That means no more unstable middlemen, broken third party connectors, or having to google “Why is Google data studio slow?”.
Whatagraph’s integrations are also fully-managed, which means our Product engineers regularly maintain them so you don’t have to. And if there are bugs, they can resolve them quickly without having a third-party company involved.
This is what Tanja, Performance Marketing Manager at Achtzehn Grad loves about us. She said:
We don’t have any connection issues on Whatagraph at all. We just connected the platforms once, and that was it.
And once your data is in Whatagraph, you can do everything else in there:
- Transform your data without touching a spreadsheet or BigQuery
- Create data blends from unlimited sources (Looker Studio is limited to 5)
- Build internal dashboards and client-facing reports
- Automate reports to go out to specific people at specific days and times
- Get AI to write out performance summaries in each report, and use the chatbot to extract insights from your campaigns
Soon, you won’t even need to build your own reports. With AI, you’ll be able to:
- Build reports from a prompt
- Edit widgets and troubleshoot issues
- Apply custom themes from images or prompts (e.g. “make the report look like a Batman movie)
But apart from Whatagraph, some other options for all-in-one marketing reporting platforms include:
- AgencyAnalytics - Best for SEO and content marketing agencies
- DashThis - Best for freelancers and small businesses
- Geckoboard - Best for small to medium e-commerce businesses
Reason 6: You're facing platform-wide performance issues.
Most of the time, it’s not you. It’s Looker Studio itself.
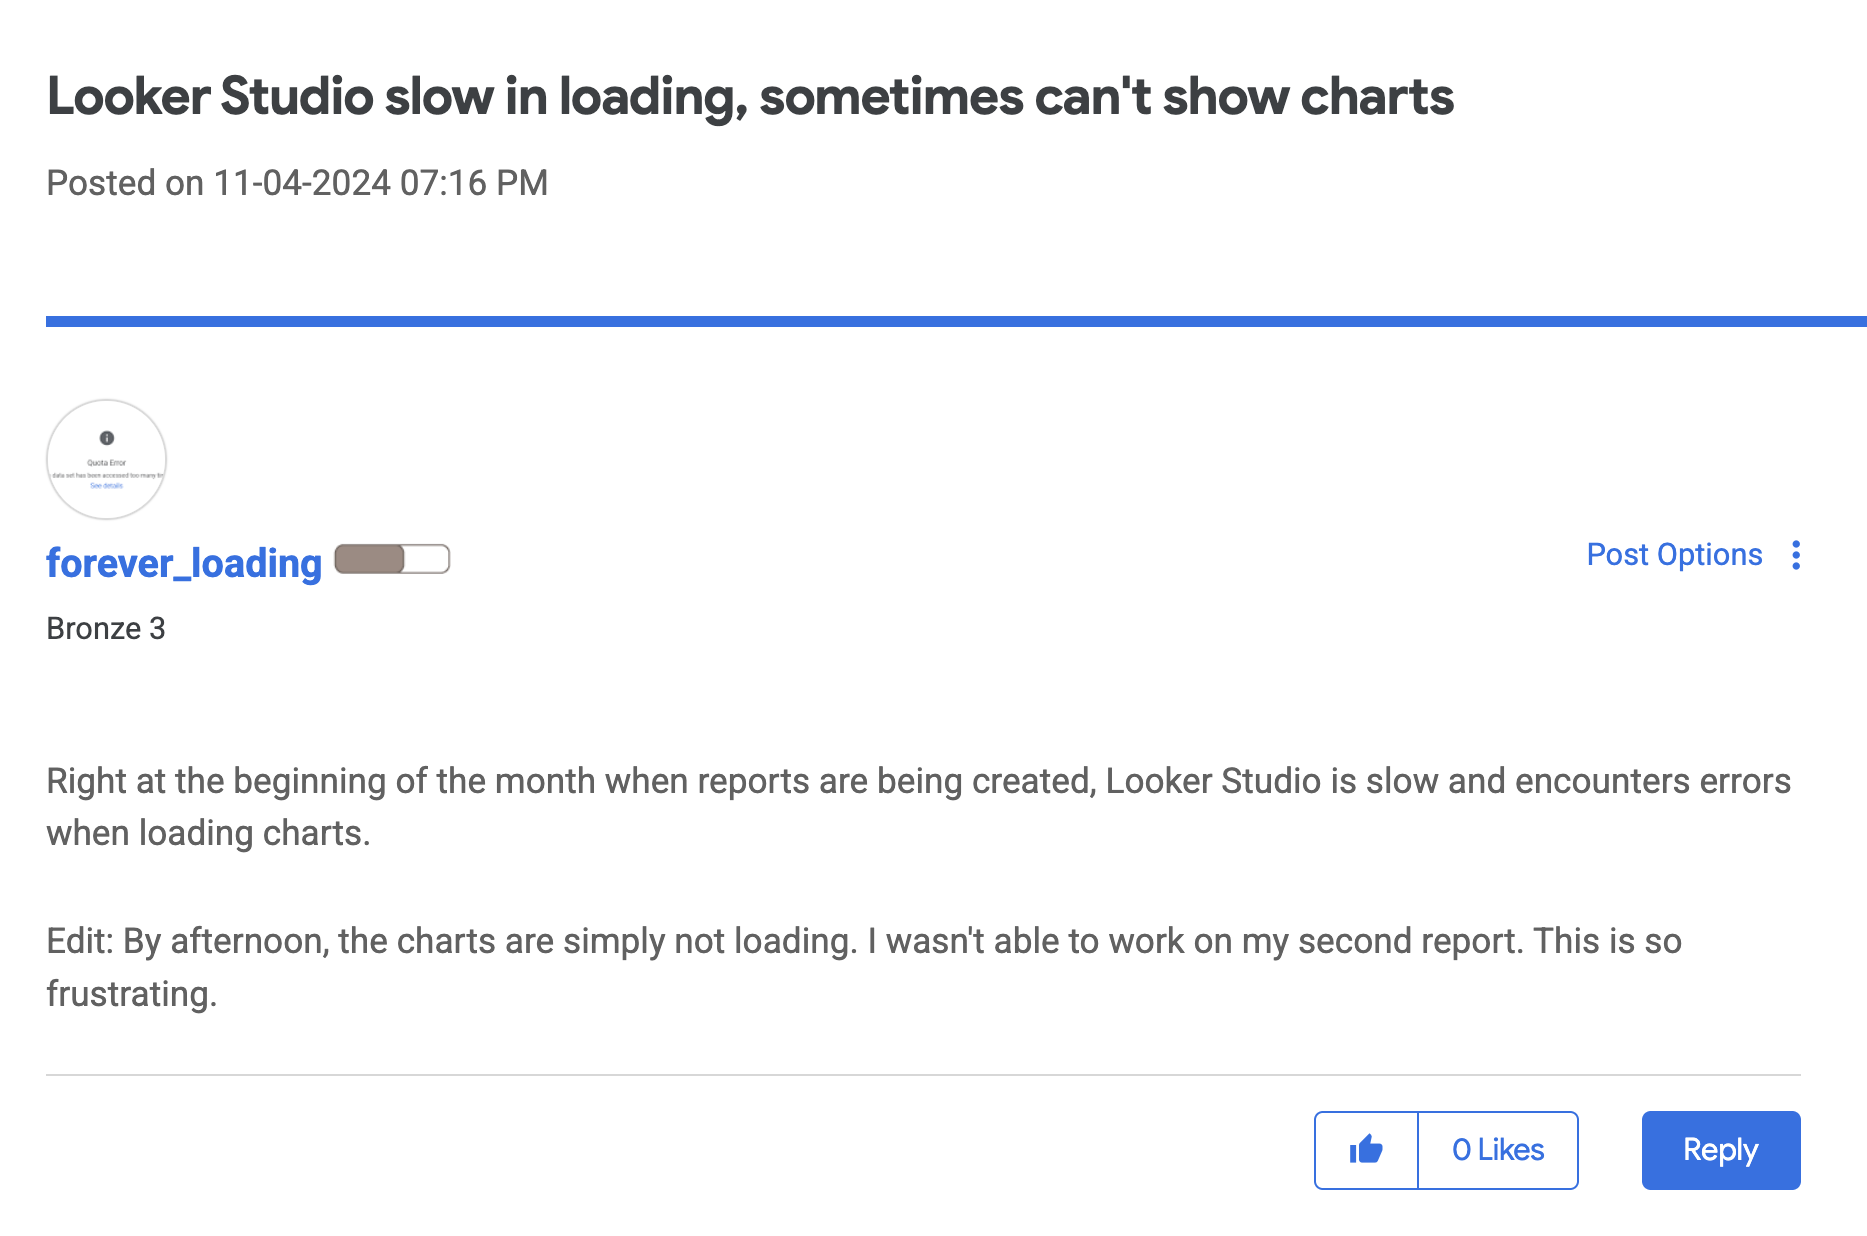
If you scroll through the Looker Studio community forum, you’ll see loads of users complaining about platform-wide slowdowns, timeouts, or system errors, especially at the start of the month or following product updates.
For example, this is what one user posted in the forum:
And even if you voice out your issue in the community forum, there's no guarantee that a Looker Studio representative would see it, or even then you’d still be left to fix it yourself.
You could log and track issues in this Issue Tracker, but even then, it can take weeks or months to get your issues fixed (and there's no guarantee that they will be fixed).
With all these issues combined, it’s not a surprise that many are looking for Looker Studio alternatives that are faster and more reliable, like this user:
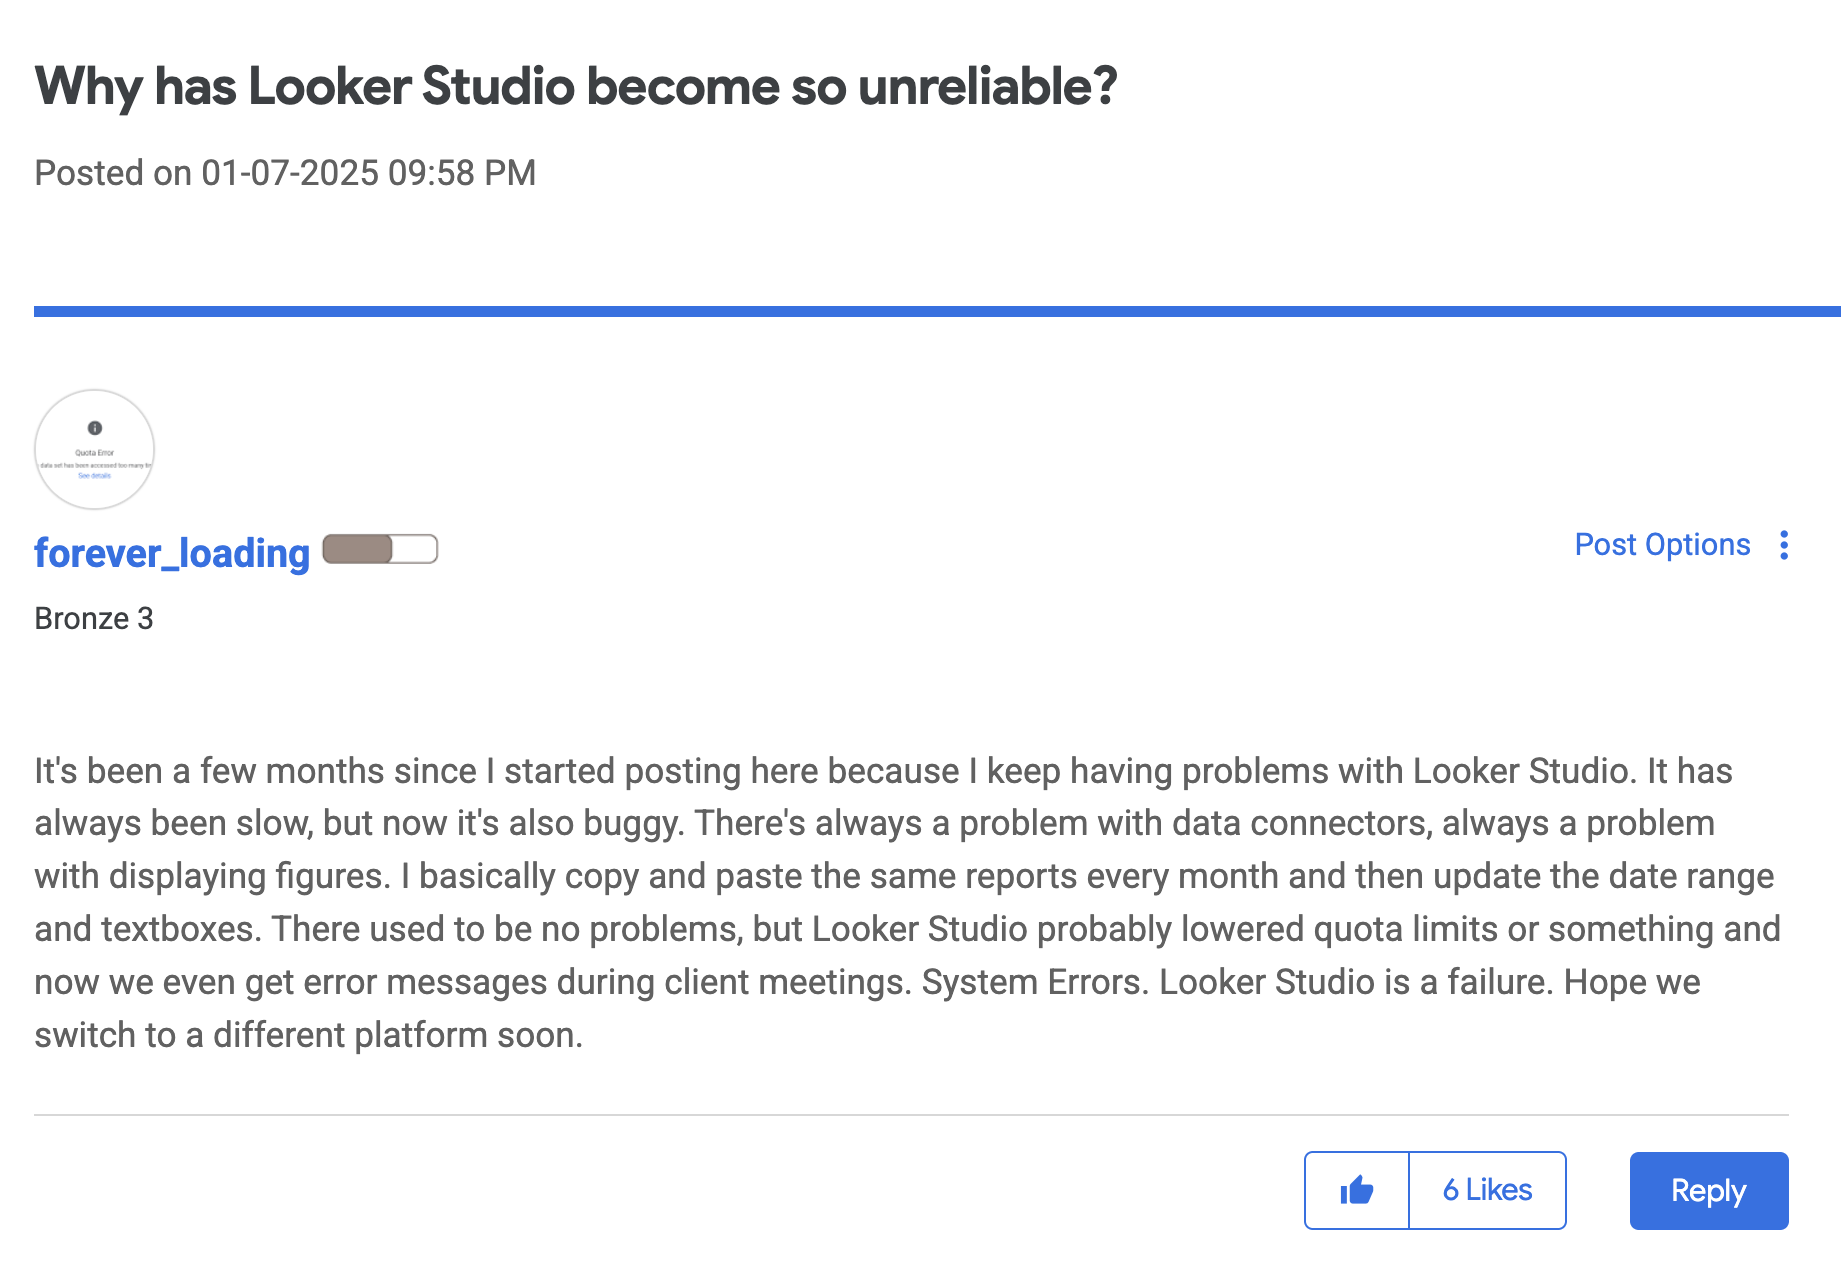
If that's what you're looking for, there's no better choice than Whatagraph. Here's why.
The Easiest Fix: Use Whatagraph for Faster, Smoother Marketing Intelligence
We built Whatagraph to solve the exact problems Looker Studio users face, without the hacks, workarounds, or trade-offs.
Unlike Looker Studio, Whatagraph is all-in-one, fast, and stable. You can:
✅ Connect to 55+ marketing platforms through native, plug-and-go connectors
✅ Transform and clean your data without spreadsheets or BigQuery
✅ Create unlimited data blends, metrics, and dimensions – then reuse them everywhere
✅ Build stunning, accurate, and stable reports and dashboards
✅ Automate reports to go out at specific dates and times
✅ Ask AI to write out performance summaries or extract insights from your marketing data
✅ Set up goals and automatic alerts through email, Slack, or on the dashboard
Plus, you'll get access to your very own Customer Success Manager and 18/5 live chat support that replies within 1 minute and resolves most issues within 4 hours.
And marketers who switched to us from Looker Studio are loving it. Here’s what Kim Strickland, Digital Marketing Specialist at Peak Seven agency said in this case study:
With Looker Studio, everything was muddled, but Whatagraph has opened up transparency and communication. It allowed us to see clearly how our campaigns are performing and took us to the next level with our clients and team.
We hope this guide was helpful in making your Looker Studio report load faster.
But if you’ve had enough of Looker Studio and want some peace of mind, don't hesitate to reach out to our team.
Published on Jun 07 2023
WRITTEN BY
YamonYamon is a Senior Content Marketing Manager at Whatagraph. With an eye for detail and a knack for always considering context, audience, and business goals to guide the narrative, she's on a mission to create genuinely helpful content for marketers. When she’s not working, she’s hiking, meditating, or practicing yoga.