How to Blend Data in Looker Studio [+ a Faster Way]
Data blending is a great way to combine data from multiple sources and gain more insights into your audience, campaigns, and overall marketing performance. In Looker Studio, however, this feature has limitations that could slow down your reporting and affect the accuracy of your data.

Mar 06 2024●7 min read


With data blending in Looker Studio, you can create charts, tables, and rules that combine data from several data sources.
For example, you can blend customer information and order details and visualize the information in a one Looker Studio table.
You can present combined data from your Google Ads and Google Analytics accounts in a single chart to see the unified performance of your marketing campaign.
You can also blend data from different BigQuery tables.
But before we go in more depth, let's quickly explain the difference between a blend and a data source.
Blends vs. Data Sources
Blending data creates a resource known as a blend. Blends are similar to data sources because they also provide data for charts and tables, but they differ from data sources in several ways:
- Blends contain information from multiple data sources.
- Blends in Looker Studio are always embedded into the report in which they're created. You can’t reuse a blend across reports.
- Metrics in the underlying data source become unaggregated numeric dimensions.
- Blends don’t have data freshness and credential settings of their own. These come from the underlying data sources.
How to Blend Data in Looker Studio?
We’ll start by creating a report in which we will connect Google Analytics 4 and YouTube to present data from both platforms in one place.
Then, we’re going to blend data from two different sources in a single chart.
Benjamin Mangold, Co-Founder of Loves Data, explains the process in his video:
Let’s start by creating a report in Looker Studio.
Step 1: Create a report
- Open Looker Studio and click Create > Report.
- Select Google Analytics 4 as a data source. Choose the account and property you want to connect. Click Add > Add to Report.
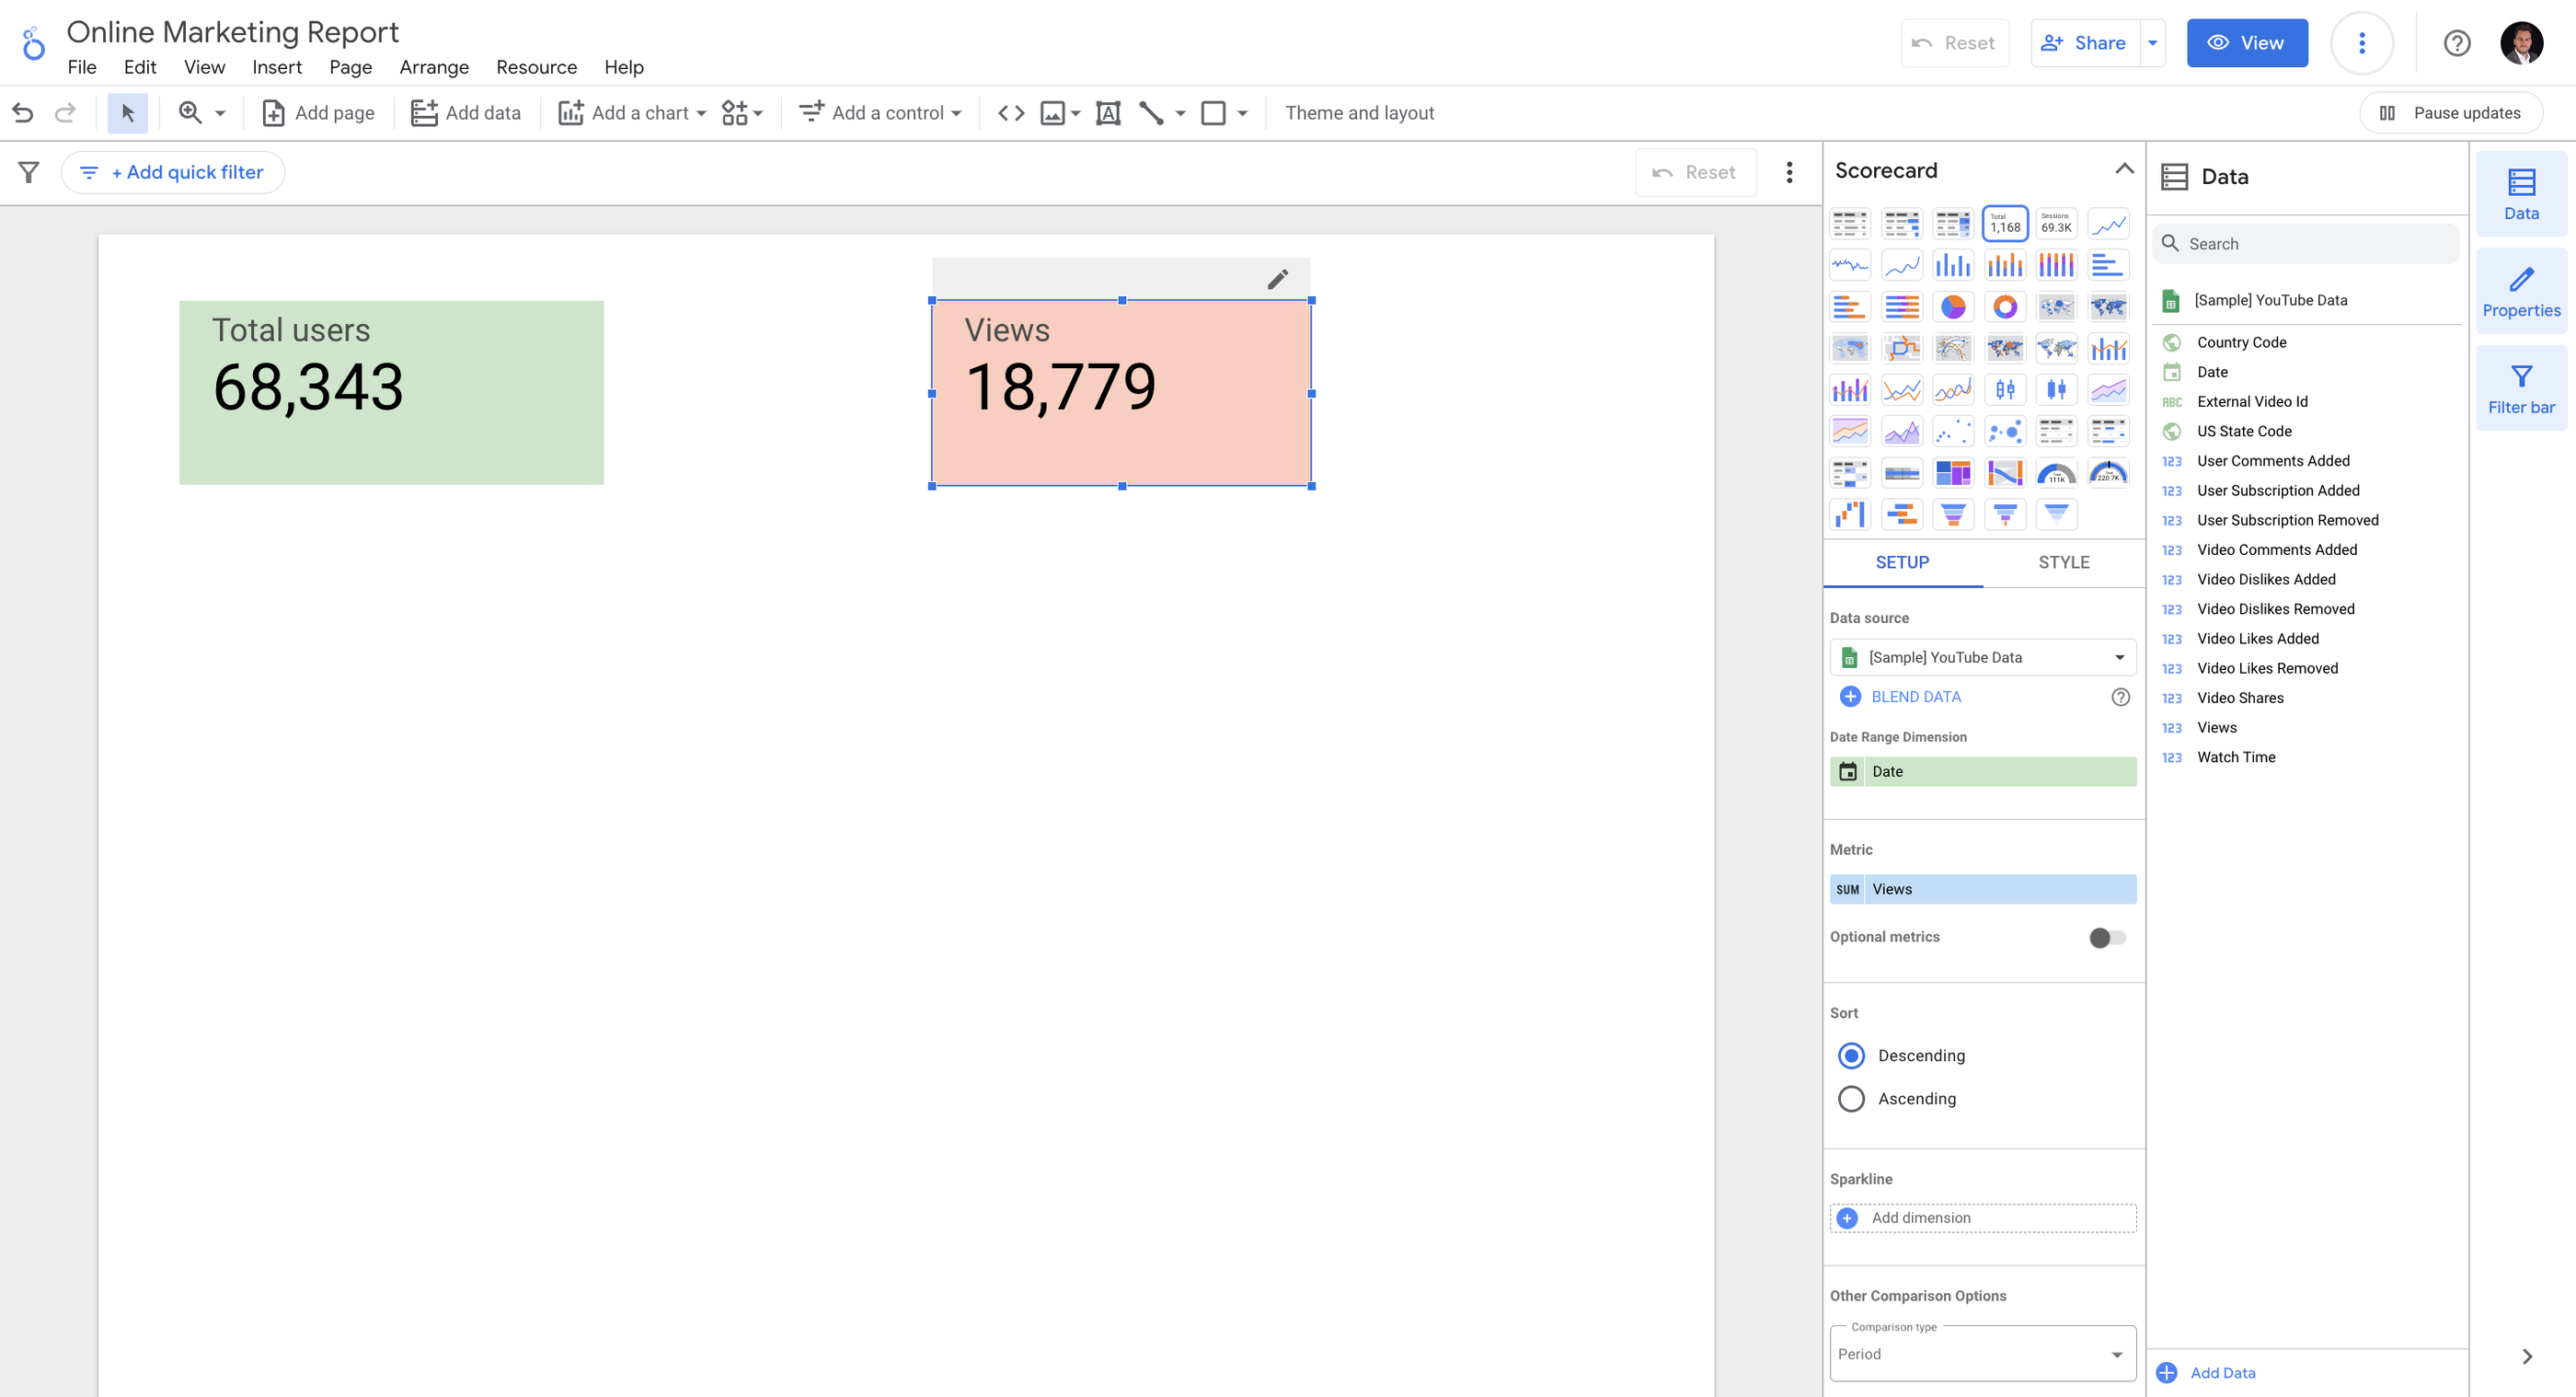
- To keep things simple, we’ll replace the default table widget with a scorecard. Click on the table and click on the scorecard type in the sidebar.
- Change the scorecard metric to “Total users”. Now this scorecard shows us the total number of users on the website.
- To also include data from YouTube, we need to add another data source. Click Add data button at the bottom of the interface. Select the YouTube account you want to connect and repeat the Add > Add to Report steps. We can now use this new data source in our dashboard.
- Click Add a chart and pick a Scorecard from the drop-down menu. Make sure that the YouTube source is selected in the sidebar Data Sources field.
Change the metrics on the scorecard to show the total number of “Views”.
Done! We now have a dashboard that includes data from two data sources.
Now, we'll add another GA4 data source and create a blend
Step 2: Start blending data
Click Add data in the bottom corner and select Google Analytics 4. Choose the account and property you want to connect. Click Add > Add to Report.
We can now add another chart to our report. Click Add a chart and pick a Time series.
Under the Setup tab, we can see that this chart uses the GA4 source we’ve just added.
Click Blend Data to create a new blended data source.
To make a blended data source, you’ll need a “key” also called a “joint condition” that is available in both sources. It’s a piece of information available in both data sets.
For example, we can use the dimension of “Date” to combine data. We can then present the number of users from both data sources by the date.
We can see our existing data source on the left. Click Join another table.
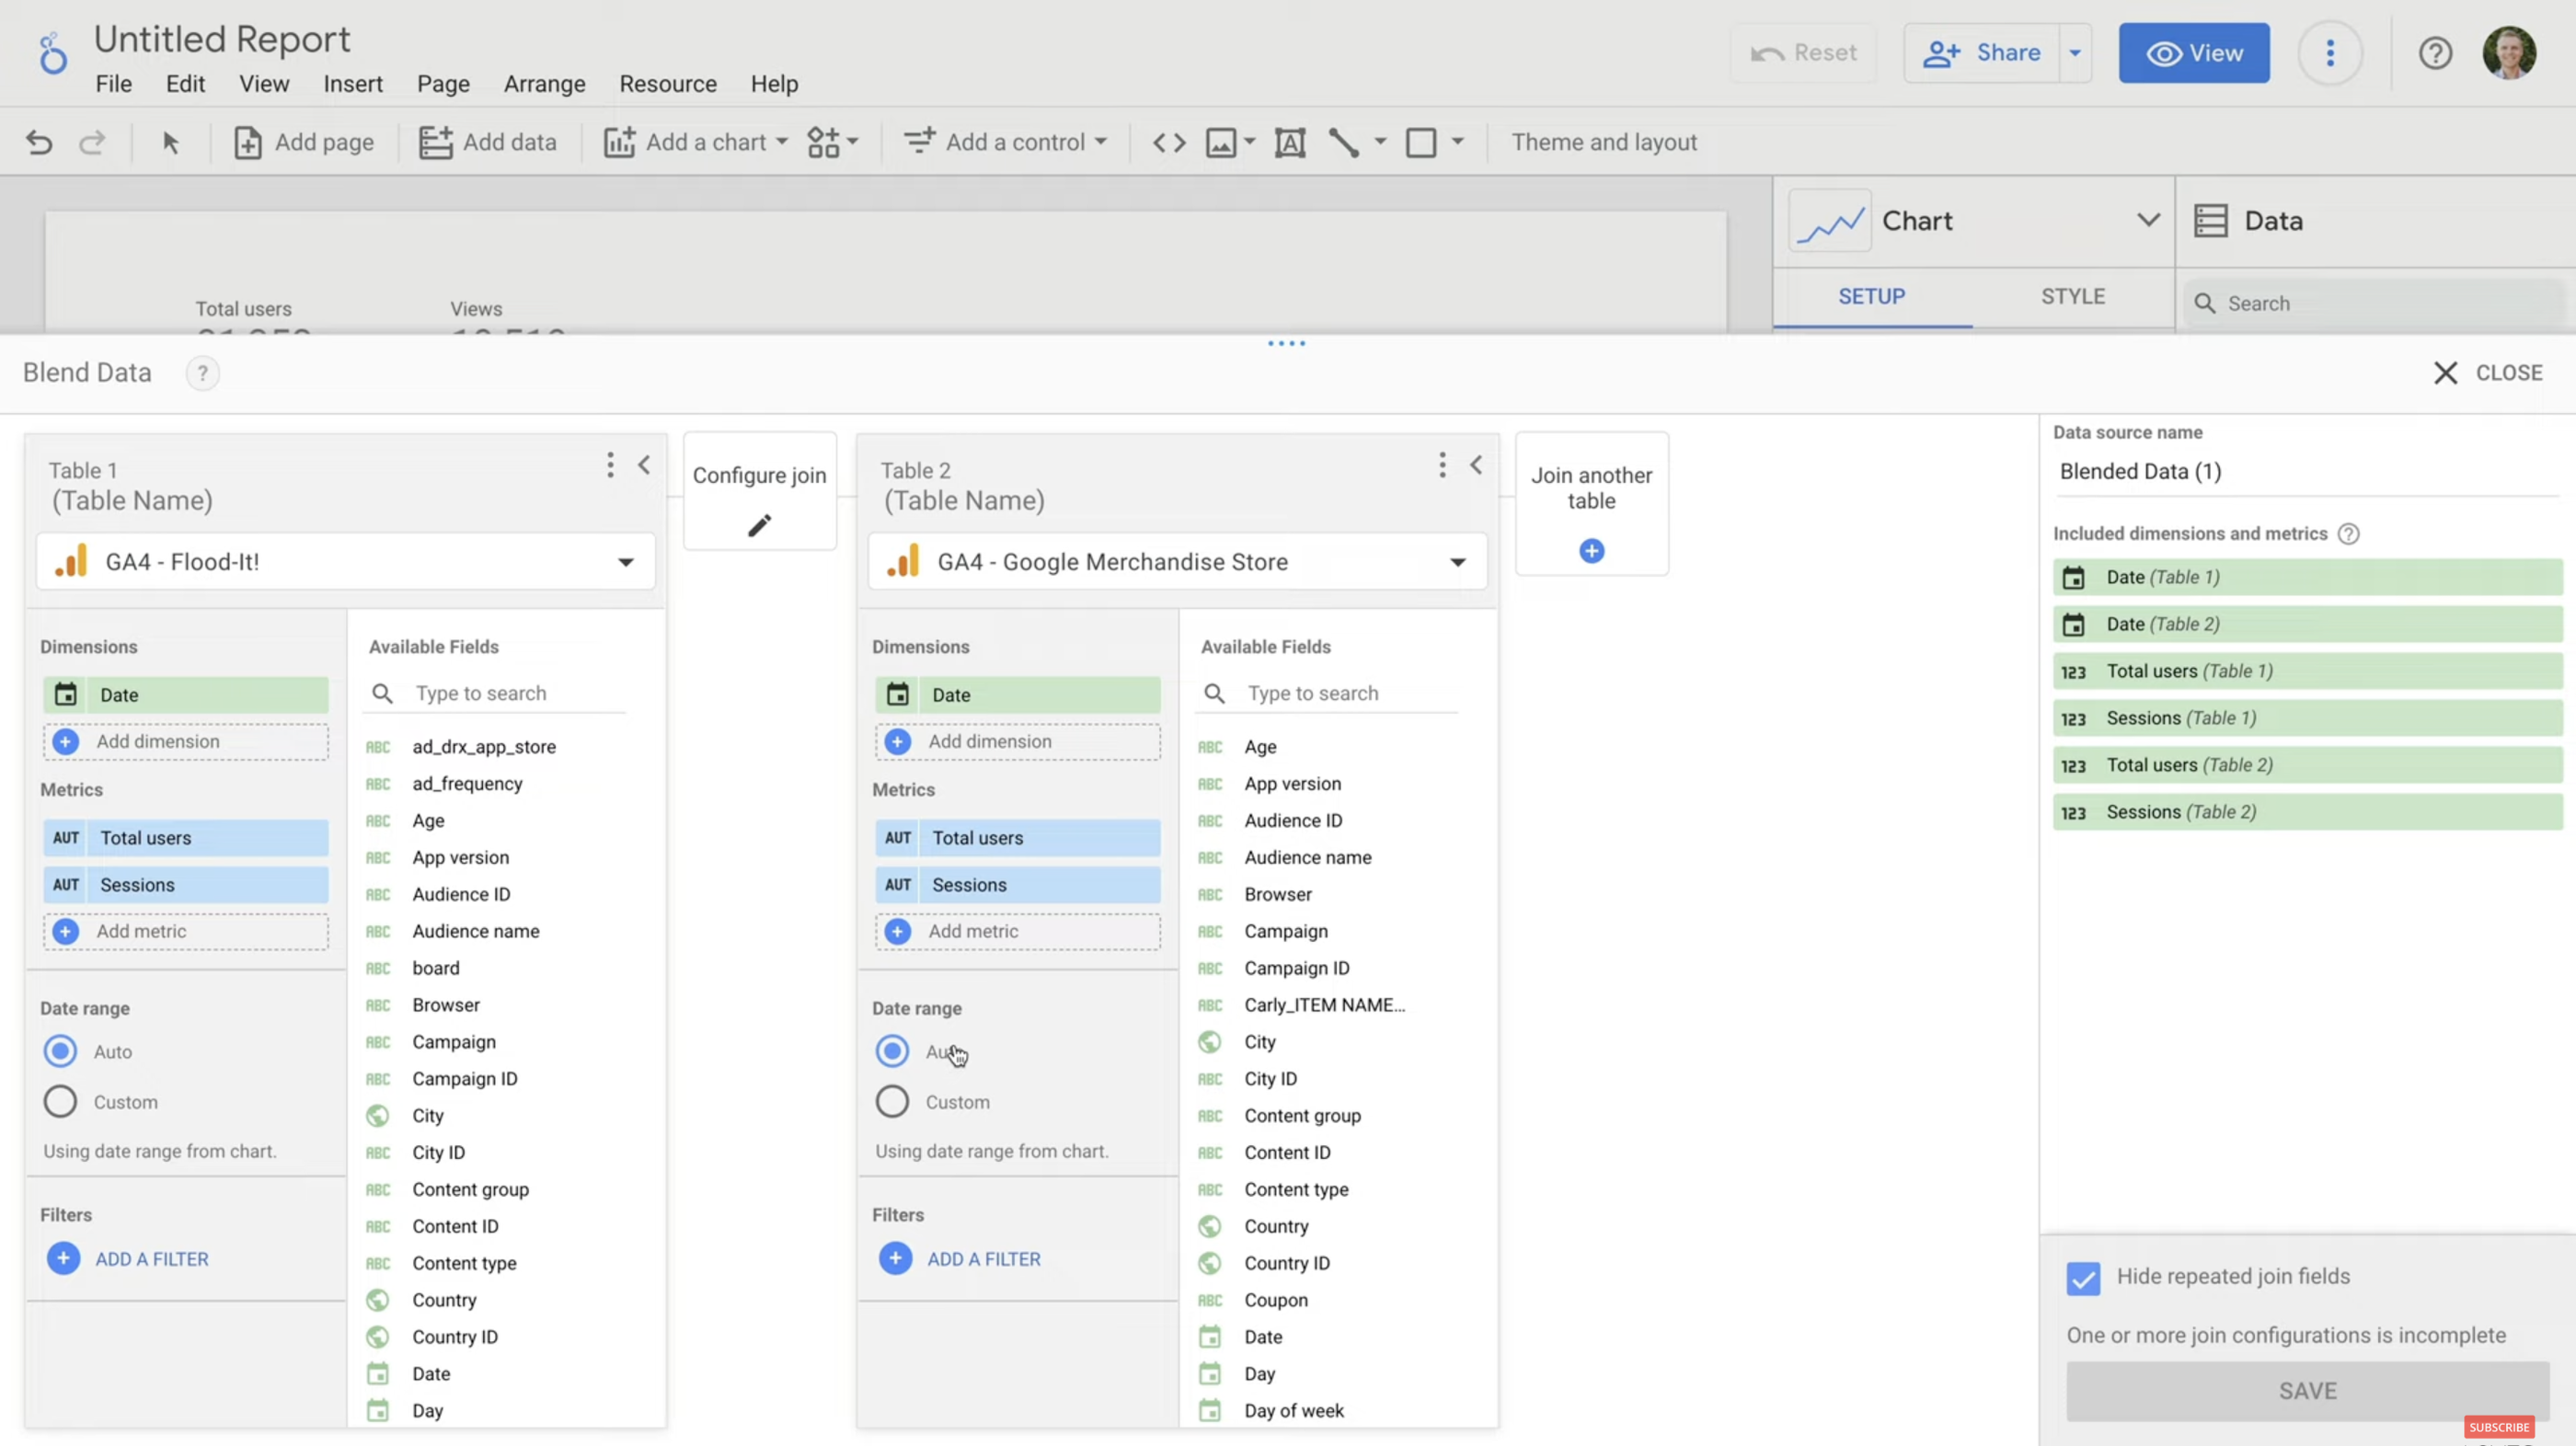
Select the GA4 property you added first. Now, you need to choose the dimensions and metrics you want to combine.
The “Date” is already selected as a dimension. For the metrics, we’ll add “Total users” and “Sessions” for both data sources.
Pro tip: Name each table used in your blended data source. This will help you if you decide to create any calculated fields in your report. Calculated fields let you create custom metrics and dimensions in Looker Studio.
To name a table, select the default text at the top that says “Table Name”.
Every blend in Looker Studio can have up to 5 tables. This is definitely a limitation, but we'll get back to it in a bit.
For now, let's finish our blend.
Step 3: Join data from two sources
You can see the metrics and dimensions for our blended data source on the right, together with corresponding table names.
The next thing you need to decide is how to join data from the tables.
Click Configure join in the middle.
There are five ways you can join tables.
With these options, you can control what happens if data is missing from one of the tables. For example, if there is data for a particular day in one table but not the other.
- Left outer: If you use “Left Outer”, all the rows from the table on the left will be used, along with any of the matching rows from the table on the right. If there is a row missing in the table on the right, it won’t be combined in your blended source.
- Right outer: If you use “Right Outer”, any missing rows from the table on the left won’t be used.
- Inner: Only rows that are available in both tables will be used.
- Full outer: All rows from both tables will be used.
- Cross: This option combines all available rows from both data sources.
For our blended data source, let’s select “Full outer”.
Now, we need to select the Join condition or data key to join the data together. Choose the “Date” dimension. Click Save.
You can now name the blended data source. For example, “GA4 Combined”. Click Save.
Step 4: Combine metrics
We can see our new blended data source is applied to our chart. Each metric is still separate.
We have two metrics for “Sessions” and two metrics for “Total users”.
To create a combined metric, we need to create a calculated field.
Under the Setup tab, select Add metric > Create field.
Let’s call it “Total Users Combined”. For the formula start typing “Total users” and then select the metric from the first table. Enter a “+” sign and search for “Total users” again and select the metric from the second table. Click Apply.
You can now see the total number of users combined from both GA4 properties in the time series.
5 Limitations of Data Blending in Looker Studio
There’s no doubt that data blending is a great feature. Blended data can help you see the bigger picture behind your data and reveal underlying trends. However, there are several Looker Studio limitations that could slow down your report or make blended data in Looker Studio inaccurate.
1. A limited number of blended sources
Remember when we said that one blend can have up to 5 tables? That’s right. You can’t add more than five data sources and more than 10 dimensions from a single data source. Both numbers might seem reasonable, but they're not always enough.
Agencies often need to fetch data from many different client sources using multiple marketing data connectors. For example, ad metrics from several PPC apps, sales data from an e-commerce platform, customer data from the CRM, and different information from several more spreadsheets.
In any case, when you hit the limit, you must split the data into several reports, which makes it harder to get the full picture of your performance.
2. Slow loading and processing times
You might have noticed that the platform sometimes takes more time to load your data, even without blending.
Indeed, Looker Studio is slow for several reasons, and it tends to get even slower when you start using it with multiple data sources, especially several sources at the same time.
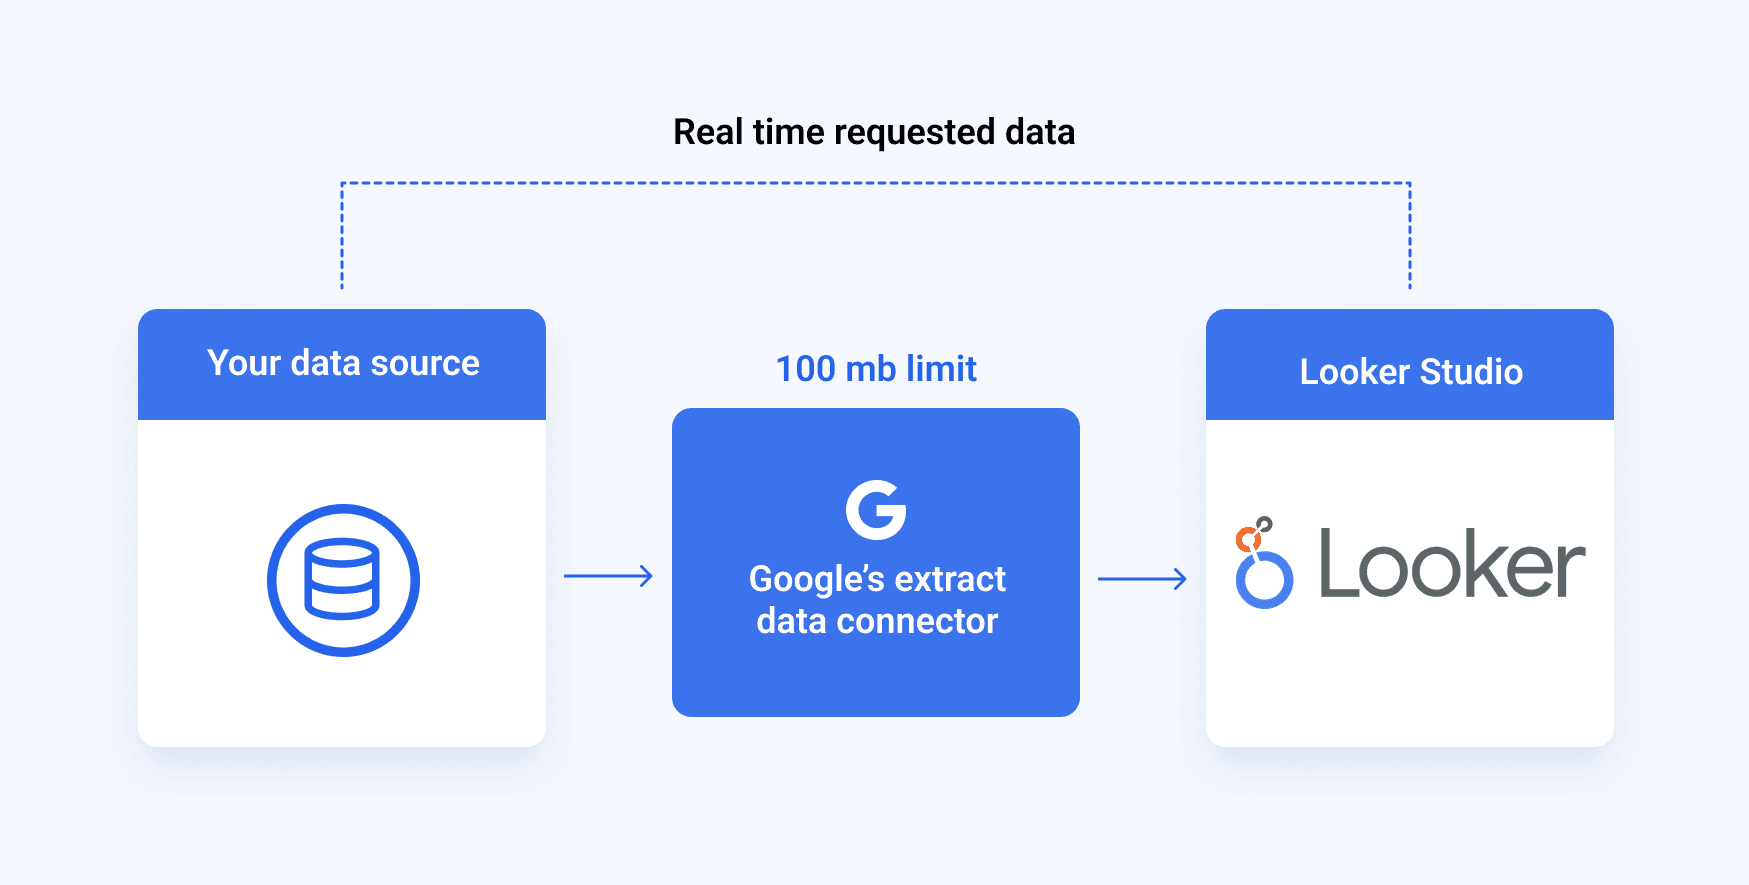
For each source, Looker Studio needs to connect to a different API, which demands additional computing power that isn't always available.
Blending two sources usually works fine, but the more sources you add, the slower your dashboard gets.
3. Blends are not reusable
In Looker Studio, blends are always embedded into the report in which they're created. There’s no way to make a blend reusable across reports. If you copy the report, the blends are copied into the new report, so your charts will continue to present the blended data.
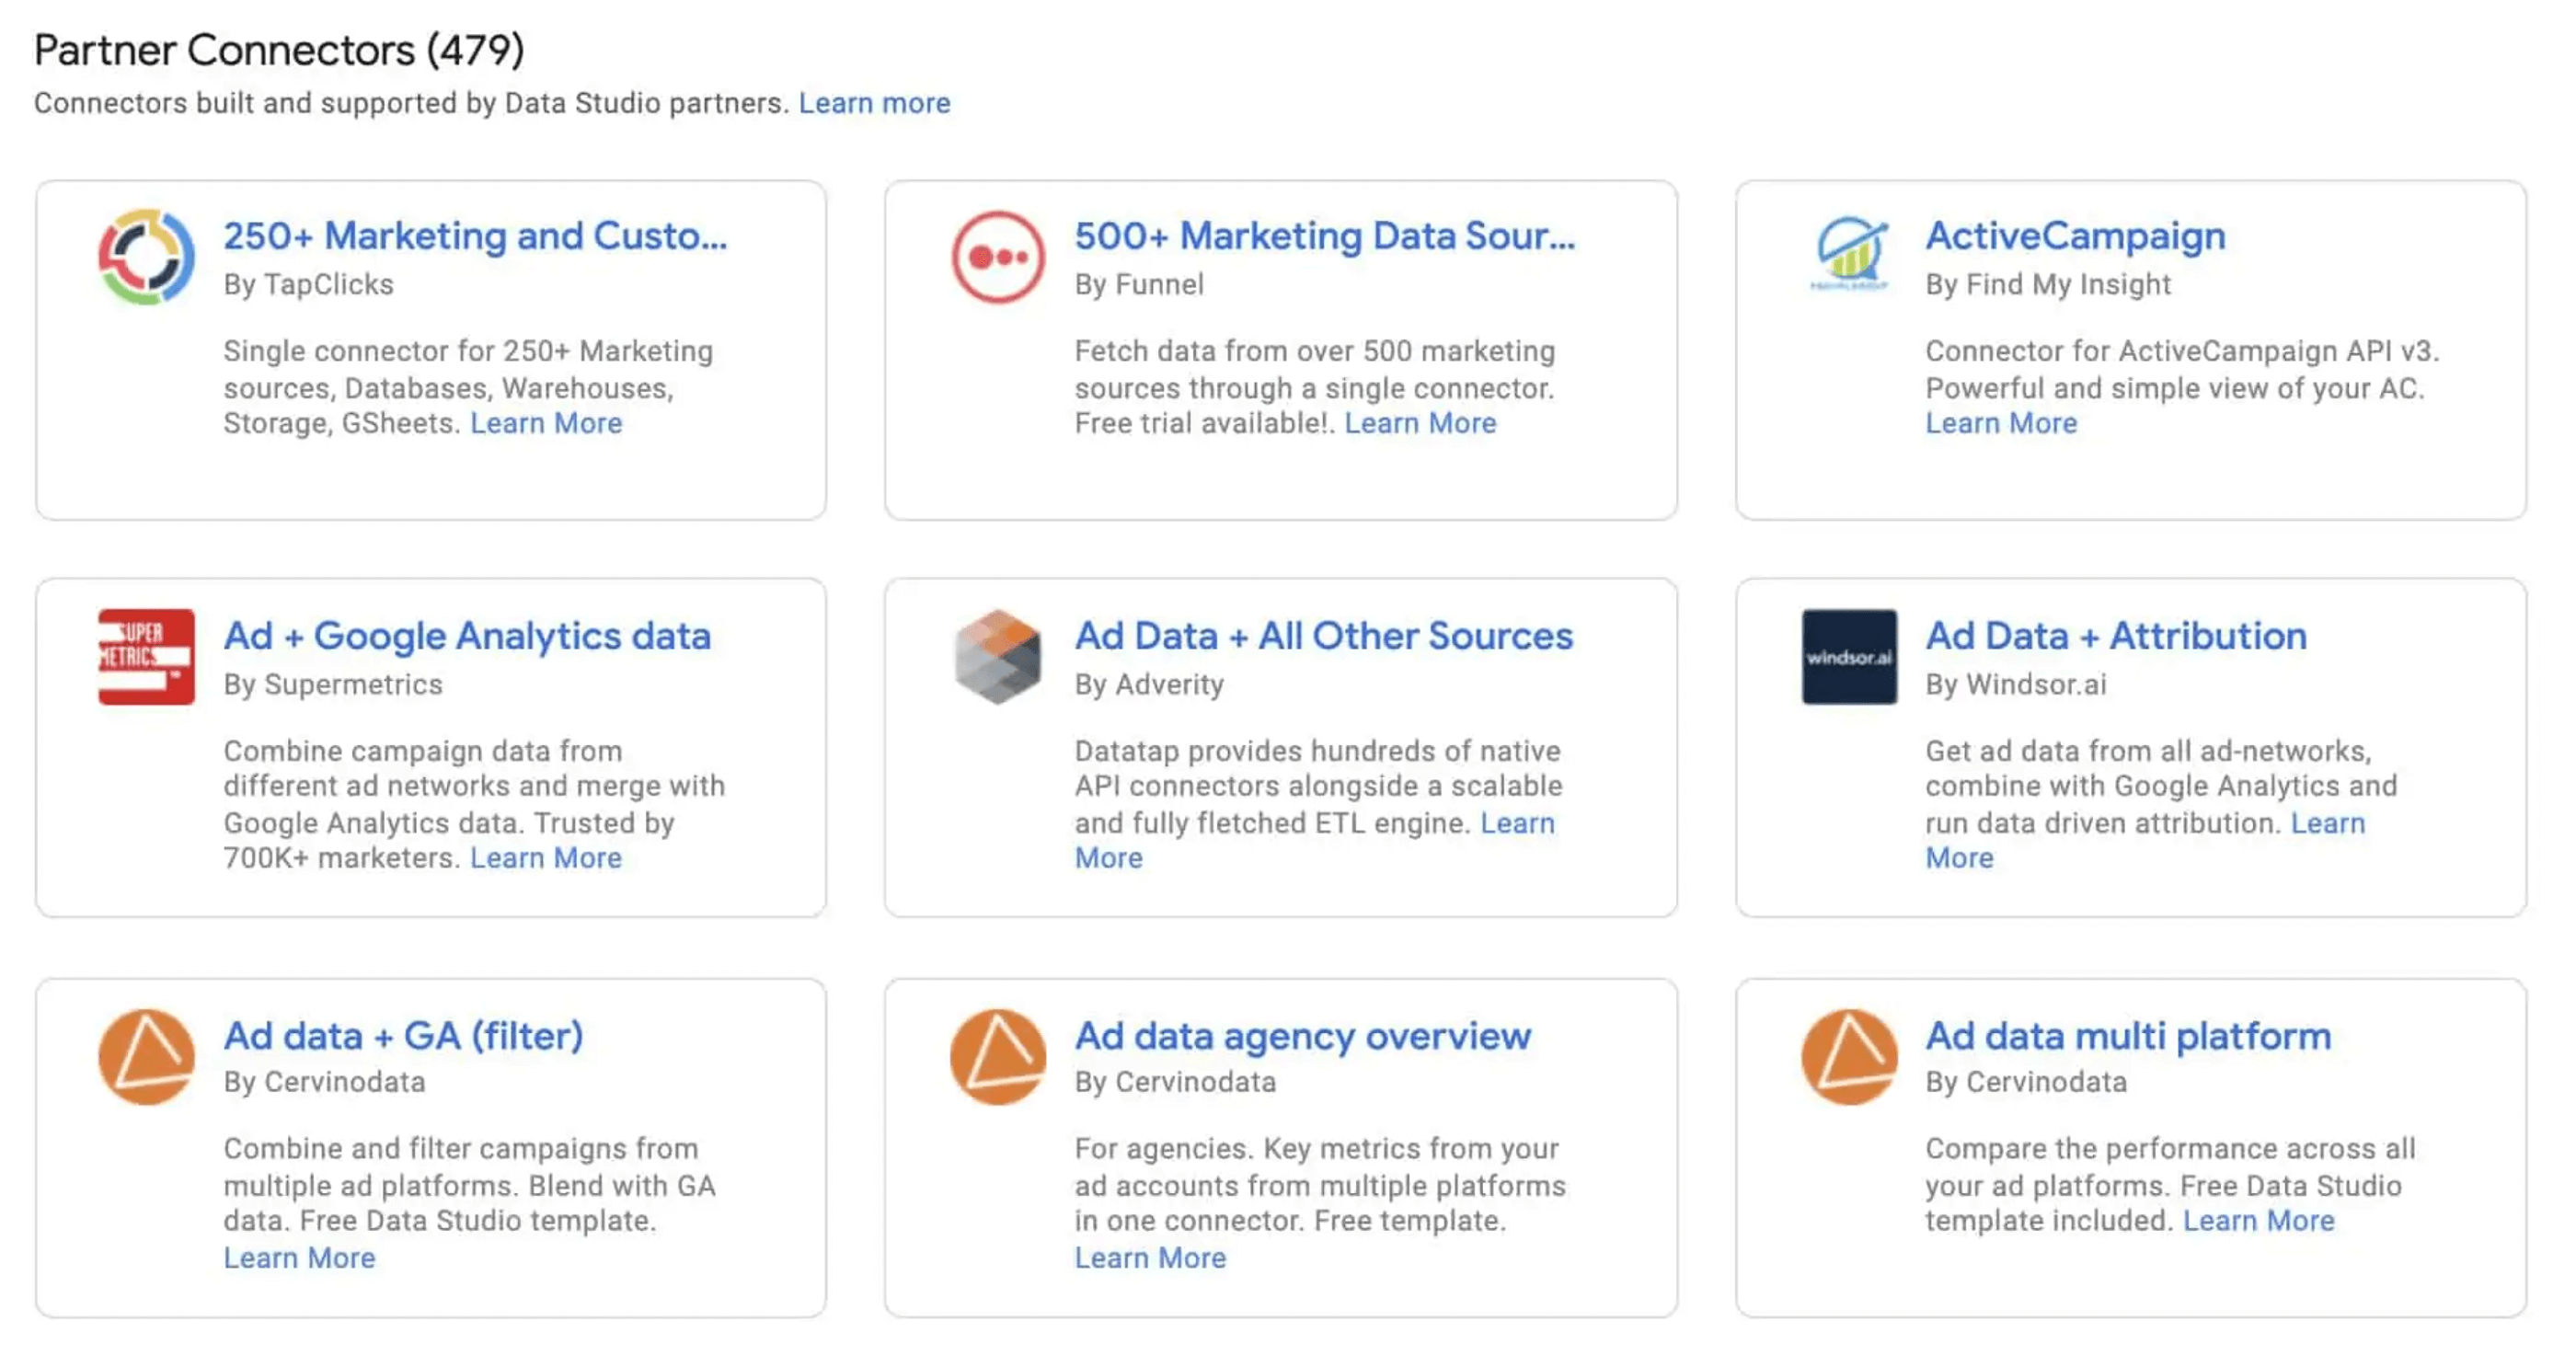
4. Depends on third-party connectors
Third-party connectors are necessary for integrating data from various sources. However, these connectors are sometimes too complex, unreliable, or have limited capabilities.
An old adage says “A man is only as good as his tools”. In the case of Looker Studio, third-party tools can sometimes cause problems.
Google Analytics, Google Ads, and other data sources from the Google ecosystem have one connection per property, which includes all data fields.
On the other hand, third-party connectors often let you choose between three different menus, each connecting to a different segment of the tool’s data. This complicates your data blending processes.
Reporting on an enterprise property or managing an agency portfolio of clients can become a nightmare.
That's especially true if you need to connect or blend all data sources – not to mention trying to replicate the report with blended data.
Connectors from different vendors may not have the same performance
Also, third-party connectors may not be as reliable or consistent as native Looker Studio connectors. This can cause data errors, connectivity issues, or downtimes that disrupt your data analysis and reporting performance.
Ironically, clunky spreadsheets or BigQuery-hosted datasets are often the best way to connect non-Google data sources to Looker Studio.
This dependence on third-party connectors is not something that plagues Looker Studio alone.
Many data transformation tools use third-party connectors to connect data from scattered sources. To avoid this problem, consider using a tool with pre-built or native integrations.
5. Steep learning curve
Looker Studio is not one of those tools you can just pick up and use. Its unique modeling language requires that you have at least a basic understanding of coding — primarily languages like SQL.
This can be challenging for agencies or companies without technical expertise or a dedicated data team.
And if you run into a problem or unknown, you’re pretty much left to yourself, as customer support only applies to users with a Google Cloud support plan and Looker Studio Pro subscription.
How to Overcome Limitations of Data Blending in Looker Studio with Whatagraph
Whatagraph is one platform to connect, organize, visualize, and share all your marketing data.
Designed to replace multiple complex data tools with one intuitive platform, Whatagraph also gives you the easiest way to blend your data.
How?
Once you connect your data sources, you have the option to organize your data before analyzing it further.
No limits on blending data
With Whatagraph, there’s no limit on how many sources or dimensions you can blend. Even better, the accuracy and reliability of your blends don’t depend on third-party connectors.
Whatagraph has fully managed integrations with 55+ marketing platforms, including web analytics, social media, paid advertising, SEO, e-commerce, email marketing, and CRM tools.
This means that data in your blends is reliable, whether you use Google- or non-Google-based marketing apps.
But that’s not all. Apart from these integrations, you can connect any data source via a Custom API or by using Google Sheets or BigQuery as a source.
Faster processing times
While Looker Studio can get very slow even with two data sources in a blend, Whatagraph easily handles dozens of report pages and unlimited widgets and sources.
Thanks to a recent update to Google Kubernetes Engine, even very heavy widgets with 180 configurations now take less than 10 seconds to load.
Easily review your blends to make sure the report is accurate
In Whatagraph, you can quickly review the dimensions and metrics for each blend you’re creating or editing. This way, you can make sure there are no duplicates and that nothing goes into the blend that shouldn’t.
Save any blends to reuse and edit
Everything you create in Whatagraph, from metrics to whole reports, can be saved and reused as a template. This also applies to data blending.
You can easily reuse and edit all data blends, formulas, custom dimensions, and metrics.
Anyone on the team can handle advanced analytics tasks
Whatagraph has a user-friendly UX/UI across the whole platform, making any data management task easy without technical knowledge.
How to Blend Data in Whatagraph
Now, we’ll explain how to blend data effectively using Whatagraph’s no-code process.
Example 1: Blending sources
In this example, we’ll create a simple blend of Facebook Ads and Google Ads to get the number of impressions and clicks from both sources in one table.
Step 1: We start with a report with connected Facebook Ads and Google Ads. Without blended data, the report splits the performance of two sources into two tables. Now, we’ll blend these two sources.
Step 2: Click the Sources tab and then Add new data. Choose the Blended sources tab and click Crete a blended source button.
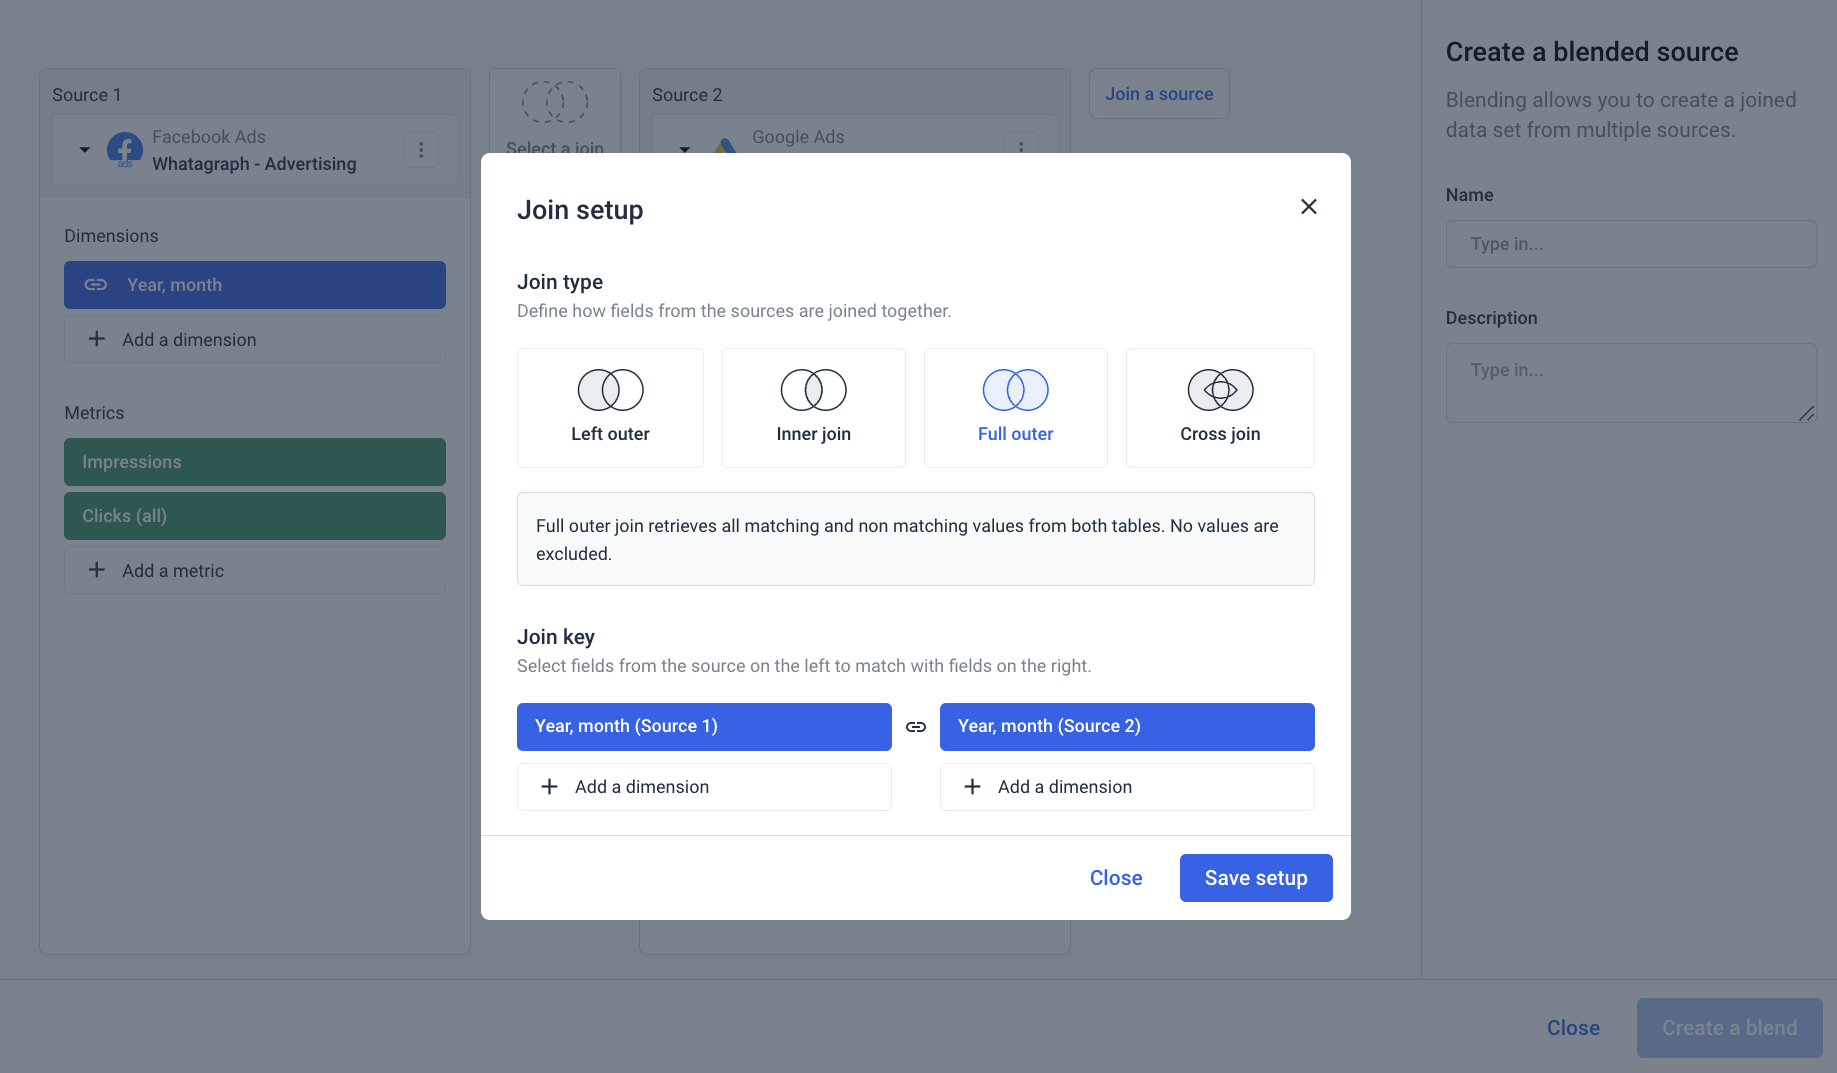
Step 3: A blending window will appear. Start by selecting the channels and the specific data sources. Select Facebook Ads and Google Ads.

Step 4: Choose Year, month as the dimensions for both sources and Impressions and Clicks/Clicks (All) as metrics.
Step 5: Select the join. For this blend, take the full outer join. Select Year, month as the join key for both sources and click Save setup.
Step 6: Give your blend a name and a short description. It’s a good practice to use a recognizable name so other users can easily find it.
Click Create a blend, and your job is done.
You can use the blend you created as a source for any report. Select the newly created blend, drag a widget to the report, and pick the metrics from both sources.
This example is just one of many data blending use cases available in Whatagraph.
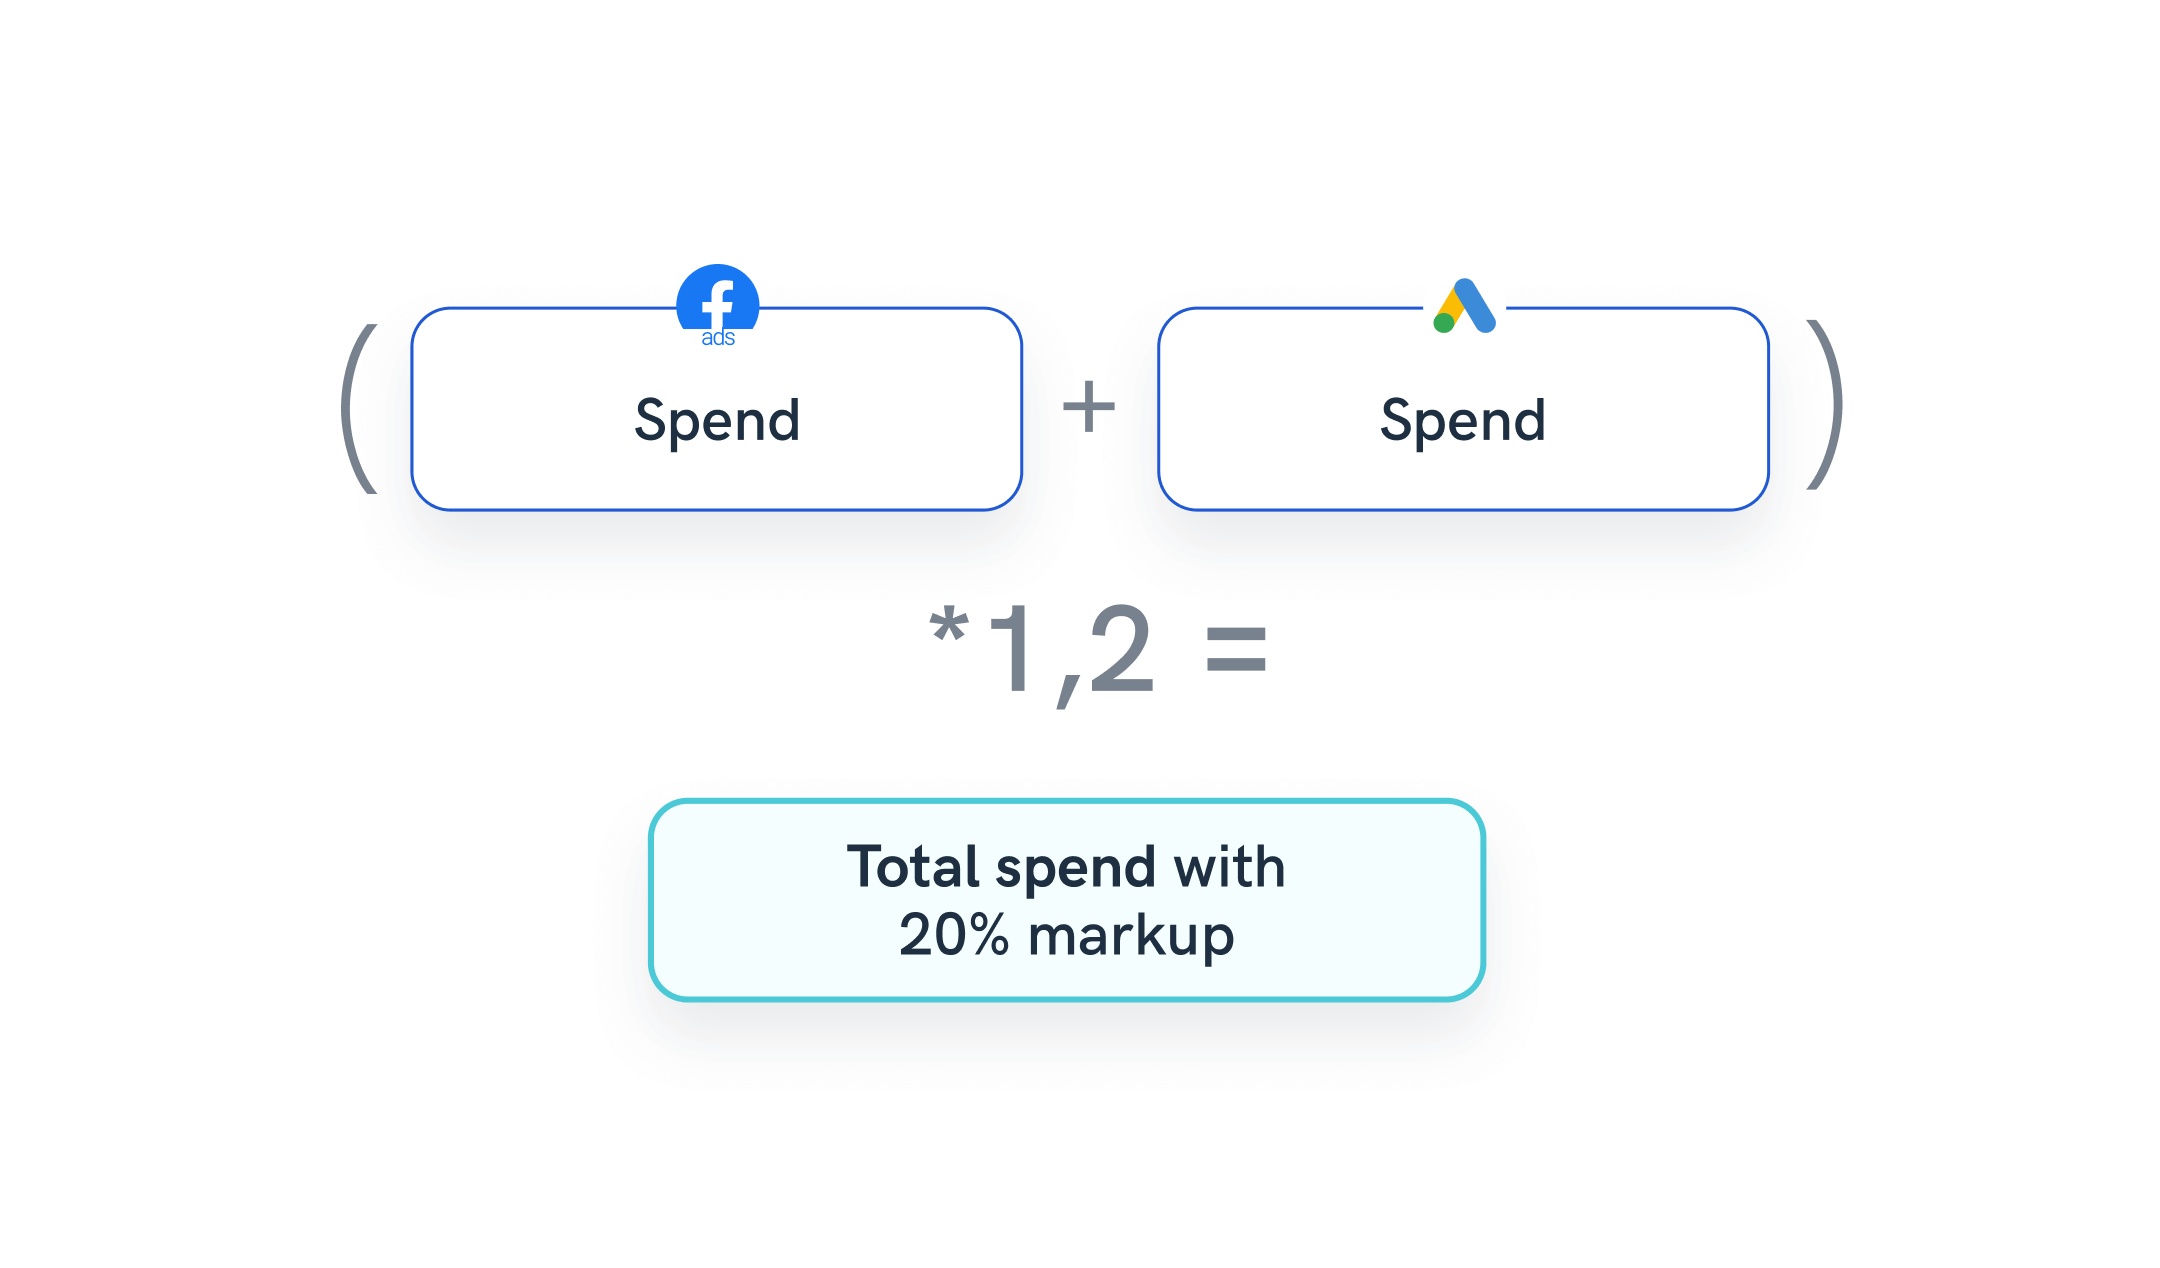
Example 2: Creating formulas on a blended source level
In this example, we’ll create a custom formula for total Impressions from Facebook Ads and Google Ads sources we just blended.
Step 1: Click on the widget with a connected blended source. Click Add new in the metrics selection, and then Create new metric.
Step 2: The Create metric view will open. Set the display name and description for your new metrics e.g. Total Impressions. Since we want to use this new metric in a formula, under the rule type, select Formula.
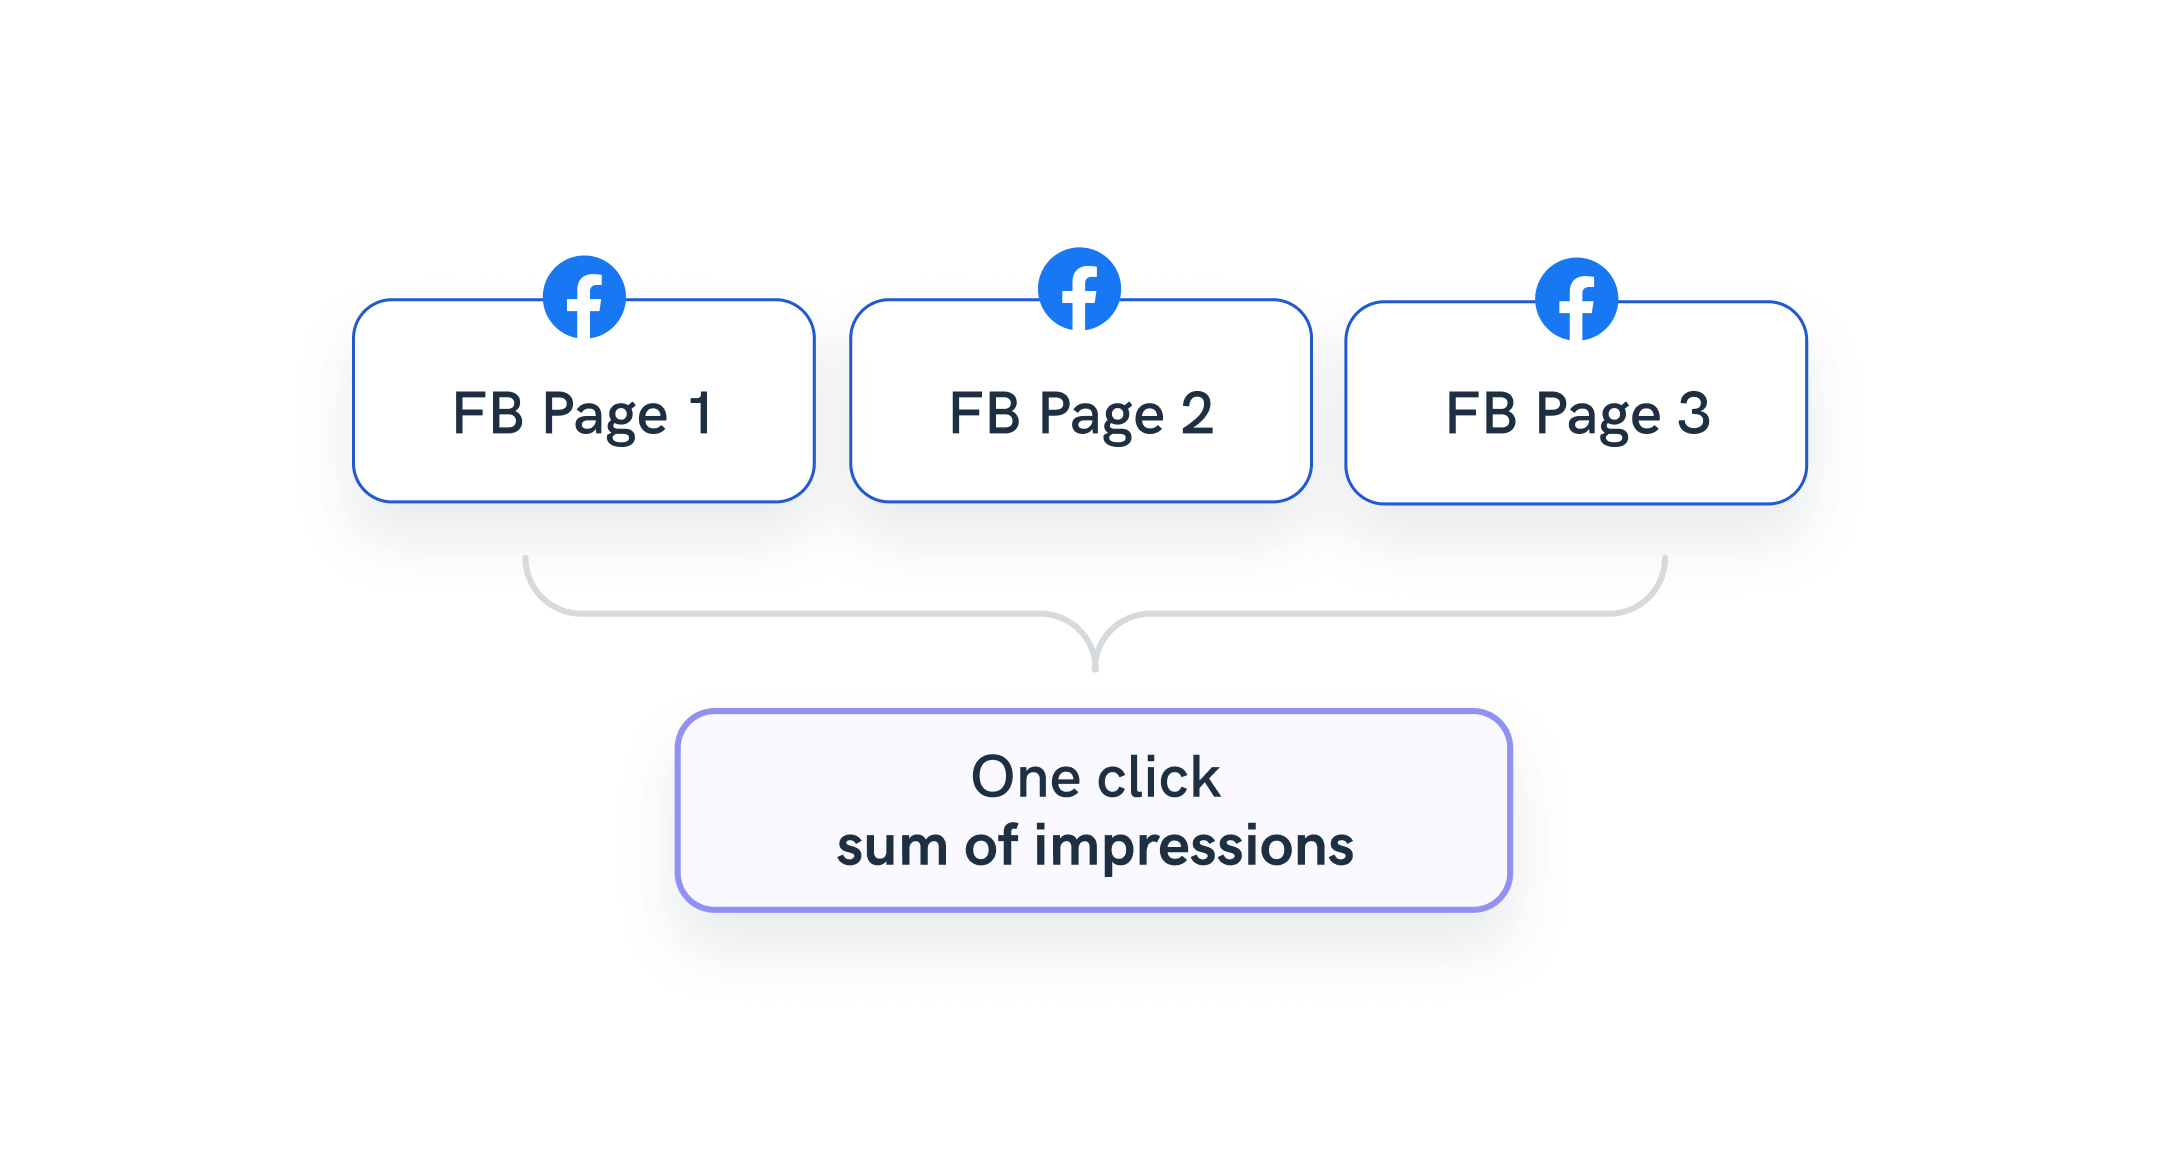
Step 3: It immediately selects the data blend we used in this report. Now, we need to pick the individual metrics from the blend. Let’s say we want total impressions, so we’ll take Impressions from both channels.
Step 4: Type the formula A+B, where A is the designated label for Facebook Ads and B for Google Ads. Click Create metric.
Your new formula will automatically appear under the Metrics selection for the widget.
Update the widget and your custom table now has Impressions from both channels as well as the column for total Impressions.
You’ll find more data transformation use cases and ways to organize your marketing data in our marketing data transformation article.
More Reasons to Pick Whatagraph Over Looker Studio
Looker Studio is a dashboarding tool created as a supplement to Looker – a much more complex platform for data modeling and governance. Although it lets users create visual reports of available data, Looker Studio lacks the advantages of an all-in-one marketing data platform.
Let’s consider a few more reasons to use Whatagraph to manage your marketing data.
Fully managed integrations
Consistent experience and 30-minute refresh rate across all data sources you connect. More than 55 marketing platforms are supported, plus you can connect any data through Google Sheets, BigQuery, or Custom API.
Cross-channel reporting
Add any marketing channel to your report and compare the performance of different channels in a few clicks. Easily blend data and combine metrics from multiple sources. Pick any metrics from the blended sources and use custom formulas to add, divide, multiply, and take parts of it.
Pre-made widgets
Save time visualizing your data with pre-made report building blocks. Drag and drop them to your report page. Resize them as needed, add more metrics, apply filters, and save them as widget templates.
Linked templates
Link reports to one template to edit them all at once by editing the template and saving hours in the process. Change sources, text widgets, images, and company logos through multiple client reports instead of doing it one by one.
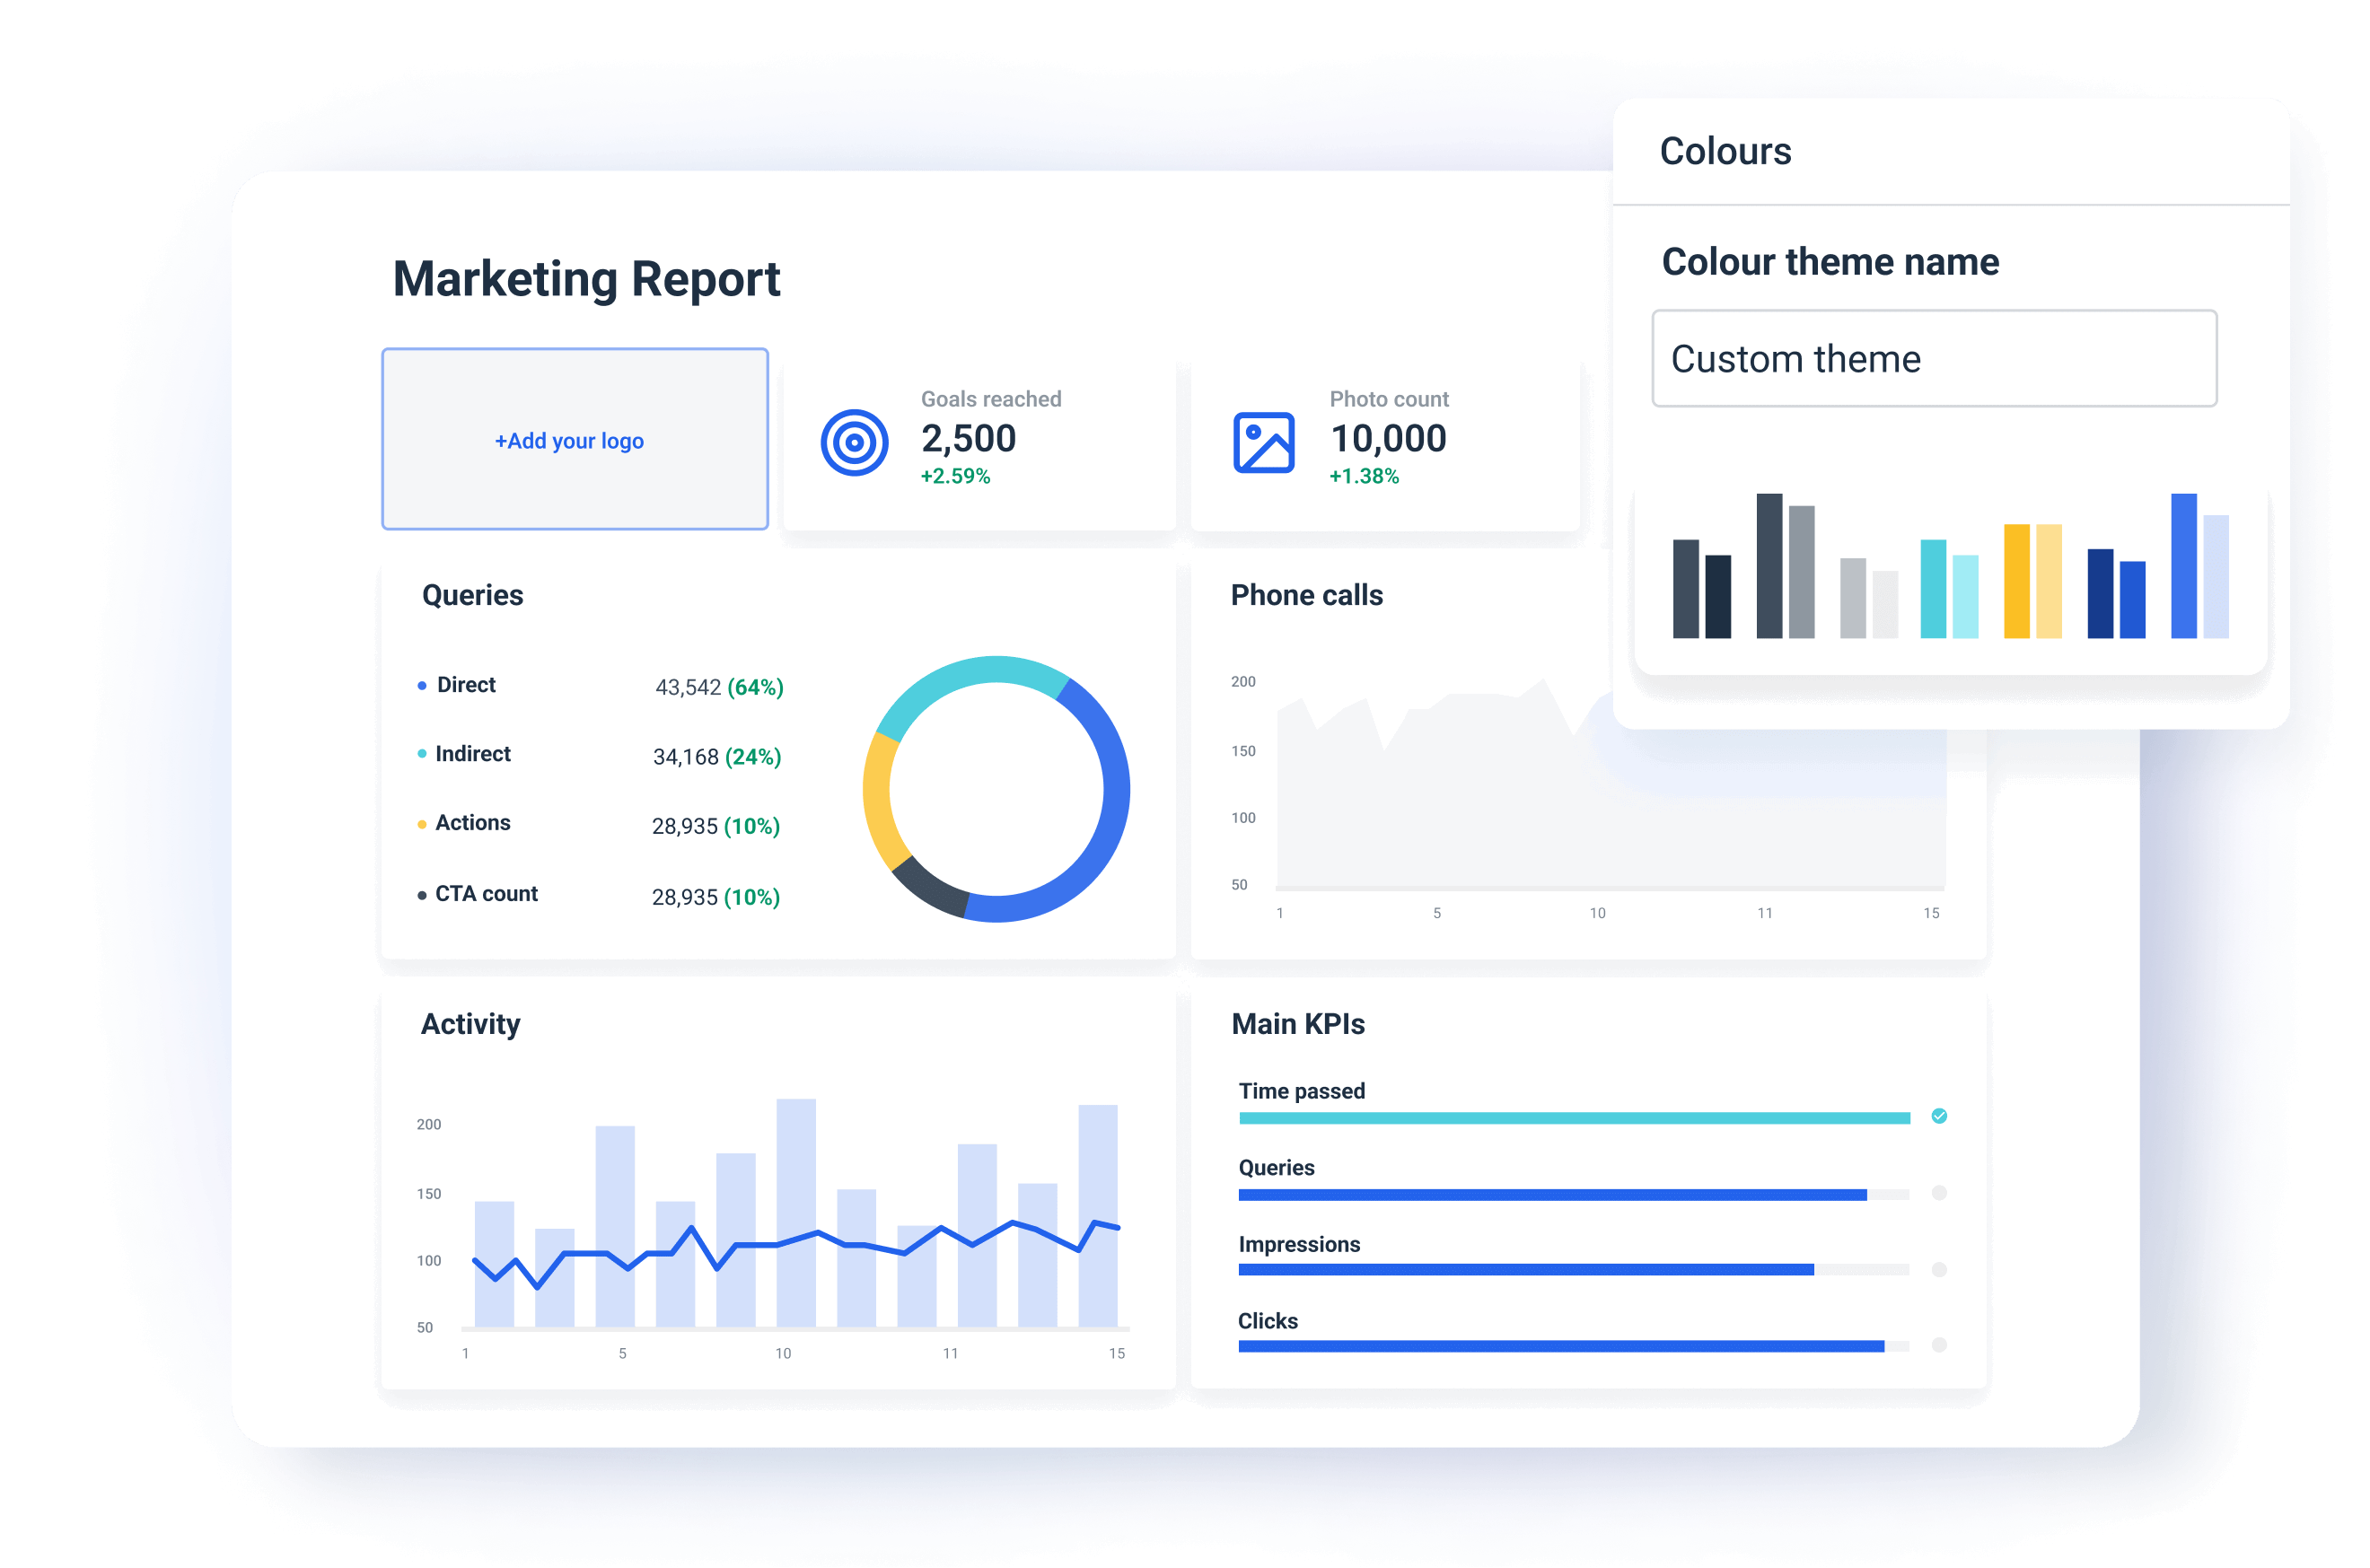
Customization & white-labeling
You can effortlessly change the default design of your reports and dashboard and apply a different theme that matches your or your client’s branding.
- Remove Whatagraph’s logo,
- Choose a color scheme,
- Specify the company name,
- Enter the new domain name,
- Customize the reply-to-address,
- Specify who on your team is responsible for the report.
This effectively means an agency can customize reports for each of their clients.
Report automation & review step
Once you create a report you can automate the way you deliver it. Choose the frequency, delivery days, time zone, and recipients, and automate the whole process.
When the time comes for the next report, Whatagraph automatically refreshes the widgets with new data from connected sources and sends the next report on schedule.
However, you can add the review step to double-check the report content before it gets sent. In this step, you can manually edit numbers, delete or add new widgets, change metrics, change media images, or add text comments.
No code data transfers
Whatagraph has an intuitive, no-code workflow to transfer data from multiple marketing platforms to Google BigQuery data warehouse.
This gives you complete ownership of the marketing data they collect. Instead of having data in different locations, use data transfer to copy it all to a managed data warehouse. This way, you protect your data from deprecation, sampling, or changing policies of individual platforms.
Wrapping up
Addressing common challenges in Looker Studio data blending one by one might take much of your precious time. So perhaps the best way to solve them is to use a marketing data platform that doesn’t have these issues and is much more intuitive to use.
Whatagraph has a data blending feature that is fast, reliable, user-friendly, and 100% no-code.
Book a call with us and find out how Whatagraph can help you organize and report data on a scale!
Published on Mar 06 2024
WRITTEN BY
Nikola GemesNikola is a content marketer at Whatagraph with extensive writing experience in SaaS and tech niches. With a background in content management apps and composable architectures, it's his job to educate readers about the latest developments in the world of marketing data, data warehousing, headless architectures, and federated content platforms.