Supermetrics vs Whatagraph: Which is Right for You?
If you’re frustrated with manual reporting, you're probably considering using Supermetrics or Whatagraph to solve the headache.
Here’s the thing: both of these tools can ease the pain, but the difference is in the nuances of how they do it.

Aug 25 2025●7 min read


- Supermetrics vs Whatagraph: What’s the fundamental difference?
- Feature #1: Data Connectors & Integrations
- Feature #2: Data Visualization and Reporting
- Feature #3: Data Transformation & ETL
- Feature #4: Automation and Scheduling
- Feature #5: Pricing and Value for Money
- Feature #6: Customer Support
- Final Verdict: Supermetrics vs Whatagraph
But fear not, we’re here to break down both tools in this Supermetrics vs Whatagraph comparison piece.
You’ll read:
- Which tool fits your team's technical skill level and workflow
- How their integrations stack up (spoiler: both have solid connector libraries, but stability is a different story)
- Why Supermetrics' "two-tool workflow" creates more problems than it solves
- The real costs beyond the sticker price
- Which solution actually saves you time versus adds complexity
Supermetrics vs Whatagraph: What’s the fundamental difference?
Supermetrics is a data connector—think of it as the "middleman" that pulls your marketing data from platforms like Google Analytics 4, Google Ads, Shopify, etc., and ships this data to third-party tools like Looker Studio, spreadsheets, or data warehouses.
But here's the catch: you can’t create dashboards and reports natively on Supermetrics. You’d need to use a separate business intelligence tool like Tableau or a data visualization tool like Looker Studio. We explained this two-tool setup in detail in this Supermetrics review piece.
On the other hand, Whatagraph is an all-in-one marketing intelligence platform. This means it takes care of your entire reporting stack — from data connections to transformations to visualization to insights extraction.
In a nutshell, here’s what you can do on Whatagraph:
- Bring data from 55+ marketing platforms automatically via native, stable connectors.
- Easily organize your data—create custom blends, metrics, and dimensions using no-code workflows or AI.
- Ask AI to create reports by just telling it what you want it to build. Or use drag-and-drop widgets or ready-made templates to build one from scratch.
- Customize reports in seconds by just uploading a screenshot of your (or your client’s) brandbook or putting in a prompt. Host and share reports on your own domain.
- Analyze your data using granular filters and tags. Spot trends, compare performance, and get actionable insights from your data in seconds.
- Share reports with clients or C-Suite as live links, PDFs, Excel spreadsheets, or automated emails.
- Automatically transfer your data to BigQuery data warehouse or Looker Studio.
Here’s a feature comparison of the two tools:
| Platform | Whatagraph | Supermetrics |
| Core offering | All-in-one marketing intelligence platform | Data connector |
| Ease of Use (Self-Service BI) | Easy – Intuitive drag-and-drop UI. | Hard – requires analytics know-how (no UI). |
| Connectors (Out-of-the-box) | 55+ native (+Fivetran) | 130+ |
| Custom API | Yes – custom API connector & Google Sheets/BigQuery inputs. | Yes – but on Business plan only. |
| Data Blending | Yes – join data from multiple sources easily. | Limited – in-platform guidance on execution is limited. |
| Custom Metrics | Yes – create custom metrics & dimensions code-free. | No – Supermetrics is purely a data pipeline. |
| Custom Reports | Yes – fully custom dashboards & reports. | No – No real reporting; requires an external BI tool for all customization and branding. |
| Campaign Monitoring | Yes – client campaign performance tracked in dashboards. | N/A – not a reporting UI. |
| White-Label | Yes – full white-label (custom domain, logo, themes). | N/A – no white-label (no client UI). |
| Filtering | Yes – filter by client, campaign, etc. | Yes – filter based on any field in your data source |
| Alerts | Yes – daily/weekly alerts via email/slack. | No – only issues with data transfers, etc. |
| Multi-Client | Yes – designed for agencies (manage multiple clients). | Yes – connect multiple accounts from different platforms. |
| User Roles | Yes – Admin, Manager, Editor roles. | Yes – Owner, Admin, and other team roles that dictate access. |
| Auto Sharing | Yes – schedule email or link sharing. | Yes – scheduled refreshes and email notifications. |
| Data Export | PDF, XLS, link, BigQuery/Looker. | Google Sheets, Looker Studio, and data warehouses. |
| AI Insights | Yes – AI chatbot & summaries, report creation, branded themes. | Yes - Query Insights, ChatGPT integration + Agentic AI planned. |
| Support | Live chat & email (<5 min response), 24/5. | Email support & docs. |
| Dedicated CSM | Yes – included on all plans. | Yes – dedicated CSM and premium support on "Business" plan. |
| Security/Compliance | Yes – ISO 27001, GDPR, SSO, encryption. | Yes – GDPR & CCPA, SOC 2 Type II, SSL encryption, 2FA, SSO on higher-tier plans. |
| Pricing | Check out our pricing page for the most up-to-date information. | $$ – entry-level ~$29/mo annual, but you pay for all extras on top. |
| Free trial | Yes - 14 day Free Trial | Yes |
Who is Supermetrics and Whatagraph for?
Generally, Supermetrics is great if:
✔️ You’re a small business or agency.
✔️ You just want to move data from Google sheets to a free visualization platform like Looker Studio.
✔️ You only have one or two channels and sources.
In this case, Supermetrics is going to be the most cost-effective option for you since the Google sheets integration starts at $29/month, and Looker Studio is free for Google-based platforms.
✔️ You have the time and resources to manage two different tools (Supermetrics + Looker Studio).
✔️ You have the patience for Supermetrics connector bugs and slow load times on Looker Studio.
✔️ You have some previous knowledge around how to build dashboards on Looker Studio—or you’re comfortable hiring an external agency or learning how to build dashboards yourself.
Whereas, Whatagraph is great if:
✔️ You’re a performance marketer or digital marketing specialist at a medium to large marketing agency or business.
✔️ You just want to be a marketer and focus on creative and strategic tasks that move the needle for your clients or brand.
✔️ You want an all-in-one reporting platform that takes care of the entire data journey—from connections to transformations to visualizations and insight extraction.
✔️ You don’t want to have to “babysit” data connections or learn to use so many different tools.
✔️ You want accurate and fully-branded reports in seconds without having to deal with codes or technical setups.
For instance, with Whatagraph IQ, you can just tell us what you want and our AI will:
- Build fully-fleshed out reports for you
- Create and edit individual widgets inside each report
- Style the reports according to your brandbook or prompt
- Write out performance summaries in 18 different languages and four formats based on your actual data—inside of your report
- Give succinct answers to any questions you have about your marketing data
This means you don’t need to pretend to be a data scientist—you can just let Whatagraph do the heavy-lifting for you while you focus on what you do best.
Feature #1: Data Connectors & Integrations
When it comes to raw numbers, both platforms offer impressive connector libraries, but the experience of using them couldn't be more different.
Integration Coverage
Supermetrics boasts 130+ connectors spanning nine categories: paid advertising (Google Ads, Meta Ads, LinkedIn Ads), social media, SEO tools, email marketing, ecommerce platforms, CRMs, analytics tools, and more niche platforms like Criteo and StackAdapt.
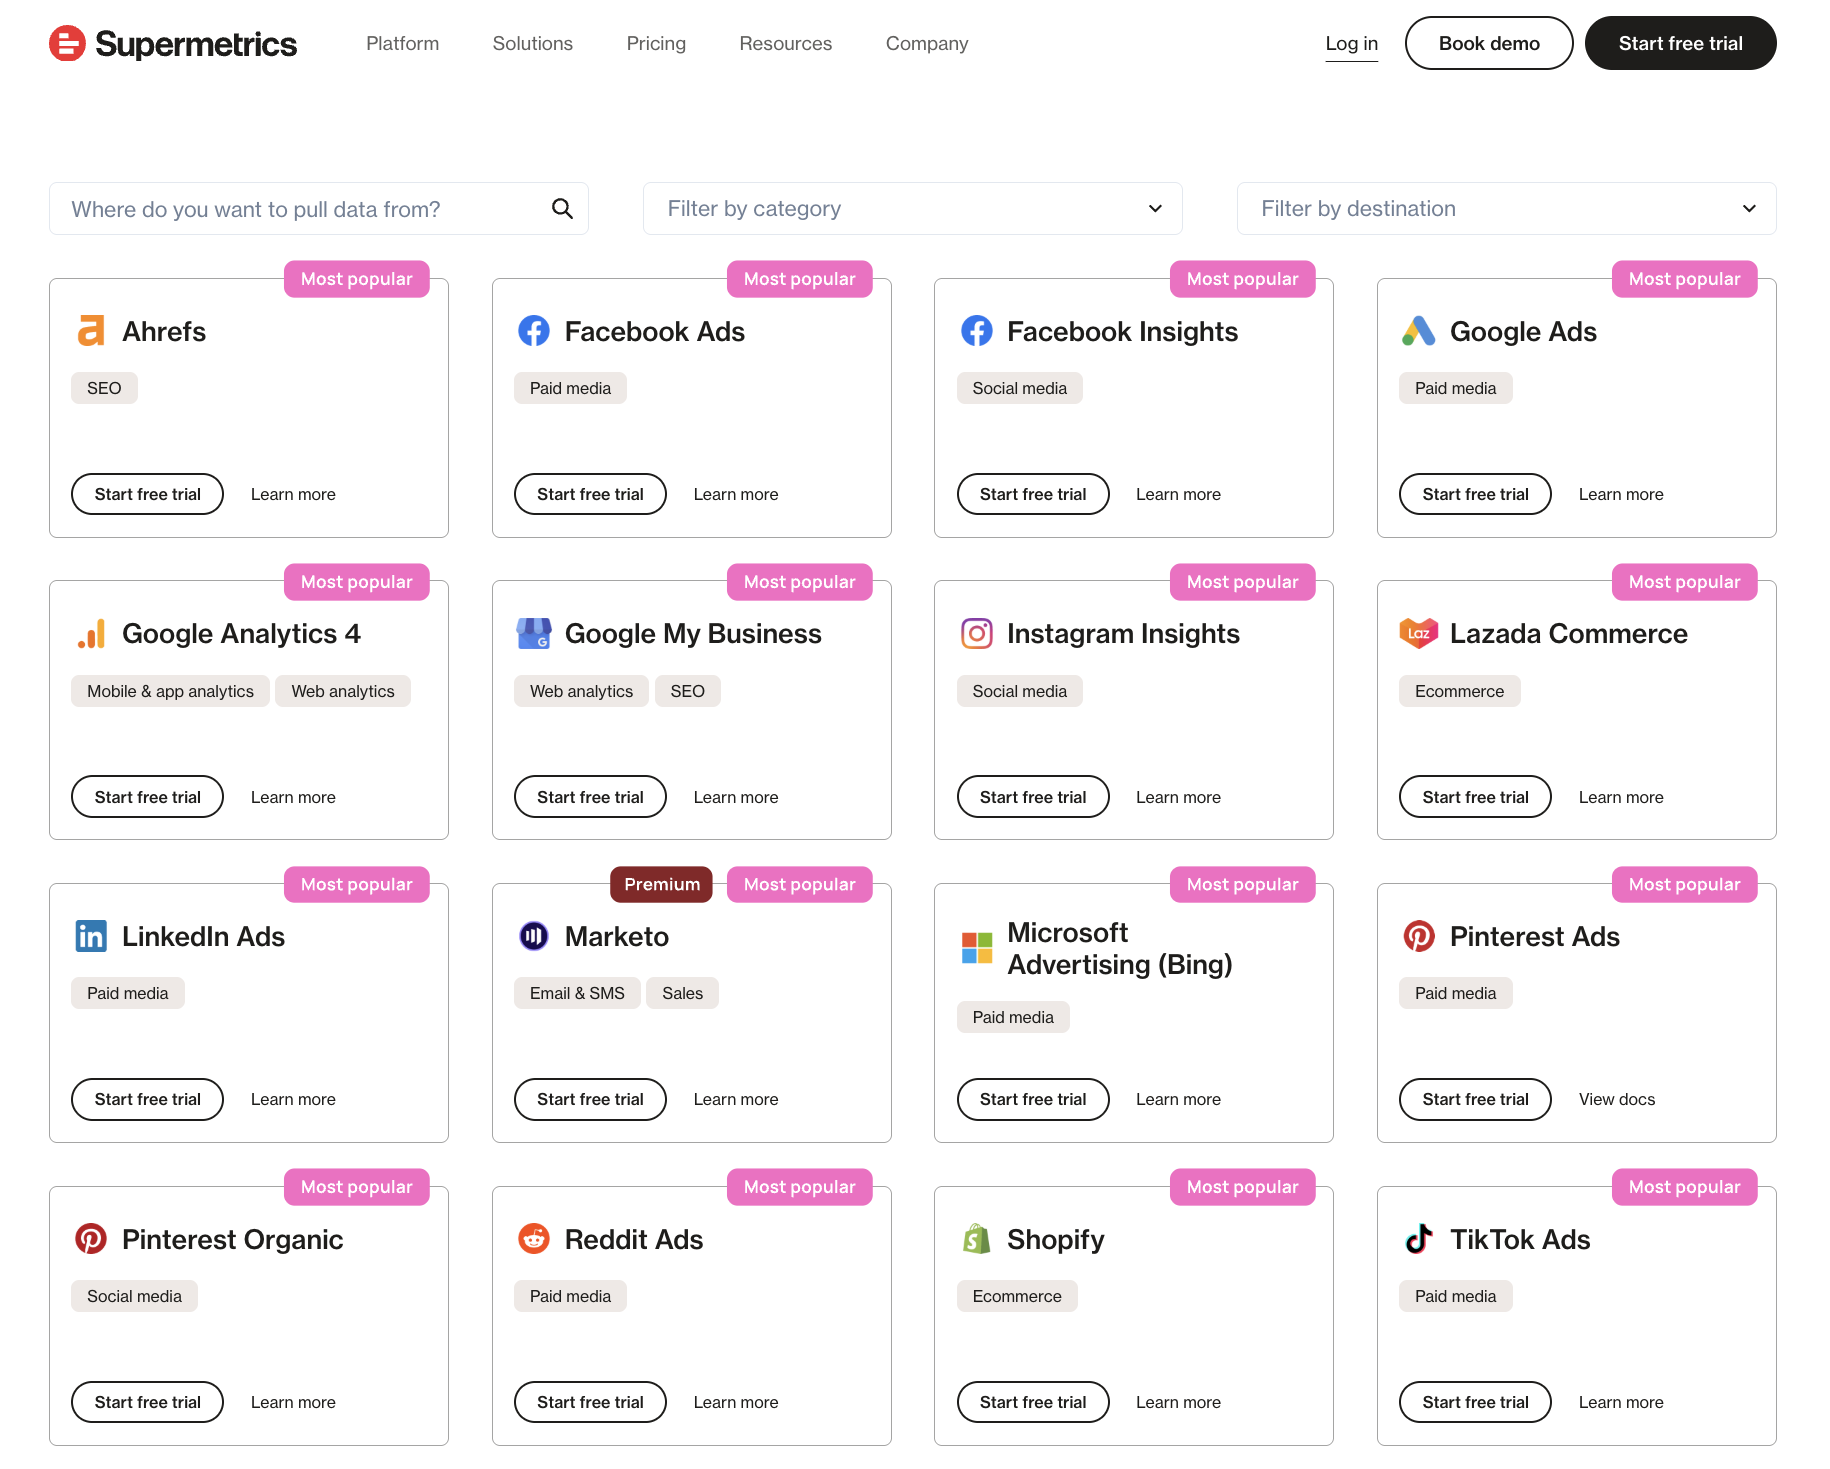
The breadth is genuinely impressive—if your marketing stack looks like a giant Jenga tower with dozens of different platforms, there's a good chance Supermetrics has a connector for it.
Whatagraph offers 55+ out-of-the-box integrations across similar categories: paid ads, social media, SEO, email marketing, analytics, ecommerce, call tracking, and CRM. While the total number is smaller, Whatagraph focuses on the platforms most agencies and marketing teams actually use daily.
Premium tiers and add-ons
Here's where things get tricky with Supermetrics. While the 130+ number sounds impressive, not all connectors are created equal:
- Tiered access: Some "premium" or newer connectors are only available on higher-priced plans
- Paid add-ons: Specific connectors you assumed were standard actually require an additional fee on top of your subscription
- Early access limitations: Several connectors are still in beta, meaning functionality or reliability may vary
For example, Adobe Analytics, Campaign Manager 360, and Salesforce require premium upgrades. Others like Google Ads Keyword Planner and Close CRM are still in early access.
Whatagraph takes a different approach—all 55+ integrations are fully managed and included in your plan. No premium tiers for basic connectors, no surprise add-on fees.
Are the integrations stable?
Unfortunately, based on what we hear from ex-Supermetrics users, Supermetrics connections break—a lot.
These breakages happen during the “connecting” stages—when you're sending data from a source platform (like Google Ads) to Supermetrics, and then to Looker Studio or your chosen BI tool.
And when these connections break, the data on your dashboard becomes inaccurate, which is one of the biggest reasons why users start looking for Supermetrics alternatives.
Tanja Keglić, Performance Marketing Manager at Achtzehn Grad agency, experienced this firsthand:
It's such a pain to reconnect a lot of sources and accounts on Supermetrics—and it takes so much time, which you don't have when you want a quick report.
When these connectors break, you'll either need to manually reconnect them yourself or contact Customer Support and wait.
Whatagraph's integrations are fully-managed by our engineering team, which means there are less chances of them breaking. And if they do break (which rarely happens), we’ll fix them for you—instead of you having to baby-sit the connections yourself.
And according to data from the past 6 months, our platform has a 99.95% uptime. This means platform-wide outages are very, very rare.
After Tanja switched to Whatagraph, the difference was night and day:
We don't have any connection issues on Whatagraph at all. We just connected the platforms once, and that was it. Whatagraph is also very, very fast when loading the data.
What about data freshness and refresh rates?
Supermetrics offers scheduled refreshes, but there are significant limitations straight from their own documentation:
- Hard limit of 5 scheduled refreshes per file (like a single Google Sheet)
- Total scheduled refreshes per account should stay below 50—having 100+ can cause refreshes to fail
- Google Apps Script limitation means their refresh system can only run for about 6 minutes per account, per hour
Whatagraph offers consistent 30-minute data refresh rates across all integrations, data sources, accounts, and pricing plans—no hidden limits or costs.
Are there custom data integrations?
Both marketing analytics tools offer ways to bring in custom data.
Supermetrics provides Google Sheets integration and Custom API access, but setting up custom integrations often requires developer resources and technical know-how.
Whatagraph offers three custom integration options:
- Google Sheets integration (drag-and-drop simple)
- Custom API access
- Integration requests (80-90% of requested integrations get implemented)
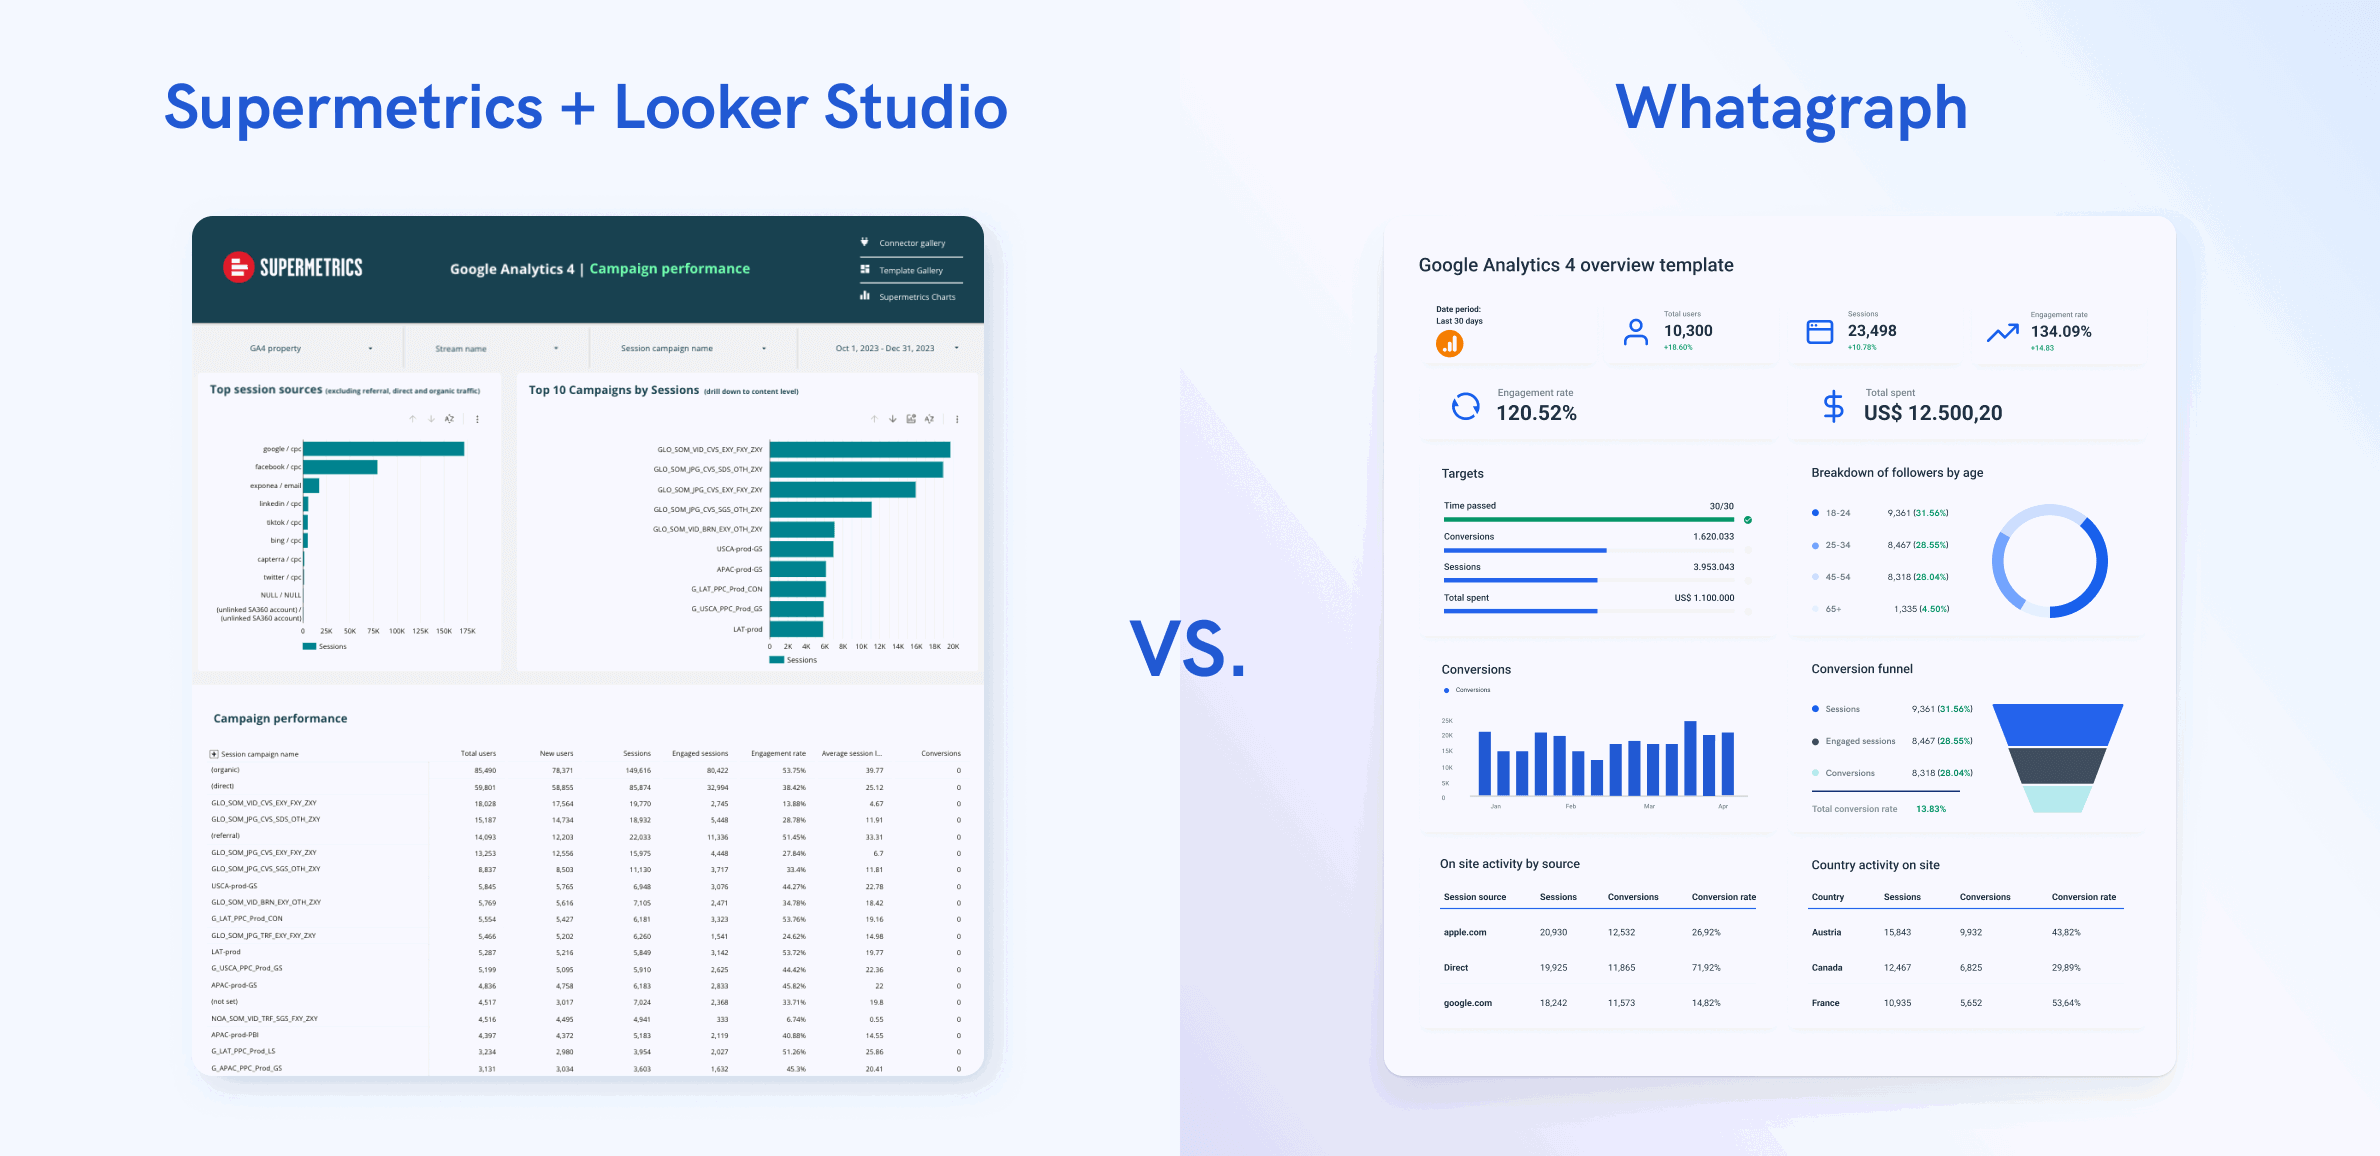
Feature #2: Data Visualization and Reporting
Next, let’s see how Supermetrics and Whatagraph compare when it comes to data visualization and reporting.
Supermetrics
As we’ve mentioned previously, Supermetrics does not come with native data visualization dashboards.
It’s purely a data pipeline—it pulls data and drops it off. There are no internal dashboards, no drag-and-drop chart builders. If you want to actually see your data or create client-ready reports, you're immediately in "tool two" territory.
Most Supermetrics users end up pairing it with Looker Studio (formerly Google Data Studio), but this creates what I like to call the "two-tool Frankenstein" workflow.
Here's what that actually looks like day-to-day:
- Step 1: Connect your marketing platforms to Supermetrics (sounds easy until connectors randomly break)
- Step 2: Ship that data into Looker Studio—if the sync lags or breaks, your charts go blank
- Step 3: Build your report in Looker Studio (prepare for another steep learning curve with nested filters, field mismatches, and 15-20 second loading times per widget)
- Step 4: Realize something's off in the data—now you're debugging across two platforms
- Step 5: Contact support (maybe both teams) and hope you get answers before your client check-in
- Step 6: Manually patch the report if needed via Google Sheets workarounds
- Step 7: Repeat this chaos across every client and every campaign
Kim Strickland, Digital Marketing Specialist at Peak Seven agency, lived this nightmare daily. She used to spend over 40 hours per report, plagued by broken filters, mismatched fields, and client-facing errors:
Looker Studio was slow and always breaking. The data wouldn't pull through, or it would pull through incorrectly. It was frustrating, time-consuming, and a constant guessing game.
Apart from the slowness and broken reports, here are more problems with this two-tool set up:
- You're constantly switching tabs. Copying IDs, toggling data source settings, re-checking filters, adjusting dimensions—just to get your dashboard to look normal, let alone insightful.
- No seamless UX handoff. There's no shared memory between tools. When something breaks, you're left wondering: Is it Supermetrics? Looker Studio? Or the source platform's API?
- Double the support headaches. If your GA4 data won't load, is that a Supermetrics problem or a Google problem? You might end up with two platforms' support documentation open just to troubleshoot one report.
- White-labeling limitations. Need your logo? Custom fonts? Client brand colors? That's entirely dependent on the second tool's capabilities—and Looker Studio isn't exactly known for stunning design flexibility.
Whatagraph
Whatagraph eliminates this mess by handling everything in one platform.
- Native dashboards and reporting: Connect your data sources and you can immediately start building reports. No exports, no secondary tools, no broken handoffs.
- AI-powered setup: Use Whatagraph IQ to generate reports in seconds. Just tell our AI what you want to track, and it builds the dashboard for you. You can also get AI to create and edit individual widgets, and style the report according to a screenshot of your brandbook or a simple prompt.
- Drag-and-drop simplicity: Building reports feels intuitive, not like solving a puzzle. Add widgets, customize layouts, and create professional reports without a technical background.
- True white-labeling: Your logo, your agency colors, your custom domain (reports.youragency.com). Even email notifications carry your brand—not ours or Google's.
- Template library: Start with pre-built templates for common use cases, then customize from there. No building from scratch every time.
After Kim switched to Whatagraph, she clawed back 63 hours every month from reporting and saw an incredible $9,000 in reported savings per client, each month. She said:
With Looker Studio, everything was muddled. But Whatagraph has opened up transparency and communication. Whatagraph is now our Bible—both for clients and internal teams.
Feature #3: Data Transformation & ETL
For teams that need to manipulate, blend, or transform their marketing data before reporting, the capabilities differ significantly.
Supermetrics
- Data blending available, but guidance is limited. Supermetrics offers data transformation features, but the in-platform guidance on execution is sparse. You'll see impressive use cases showcased, but minimal help on how to actually execute them unless you upgrade.
- External dependency for complex transformations. Since Supermetrics is just a pipeline, any sophisticated data manipulation happens in your destination tool (Looker Studio, BigQuery, etc.). This means learning multiple transformation languages and dealing with the limitations of each platform.
- Storage limitations. The basic "Supermetrics Storage" is only available on Pro plans and above. Lower-tier users are limited to direct transfers without intermediate storage or processing.
- Manual data blending headaches. When you're combining data from Facebook Ads, Google Analytics, and your CRM in Looker Studio, you're managing three separate data sources with different refresh schedules, field naming conventions, and potential sync issues.
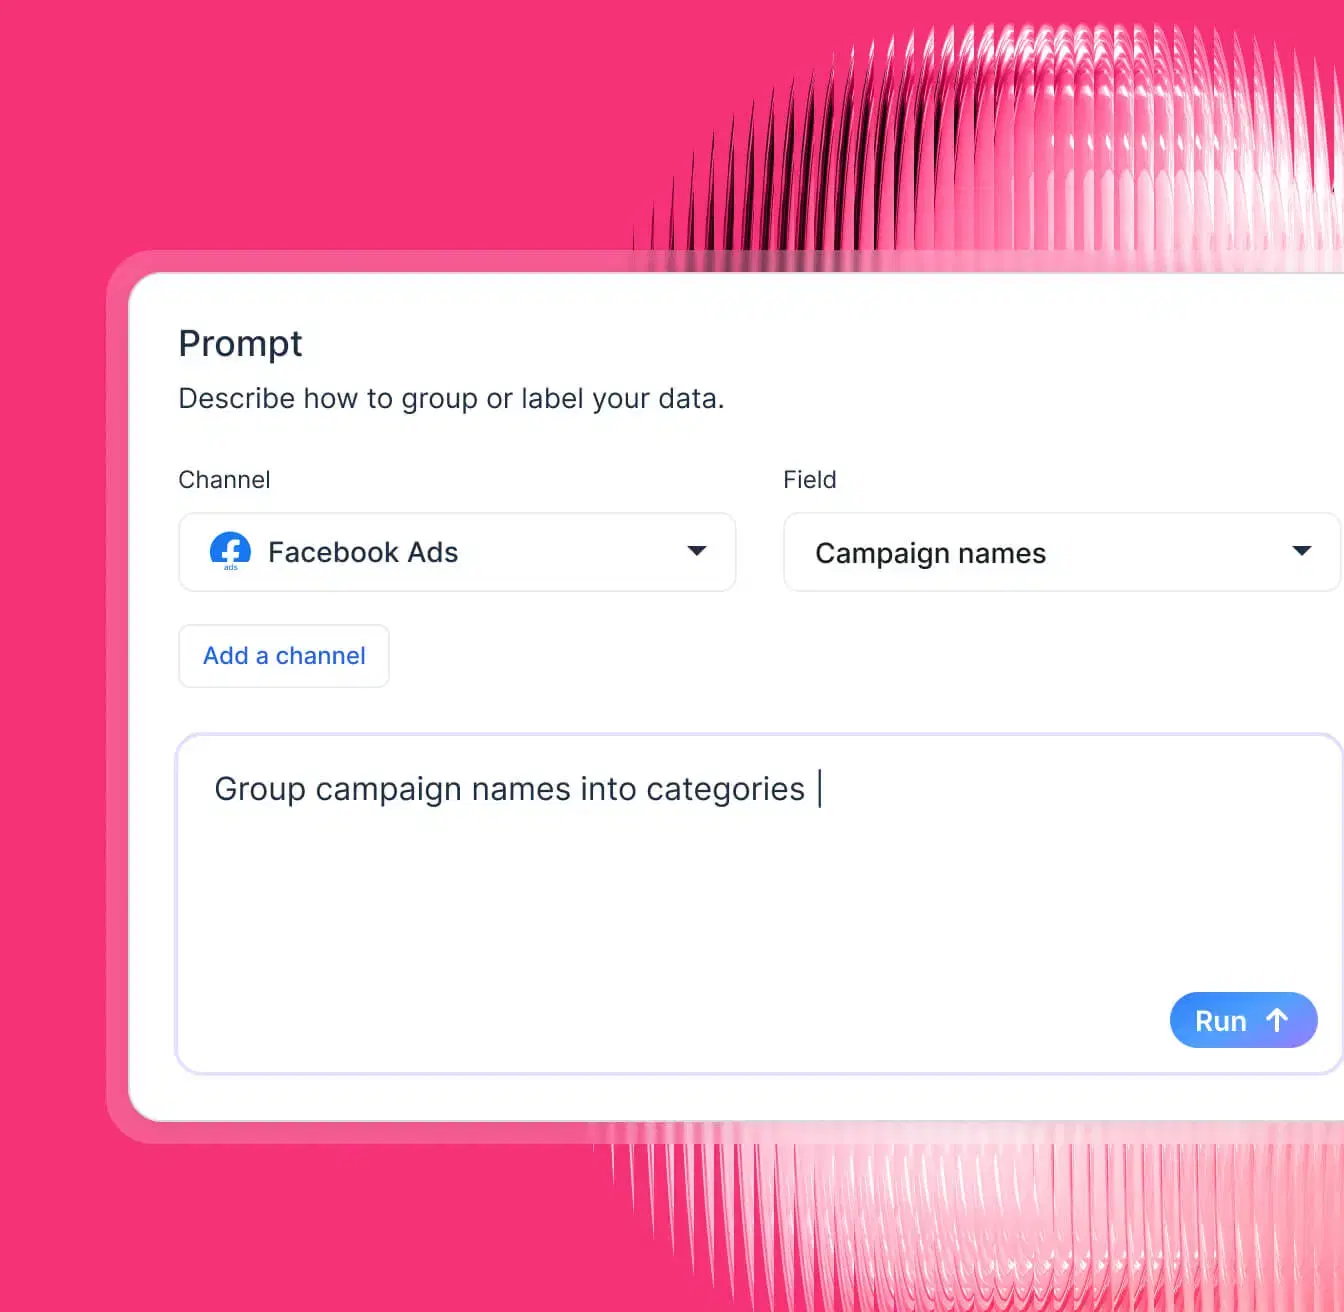
Whatagraph
- Done-for-you data transformation. You don’t need complex joins or technical setups to create custom metrics, dimensions, and blends on Whatgraph. You can just describe how you want to organize your data, like grouping campaign names by category or sorting product reviews by language, and Whatagraph’s AI will build it for you automatically.
- Smart automation. Save all the custom metrics, dimensions, and blends you’ve created and re-use them everywhere.
- Currency and timezone handling. Whatagraph handles currency conversions and timezone adjustments across global campaigns. No manual spreadsheet formulas or constant recalculation headaches.
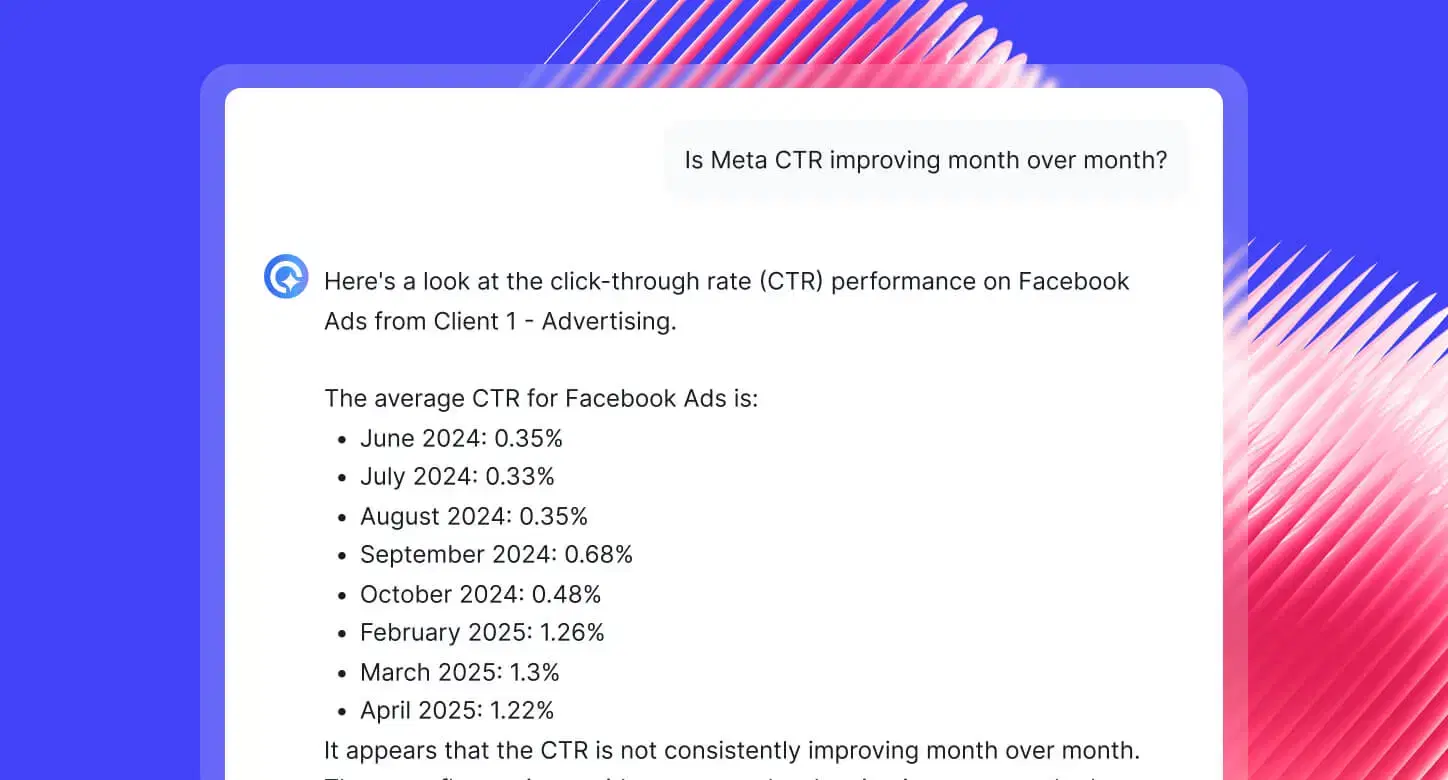
- AI-powered insights. Whatagraph doesn't just transform your data—it gives you actionable insights in seconds too. Get our AI to write out performance summaries inside of your reports in 18 languages and four formats.
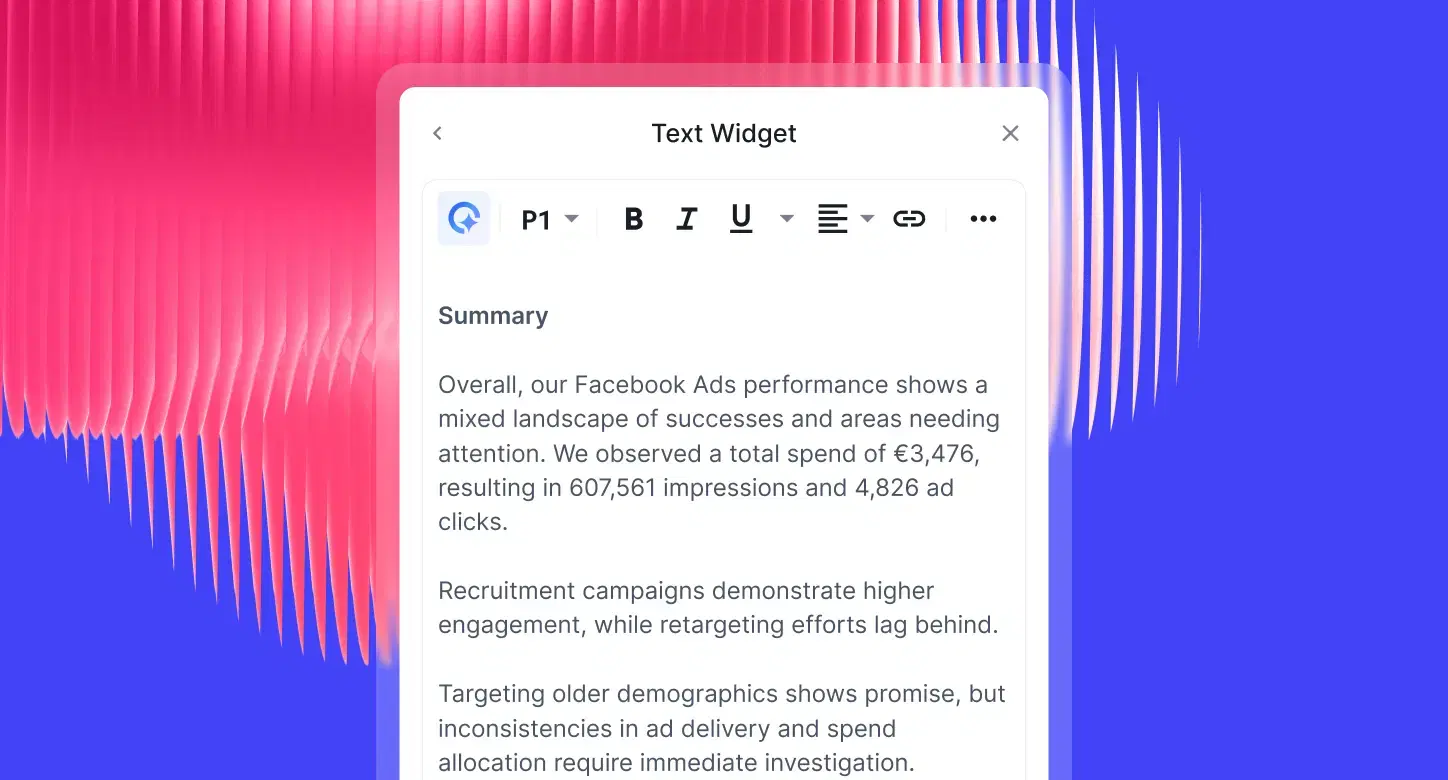
Or, ask Whatagraph IQ chat any questions you want about your marketing data and it’ll give you actionable insights in seconds.
The bottom line: Supermetrics requires you to become a data engineer across multiple tools. Whatagraph handles the complex data work so you can focus on insights and client success.
As Tanja Keglić, Performance Marketer at Achtzehn Grad agency tells us in this case study:
The biggest reason we chose Whatagraph was because of its holistic approach. We wanted to blend more sources together to see in one overview what's the performance and what we should change or adapt—and Whatagraph made this possible.
Feature #4: Automation and Scheduling
Both Supermetrics and Whatagraph platforms promise automation, but the execution and reliability differ significantly.
Supermetrics
- Refresh limitations: Supermetrics has a hard limit of 5 scheduled refreshes per file to "maintain reliability." If you need more frequent updates, you have to break your data into separate files.
- Account-wide restrictions: They recommend keeping total scheduled refreshes below 50 per account—having 100+ can cause refreshes to simply fail.
- The 6-minute rule: Due to Google Apps Script limitations, Supermetrics' refresh system can only run for about 6 minutes per account, per hour. If your data pulls take longer (and for agencies with lots of data, they often do), the refresh gets "pushed out."
- No native report delivery: Since Supermetrics doesn't create reports, there's no automated sharing or delivery. You'll need to handle that in your secondary tool (Looker Studio, Sheets, etc.).
- Manual maintenance required: When connectors break (and they do), you’ll be left babysitting the connections and fixing them manually.
Whatagraph
- Consistent data refresh rates: Whatagraph automatically refreshes data across all your reports and data sources every 30 minutes. You don’t need to manually refresh them yourself or worry that the data on your reports isn’t going to be up-to-date when your clients look at the report.
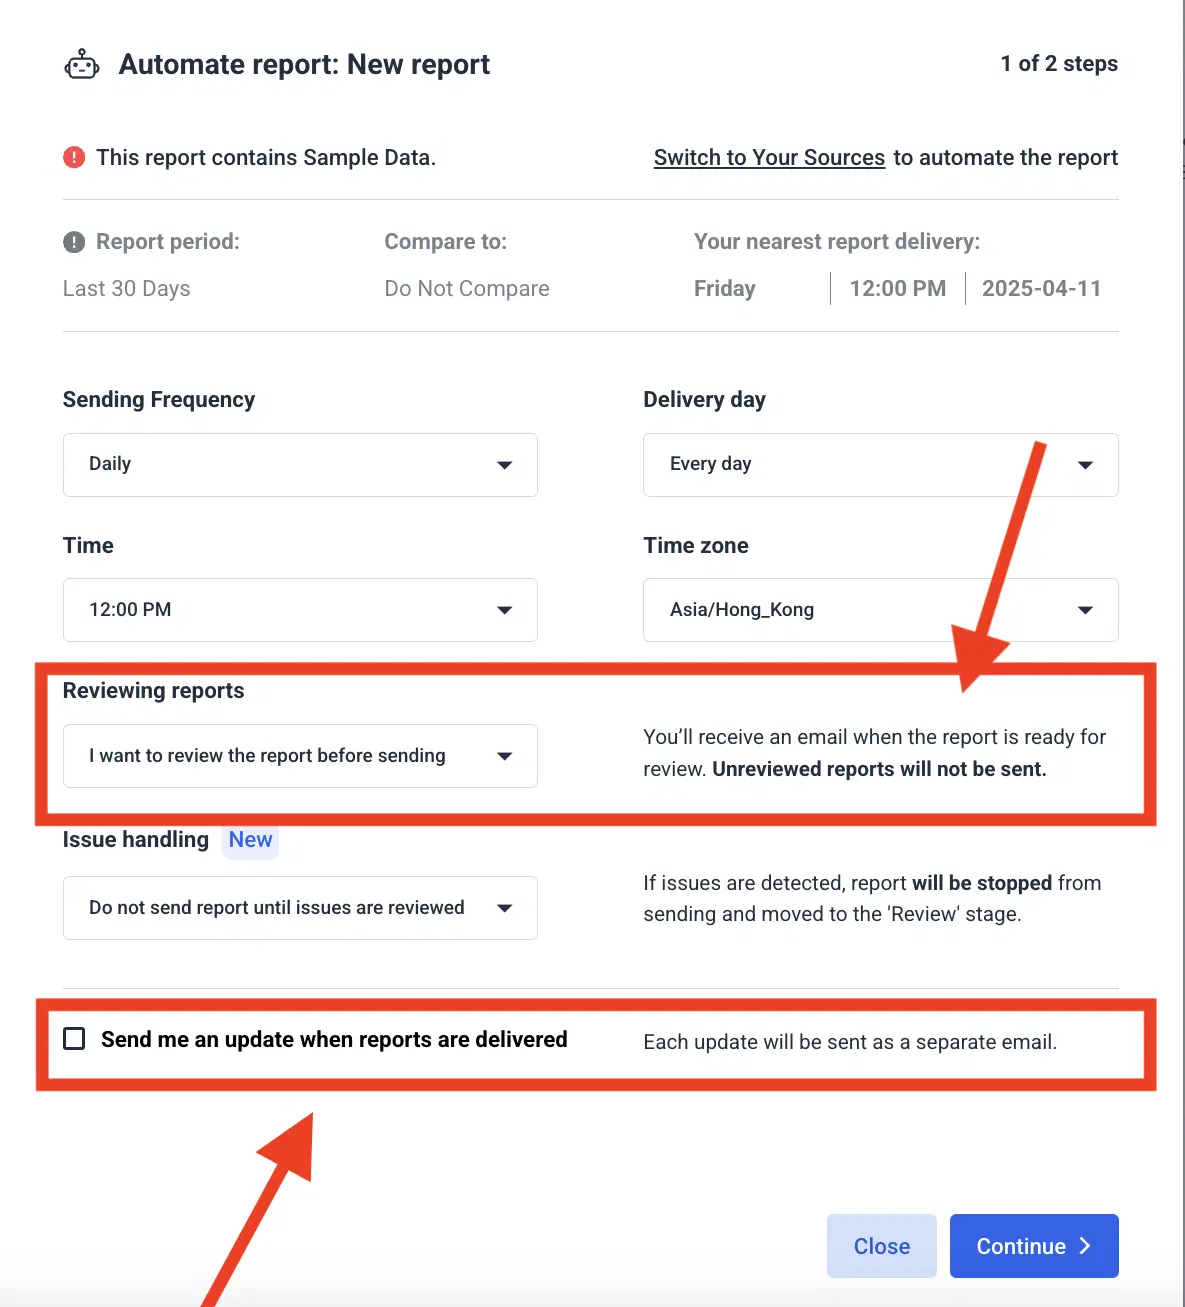
- Automated report delivery: Schedule reports to be emailed to clients or C-Suite weekly, monthly, or on custom intervals. Fully customize how your emails will look like, as if they came from you directly.
- Live dashboard sharing: Share dashboards via secure links with clients or C-Suite, and they’ll see up-to-date and accurate data, always. This is super important to building trust and transparency.
- Goals & Alerts: Set performance goals and get alerted when campaigns hit thresholds, budgets run low, or performance changes significantly.
- Linked reports: Need to add a widget to 10 different reports? You don’t need to go through each one individually. On Whatagraph, you can simply have a “Master” template and link all other similar reports to this template. Then, you edit that Master template once, and the changes will sync across all linked reports automatically.
The bottom line: Whatagraph's automation works across the entire reporting workflow—from data connection to final delivery. With Supermetrics, you're only automating the first step (data pulling) while everything else remains manual.
Feature #5: Pricing and Value for Money
This is where Supermetrics' complexity really shows—and where many users get sticker shock after they've already committed.
Supermetrics
Supermetrics’ pricing look reasonable at first glance:
- Starter: $29/month (3 data sources, 1 user)
- Growth: $159/month (7 data sources, 2 users)
- Pro: $399/month (10 data sources, 3 users)
- Business: Custom pricing (unlimited everything)
But here's the catch—the pricing is modular. You “bolt on” capacity as you go:
- Each additional data source: $29
- Each destination (Google Sheets, Looker Studio, BigQuery): $149 each
- Each additional user: $29-$99 depending on plan
- Individual ad accounts within platforms count separately
Most small to mid-sized agencies (5-15 clients) realistically spend $600-$1,200/month, and if you have 50+ clients, expect to pay around $4,000/month, just like one of our customers who was previously using Supermetrics.
And that's just for Supermetrics—you might still need to pay for a data visualization tool (unless you’re using Looker Studio, but then expect to deal with slow load times).
Of the 12 recent verified reviews on G2 in 2025, four of them mention Supermetrics' pricing as what they dislike most. As Sebastiaan R. put it:
The costs for additional output tools is crazy high.
Hidden cost drivers:
- Plan limits don't match real usage: The Starter plan's 3 data sources barely cover Google Ads + Facebook + GA4. Most agencies need LinkedIn, email platforms, and multiple ad accounts
- Per-destination charges: Want data in both Google Sheets AND Looker Studio? That's two data destinations.
- Premium connector fees: Need Salesforce or Adobe Analytics? Extra cost on top of your subscription
- Support is gated: Actual help costs more unless you're on enterprise tiers
A Reddit user in r/DigitalMarketing called Supermetrics “overrated” because there are “better cheaper options today” with “much better support.”
Whatagraph
Instead of the modular, pay-per-piece pricing Supermetrics uses, Whatagraph scales primarily through source credits , one main lever tied to how many data sources you're actually connecting, with unlimited users and reports on every plan. You start on a free trial with full platform access, then move to a plan sized to your needs.
You can check the pricing page for the most up-to-date numbers.
Feature #6: Customer Support
When your client reports are due in two hours and your data connectors suddenly break, customer support becomes make-or-break. The difference in support quality between these platforms is stark.
Supermetrics
Support is locked behind premium tiers. Unless you're on a Business or enterprise plan, you're mostly on your own. Basic plans get standard email support with no guaranteed response times.
The two-platform support nightmare. Here's where Supermetrics' two-tool workflow creates real headaches. When something breaks, is it a Supermetrics problem or a Looker Studio problem? You might end up filing tickets with both teams and playing middleman between different support departments.
Complex ticket submission process. Before you even explain your problem, Supermetrics requires you to:
- Select issue categories from multiple dropdowns
- Specify which Supermetrics product you're using
- Pinpoint exact data sources
- Provide Query IDs and Request IDs
- Select your active license
For a busy agency dealing with a broken client report, this feels like jumping through hoops when you just need a quick fix.
Some users also report feeling blindsided by shifting terms after committing to contracts. Nimit B. shared on Trustpilot:
[Supermetrics] initially assured me that if I cancelled my license, future payments would be stopped. However, after cancelling, they're now forcing me to pay for the entire year! The customer support is absolutely useless.
Whatagraph
Every user gets a dedicated Customer Success Manager. Not just enterprise clients—everyone. From day one, you have a named person who knows your account, understands your setup, and proactively helps you succeed.
Live chat that actually responds. Our support team responds in under 1 minute during business hours. No waiting days for email responses or getting shuffled between departments.
One platform, one support team. Since everything happens in Whatagraph, there's no finger-pointing between different vendors. We own the entire workflow, so we can actually fix problems instead of passing you around.
Proactive problem-solving. Rather than just answering tickets, Whatagraph support helps you optimize your reporting workflows, suggests better approaches, and even implements feature requests based on user feedback.
Stef Oosterik, Quality Manager, from Dtch. Digitals agency perfectly captured this difference:
Whatagraph's support team is very responsive. This makes it easy for us to give feedback, think of solutions, and get the right data visible for clients quickly. And most issues are fixed in a day!
Final Verdict: Supermetrics vs Whatagraph
After digging deep into both platforms—from data connections to pricing and support—the choice really comes down to your team's technical resources, workflow preferences, and long-term reporting goals.
Choose Supermetrics if you’re ready for the technical heavy lifting
You've got the tech resources:
- Your team includes dedicated data analysts who can wrangle multi-tool workflows
- You're already using BI tools like Looker Studio, Tableau, or Power BI
- Those 130+ connectors matter because you work with super niche platforms
- You enjoy building custom solutions and don't mind babysitting connector issues
And…you can handle the trade-offs:
- Juggling multiple tools when something breaks (and it will break)
- Learning both Supermetrics AND your visualization platform
- Costs that creep up as you add more data sources and users
- Basic support unless you're paying premium prices
Choose Whatagraph if you want to focus on being a marketer, not a data scientist
You’d rather focus on strategy, not troubleshooting:
- You're a performance marketer, agency owner, or marketing specialist who wants to spend time on strategy, not babysitting data connections
- Your team lacks dedicated BI resources or technical depth
- You manage multiple clients and need reliable, branded reporting at scale
- You value predictable costs and transparent pricing over complex modular systems
And…you prioritize reliability, ease of use, and efficiency:
- Seamless, reliable native integrations
- One platform handling everything from connection to delivery
- Easy to use platform with AI that will literally build reports, widgets, and custom metrics and dimensions for you
- Professional, branded, accurate reports you’ll be proud to send to clients or your boss
- Fast customer support and a dedicated Customer Success Manager who’s got your back
If you’re still on the fence, you can try out the free trial now.
Published on Feb 22 2023
WRITTEN BY
YamonYamon is a Senior Content Marketing Manager at Whatagraph. With an eye for detail and a knack for always considering context, audience, and business goals to guide the narrative, she's on a mission to create genuinely helpful content for marketers. When she’s not working, she’s hiking, meditating, or practicing yoga.