What is Supermetrics? The No-Nonsense Guide for Marketers
If you’re here, chances are you’re spending too much time copy-pasting data from 10 different platforms into 10 different spreadsheets. And now you’re wondering if Supermetrics can fix that.
Good news: It can – kind of.

Jun 11 2025●6 min read


Supermetrics is one of the most popular tools for automating marketing data transfers. But before you commit, you need to know what it actually does, how it works, what it costs, and whether it’s the right fit for your team or agency.
This guide breaks all of that down – without the fluff or hype.
Let’s start with the basics: what Supermetrics is (and what it’s not).
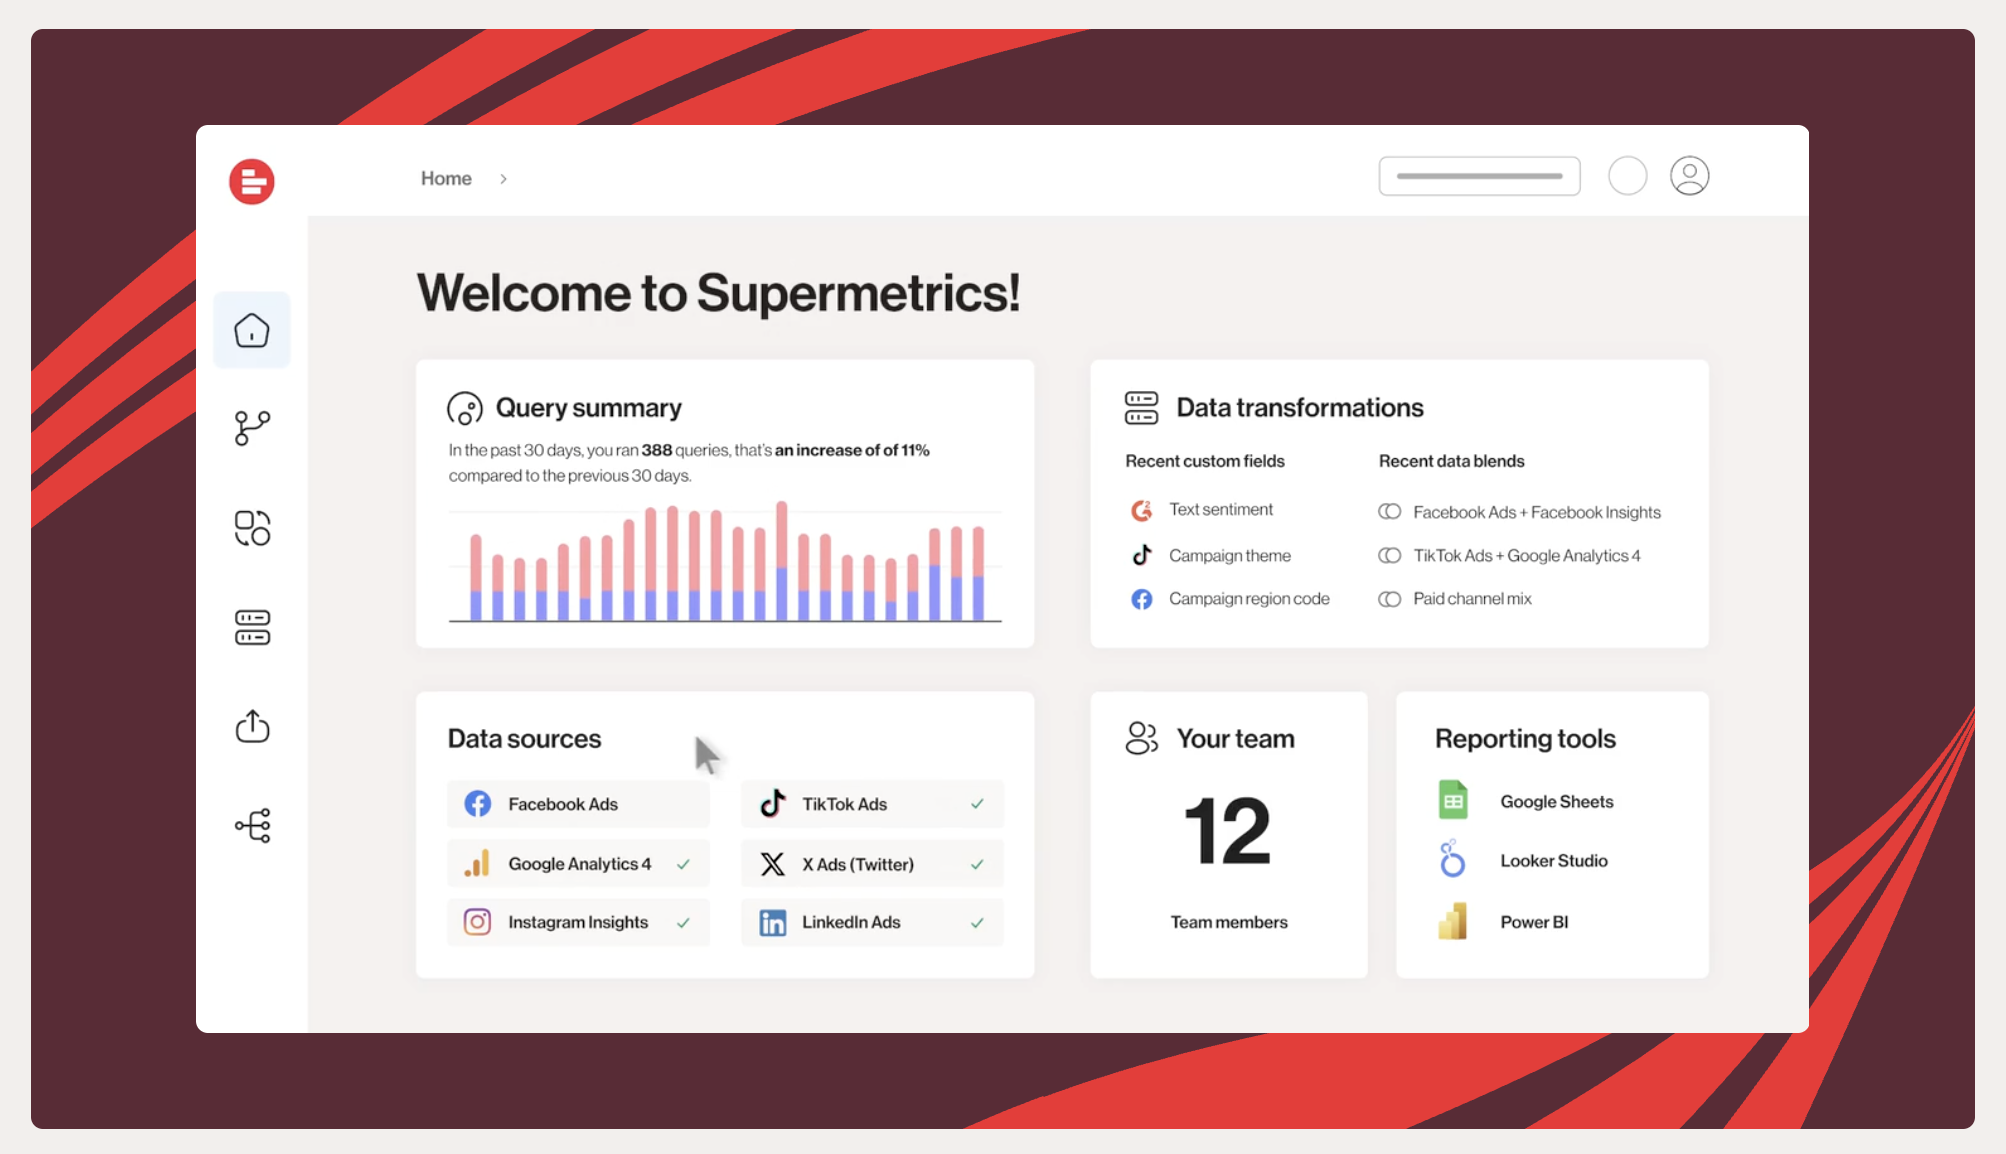
What is Supermetrics (and How Does it Work)?
Supermetrics is a no-code data pipeline tool built for marketing teams.
Think of it as the “middleman” that pulls performance data from platforms like Google Analytics, Facebook Ads, HubSpot, and Shopify – and sends it into tools like Google Sheets, Google Data Studio, BigQuery, or Excel.
It eliminates the need for manual exports, spreadsheet copy-pasting, or building complex APIs from scratch.
At its core, Supermetrics helps marketers move data from where it lives to where they want to analyze or report on it. That’s it. It doesn’t visualize data. It doesn’t create reports. It just makes sure the numbers get from A to B – accurately, automatically, and at scale.
So if you’re spending hours downloading CSVs, fixing broken connectors, or refreshing dashboards manually, this is the kind of tool that’s supposed to save you from all that grunt work.
Supermetrics’ Key Features At a Glance
Here’s what you get out of the box with Supermetrics:
- 130+ marketing and sales data sources: From Google Analytics and Facebook Ads to HubSpot, LinkedIn, TikTok Ads, and more.
- Multiple destinations supported: Send data to Google Sheets, Excel, Looker Studio, Power BI, BigQuery, Snowflake, and Supermetrics Storage.
- Automated refreshes & scheduling: Set reports to auto-update hourly, daily, or weekly – no more manual exports or refresh clicks.
- Customizable queries: Pick your metrics, dimensions, date ranges, and filters for complete control over your data pulls.
- Light data transformation & blending: Merge data from multiple platforms, rename fields, and clean up datasets before they hit your reporting tool.
- Granular, unsampled data access: Pull precise data directly via API, avoiding the limitations of platform UIs or sampled exports.
- Secure and compliant: Enterprise-grade security, GDPR-compliant data handling, and role-based access control.
- No-code interface: Designed for marketers—not developers. You can get started without writing a single line of code.
What Supermetrics is NOT:
But to really understand Supermetrics, it helps to get clear on what it doesn’t do.
❌ It’s not a data visualization tool
Supermetrics doesn’t offer any dashboards or native reporting interface. If you want to build a visual dashboard or client report, you’ll need to plug it into a business intelligence tool like Looker Studio or Power BI.
❌ It’s not a full marketing intelligence platform
You can’t create internal dashboards, set up KPI tracking, or generate client-facing reports with Supermetrics alone. It moves data, but it doesn’t help you analyze, visualize, or share that data – unless you bolt on other tools.
If that’s what you’re looking for, a tool that does all of it, Whatagraph is a better fit.
With Whatagraph, you can:
- Connect all your data sources in one space
- Manipulate and organize your data without any codes
- Visualize this data in internal dashboards and external reports
- Set up goals and alerts of how your campaigns are doing
- Extract insights from your data in seconds using AI
- Automate reports to go out on a scheduled time and day
- Send your data to BigQuery or Looker Studio
So yes, Supermetrics is great at what it does. But if you want everything under one roof, you’ll need more than just a data connector.
What Does Supermetrics Do? Supermetrics Core Function
At a glance, Supermetrics pulls marketing data from 130+ platforms and delivers it into tools where you can analyze or report on it.
But let’s break it down into the specific things it actually does, so you know what to expect (and what not to).
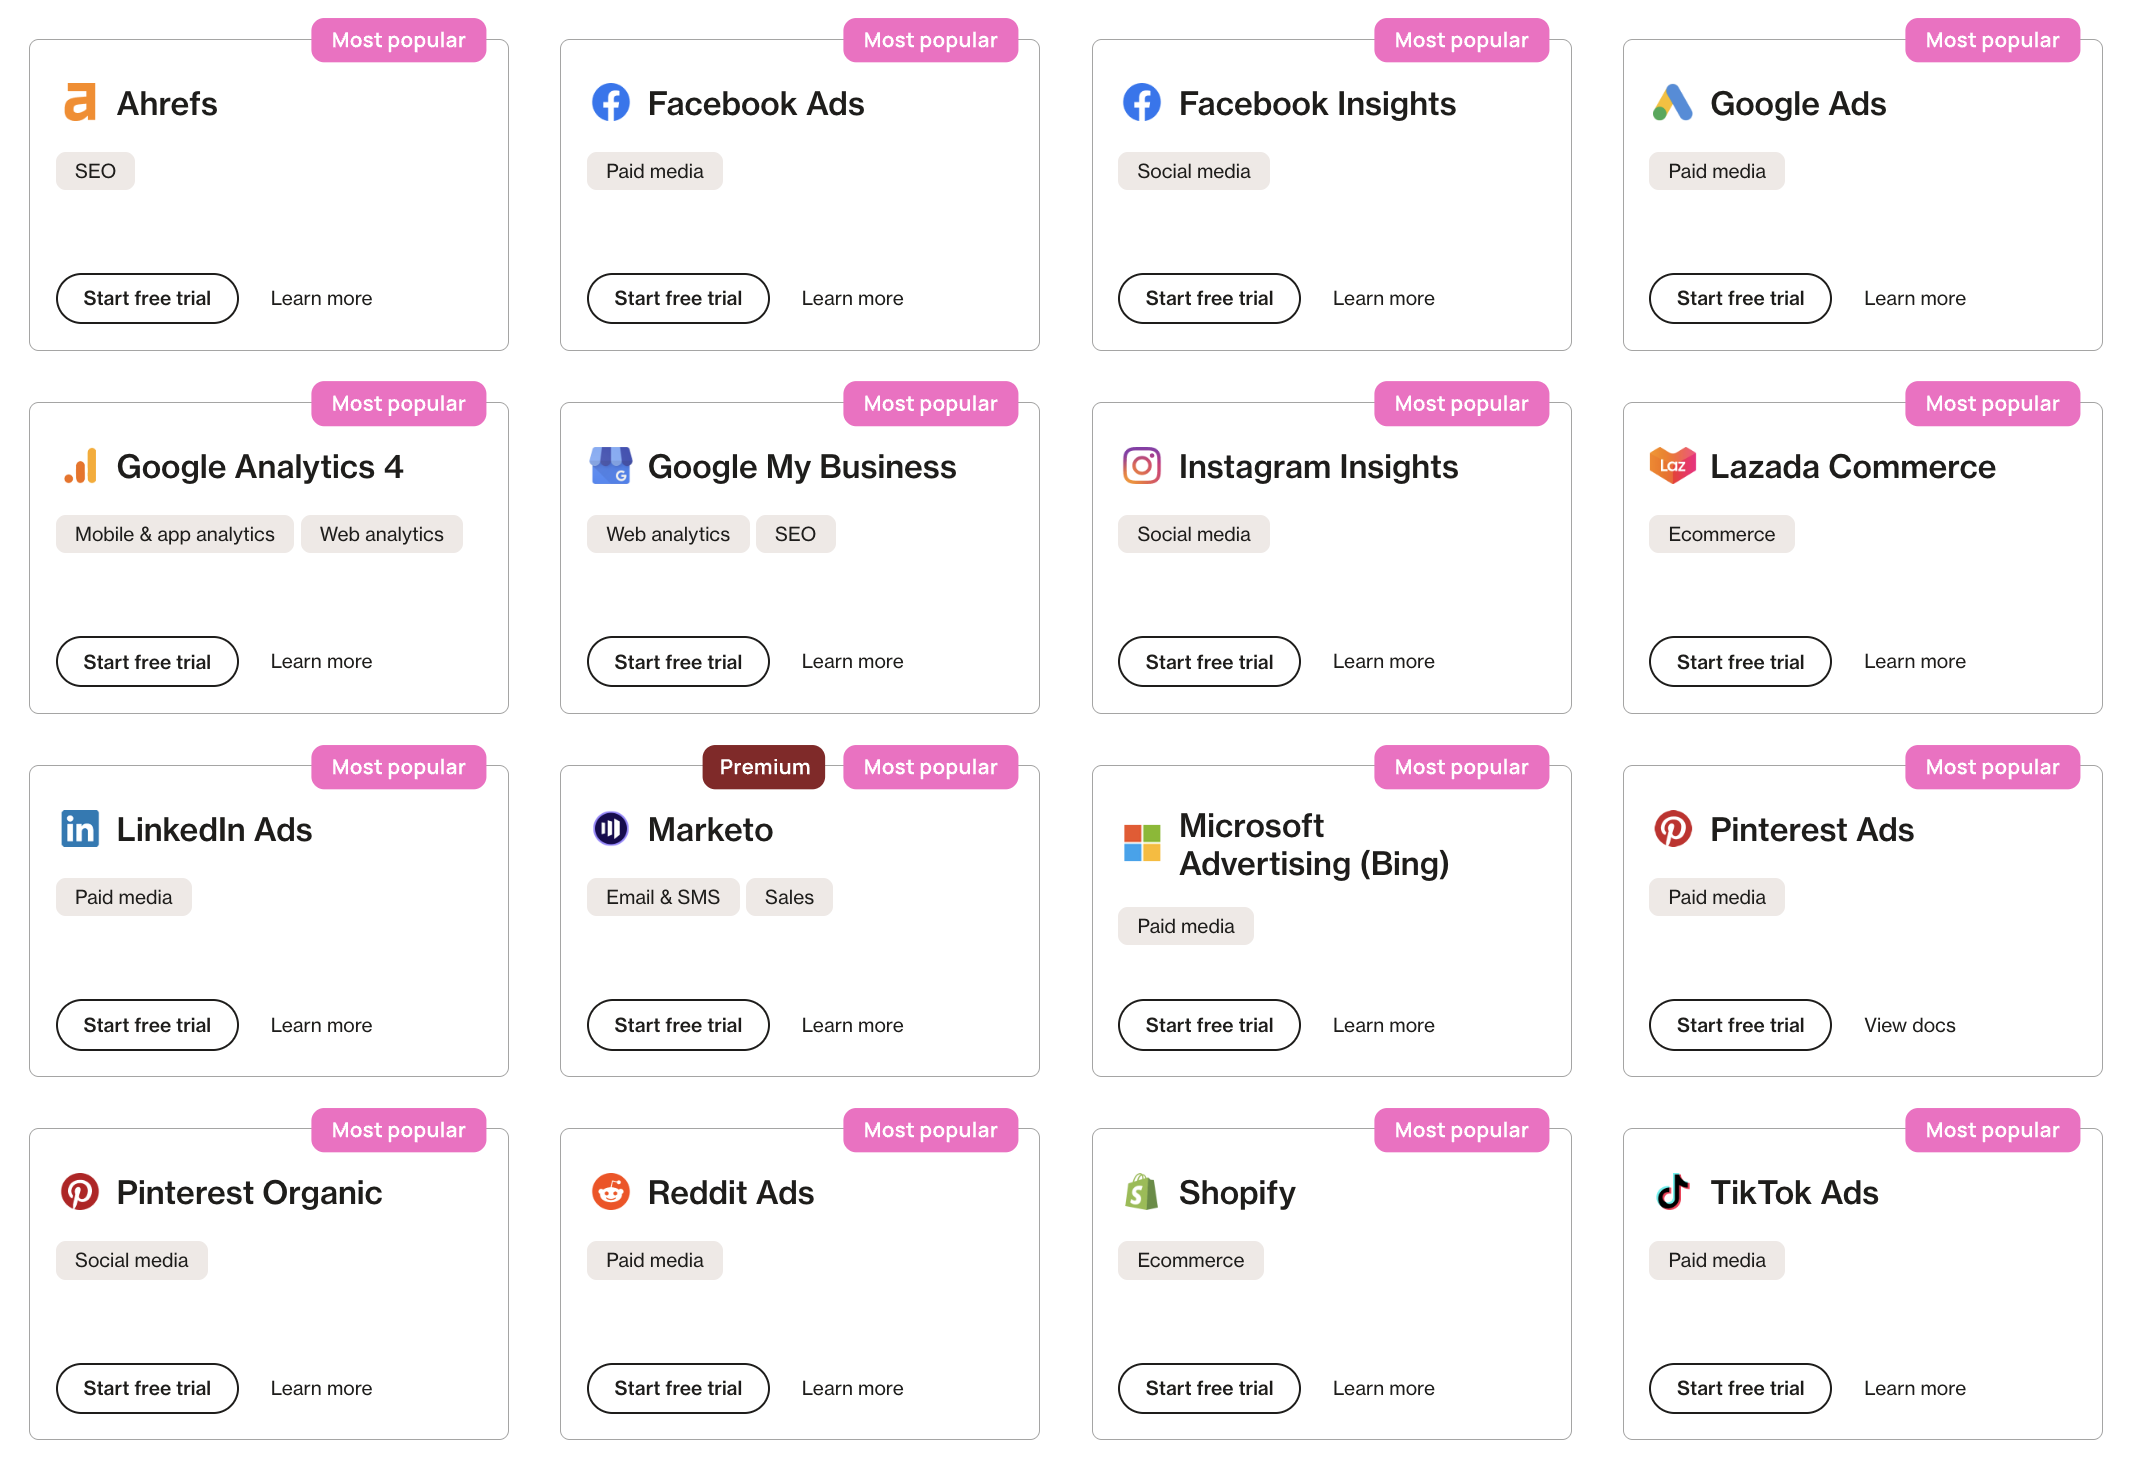
✅ Connects to 130+ Marketing Platforms
Supermetrics integrates with most of the platforms marketers care about: Google Analytics, Facebook Ads, LinkedIn, HubSpot, Shopify, TikTok Ads, Google Ads, and dozens more.
These connections are built through APIs—so instead of logging into every platform one by one, you can set Supermetrics up once and pull everything into one place.
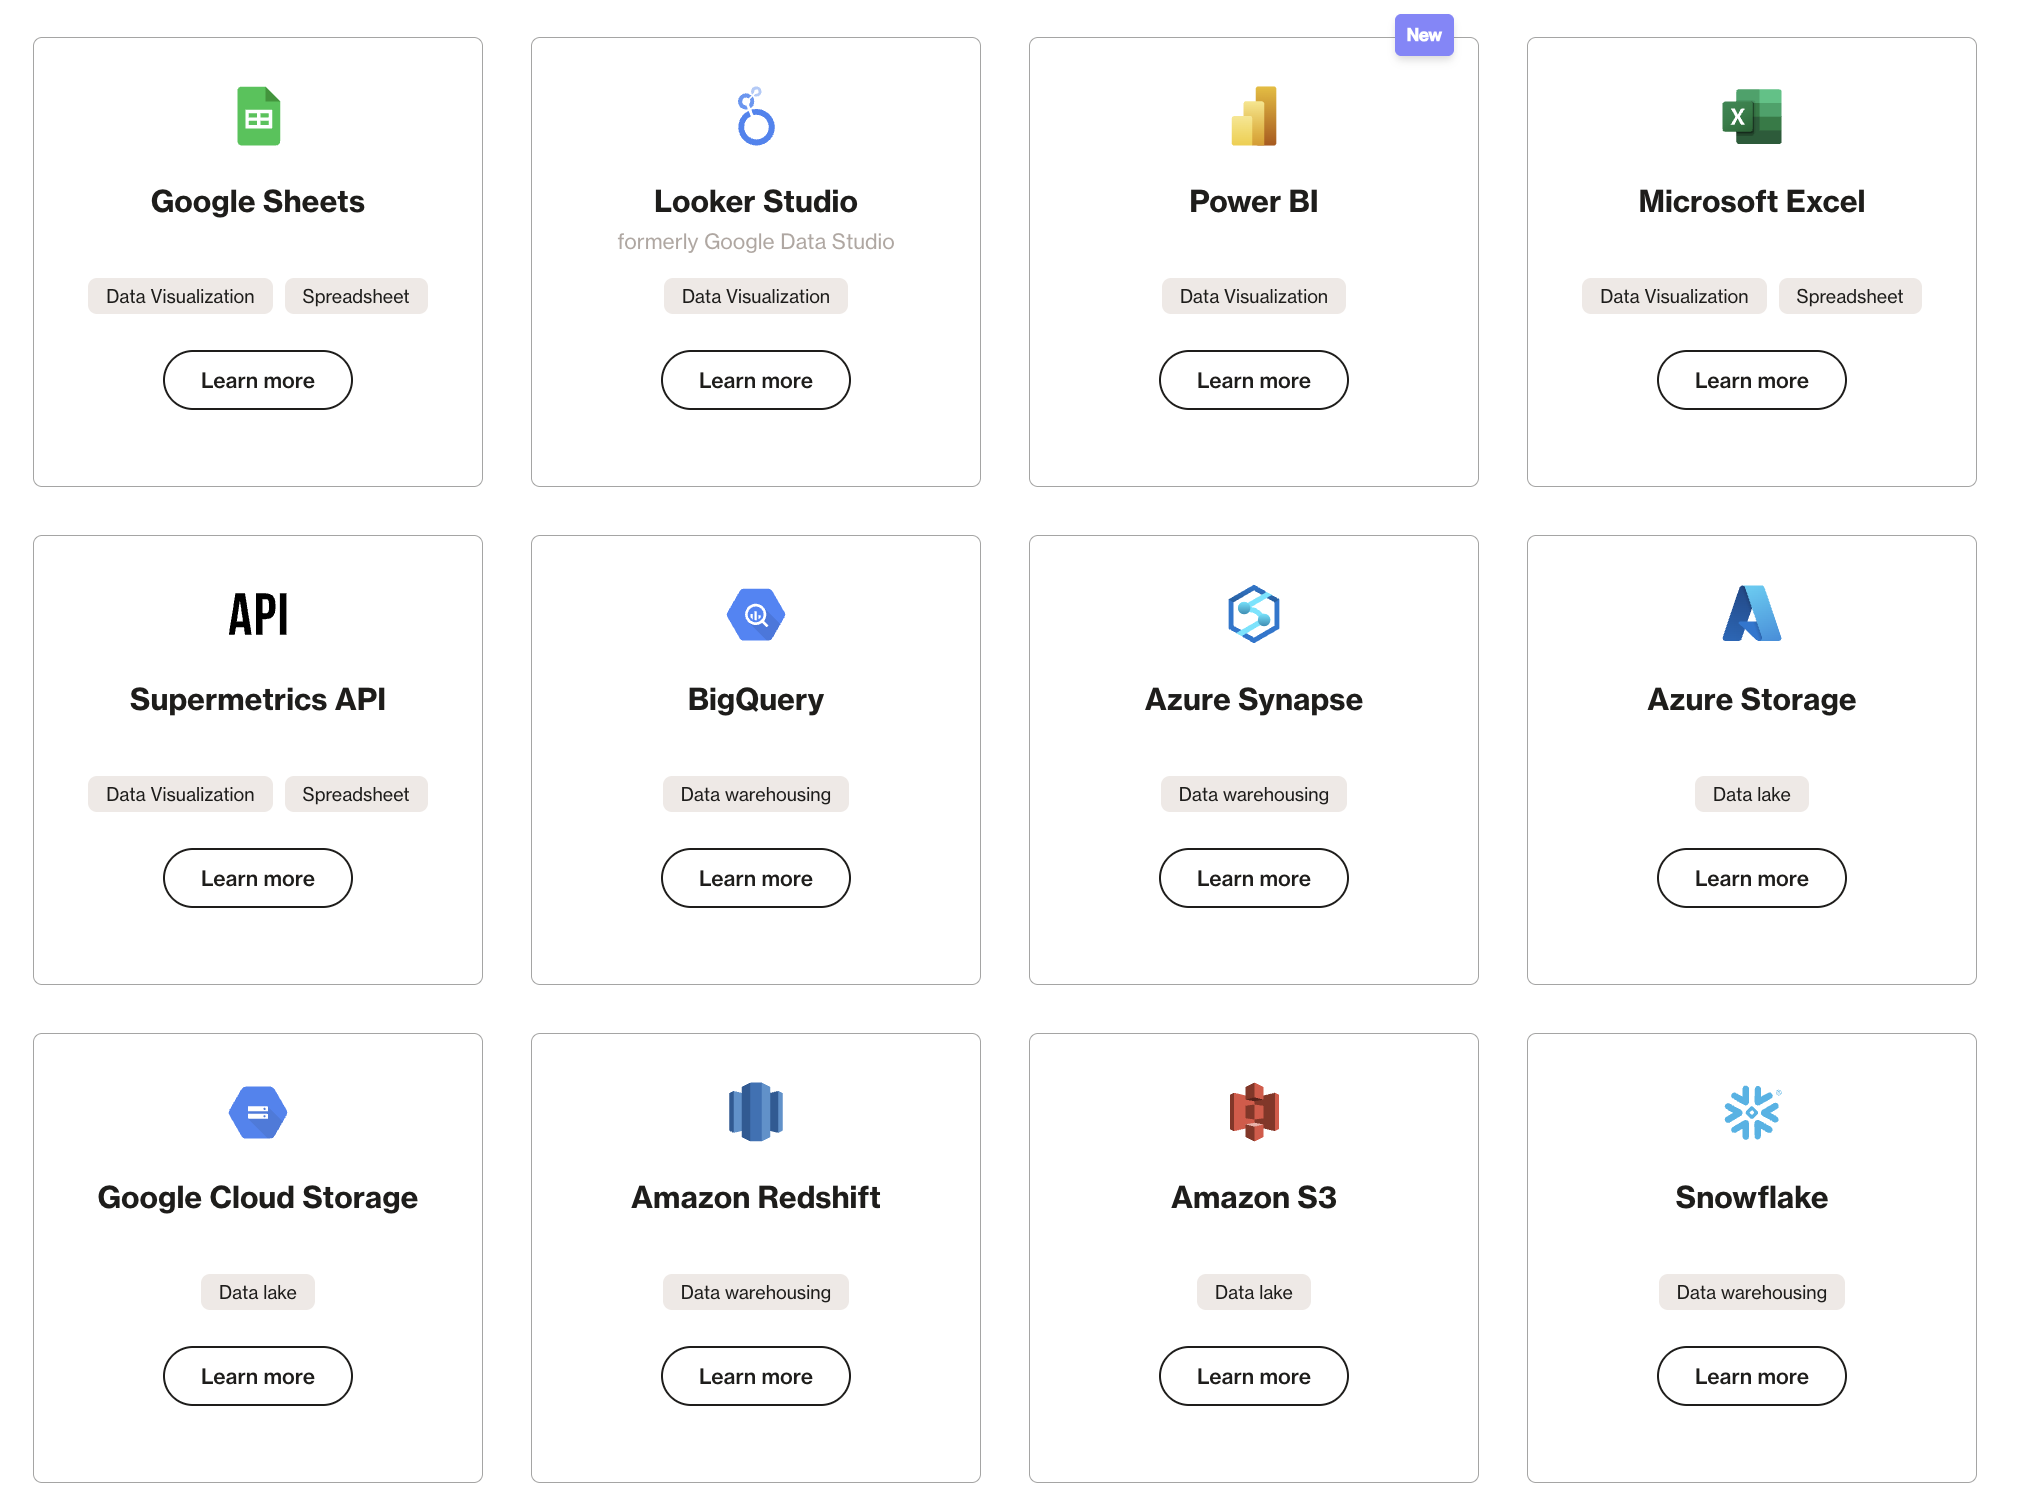
✅ Pushes Data Into Your Favorite Tools
You choose the destination. Supermetrics sends your data to:
- Spreadsheets: Google Sheets, Excel
- Dashboard tools: Looker Studio, Power BI
- Warehouses: BigQuery, Snowflake, Amazon Redshift
- Supermetrics Storage (temporary holding zone)
This flexibility is one of its biggest strengths—especially if you’re already invested in a BI stack.
✅ Builds and Schedules Custom Queries
You’re in control of what data you pull and how often. You can:
- Choose metrics and dimensions (e.g. Sessions, CTR, Campaign Name)
- Set filters and date ranges
- Schedule hourly, daily, or weekly refreshes
- Avoid sampling by pulling granular, unsampled data via API
Once set up, your dashboards or spreadsheets update themselves – no more manual refreshes.
✅ Enables Data Transformation (Sort Of)
You can do light transformations – like blending data across channels or renaming metrics – but this isn’t a full transformation layer like dbt or a custom ETL tool. You’ll still need external logic (or formulas) if you want deep data modeling.
Here’s what’s available:
- Convert currencies
- Standardize campaign naming conventions
- Apply filters to your campaign data and analyze results by region, channel, and more
- Blend data from paid channels together
- Combine your paid channels with web analytics to measure ROAS and conversions
✅ Helps Teams Work From a “Single Source of Truth”
When set up correctly, Supermetrics can feed the same data into multiple tools, keeping your team’s reports aligned across channels and clients.
But remember: you still need a dashboard tool to see that data—and you’ll need to handle report formatting and sharing yourself.
How Does Supermetrics Work?
Supermetrics works by acting as the data pipeline between your marketing platforms and your reporting tools. You choose the data source, define what you want to pull, and tell it where to send the data.
Here’s a step-by-step:
1. Data Transfer: Pick a Destination Tool
First, you decide where you want the data to land. Most marketers start with tools like:
- Google Sheets (great for scrappy reports or spreadsheet lovers)
- Looker Studio (for client-facing dashboards)
- BigQuery or Snowflake (for teams with a BI setup)
You’ll need to install a Supermetrics connector or add-on based on the tool.
2. Data Integration: Connect Your Data Sources
Next, you authenticate your marketing platforms—Google Analytics, Facebook Ads, LinkedIn, TikTok, etc.—within Supermetrics. Once connected, Supermetrics can access the data via API.
 You can also upload your custom data and map out the fields.
3. Build Your Query
This is where you tell Supermetrics exactly what you want:
- Choose metrics (like clicks, conversions, impressions)
- Add dimensions (like campaign, device, channel)
- Apply filters (e.g. “only Facebook Ads campaigns from last 30 days”)
- Select date ranges
You can save your queries and even duplicate them across different clients or campaigns.
You can also create data blends, standardize campaign names, convert currencies, and more with Supermetrics.
5. Schedule Automatic Refreshes
Once your query is live, you can set it to update:
- Hourly (for near real-time dashboards)
- Daily (for standard campaign monitoring)
- Weekly (for internal or client reporting)
That means your spreadsheet, dashboard, or warehouse always stays fresh without manually hitting refresh.
6. Use the Data in Your Reports or Dashboards
Now the data’s there. But remember: Supermetrics doesn’t actually visualize anything.
If you’re using Google Sheets or Excel, you’ll need to build charts or pivot tables manually.
If you’re in Looker Studio or Power BI, you’ll need to create visuals from scratch.
And if you’re working with BigQuery, someone on your team probably knows SQL.
7. Choose your Data Storage
Alternatively, you can also choose to store your data in a data warehouse. If you don’t already have one, Supermetrics offers a service called “Supermetrics Storage”, where you can store all your historical cross-channel data.
It’s great for:
- Storing your data in centrally managed location to make sure your reports load faster
- Avoiding being affected by unexpected outages from source platforms
- Building a historical database of your marketing performance and do long-term trend analyses
In short, Supermetrics handles the delivery. But you’re still responsible for the design, interpretation, and reporting workflow.
That’s where many marketers hit a wall – and why they look for Supermetrics alternatives like Whatagraph.
How to Use Supermetrics (3 Use Cases)
There are many use-cases of Supermetrics, but we’ll cover the three most common ones that most marketers use Supermetrics for:
Use Case 1: Supermetrics with Google Sheets
If you love spreadsheets (or your team lives in them), Supermetrics is one of the fastest ways to automate live data updates.
Here’s how it works:
- Open a Google Sheet.
- Click on Extensions → Add-ons → Get add-ons.
- Search for “Supermetrics” in the Google Workspace Marketplace.
- Click Install and grant the necessary permissions.
- Once installed, go to Extensions → Supermetrics → Launch sidebar.
- From the sidebar, click “Create a new query.”
- Choose your data source (like Google Analytics or Facebook Ads).
- Select your metrics, dimensions, and date range.
- Apply any filters if needed.
- Hit “Get Data”—your sheet populates with live data from the platform.
You can then set up automatic refreshes (daily, hourly, etc.) or even email delivery if you want the report sent out on a schedule.
Pro tip: You can build multiple queries across tabs to report on different channels in one sheet.
Here's a handy video from Supermetrics:
Use Case 2: Supermetrics with Looker Studio
Supermetrics is one of the most popular connectors for Looker Studio—especially when you need non-Google data like Facebook Ads or LinkedIn.
You can connect Supermetrics to Looker Studio in three ways:
- From the Supermetrics Hub
- From the Looker Studio data source gallery
- From the Supermetrics website’s connector list
The easiest method is to use the Supermetrics Hub, especially if you're connecting multiple sources.
Here’s how to do it:
- Go to the Supermetrics Hub and sign in.
- Scroll to “Connect to new data source” and choose your platform (e.g. Facebook Ads).
- Click Connect and follow the prompts to log in.
- Choose whether the connection is private or shared.
- After connecting, open Looker Studio in another tab.
- Go to Looker Studio → Add data → Partner Connectors → Supermetrics.
- Select the same data source you just connected in the Hub.
- Click Authorize, then Complete & Continue.
- Choose your Supermetrics team and confirm the connection.
- Finally, click Connect → Create report → Add to report.
Bonus tip: If you hit issues with multiple Google accounts or failed logins, clearing your cookies or using Incognito often helps avoid authentication loops.
Here’s a handy video from Supermetrics:
Once your data connection is live, here’s how to actually build your report:
- In Looker Studio, click Create → Report.
- Under My Data Sources, pick your Supermetrics connector.
- Click Add, and your blank report will open.
- Click Add a Chart in the top menu to start visualizing your metrics.
- Style and customize the report however you like—text, filters, breakdowns, etc.
And yes, you can set up automated refreshes, so your reports update themselves daily or hourly based on your Supermetrics schedule.
Don’t want to start from scratch? You can check out a wide variety of Supermetrics templates here.
For instance, this is how a Google Analytics 4 report template looks like:
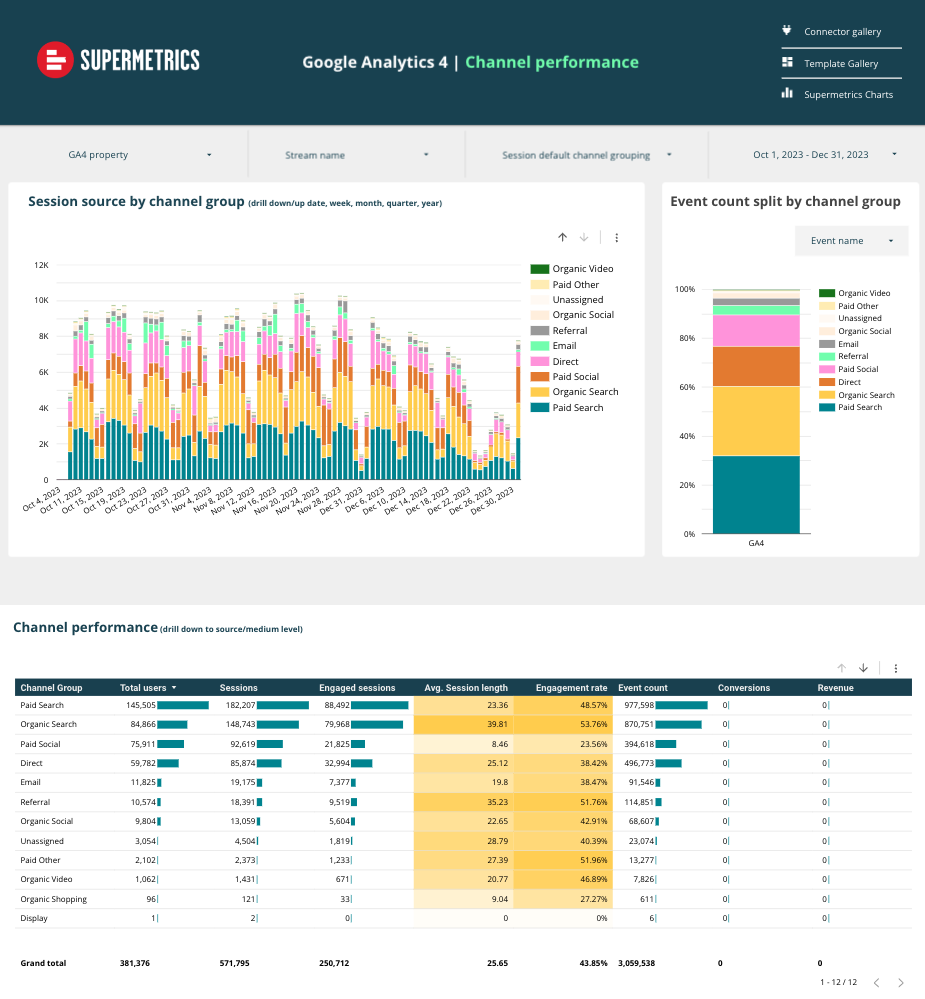
You’ve got two ways to use them:
Option 1: From the Data Source Setup
- During data source setup in Looker Studio, scroll down.
- Check the box “Use report template for new reports.”
- Click Connect → Create report—done.
This loads a ready-to-go dashboard layout tailored to your data source.
Option 2: From the Template Gallery
- Go to the Supermetrics Template Gallery (make sure you’re logged in).
- Pick a template and click Get the Template.
- Authenticate your Supermetrics account and choose your data source.
- Check “Use report template for new reports”.
- Click Connect → Create report.
If prompted, click “Use my own data” to switch the template from demo to your live account.
From there, you can fully customize the dashboard – swap charts, change dimensions, or add filters to make it your own.
Example 3: Using Supermetrics With BigQuery or Snowflake
If your team is more technical, or you're centralizing data across departments, you can use Supermetrics to send raw data into a cloud warehouse.
- Choose BigQuery or Snowflake as your destination.
- Connect your marketing platforms.
- Define the schema, tables, and structure for your data pulls.
- Set up automated syncs—daily, hourly, or custom frequency.
- Use SQL (or your BI tool) to analyze or visualize from there.
This setup gives you maximum control but also requires more in-house expertise.
How Does Supermetrics Pricing Work?
Now here comes the juicy part.
How much does Supermetrics cost and is it worth it?
Based on our analysis in this honest Supermetrics reviews guide, most small to mid-sized agencies (5–15 clients), particularly those handling complex ecommerce datasets or extensive social media campaigns, can expect to spend between $600–$1,200/month.
That’s because Supermetrics charges you based on three things:
- Data sources (e.g. Facebook Ads, Google Analytics)
- Destinations (e.g. Google Sheets, BigQuery, Looker Studio)
- Users or accounts (team size, seats, usage limits)
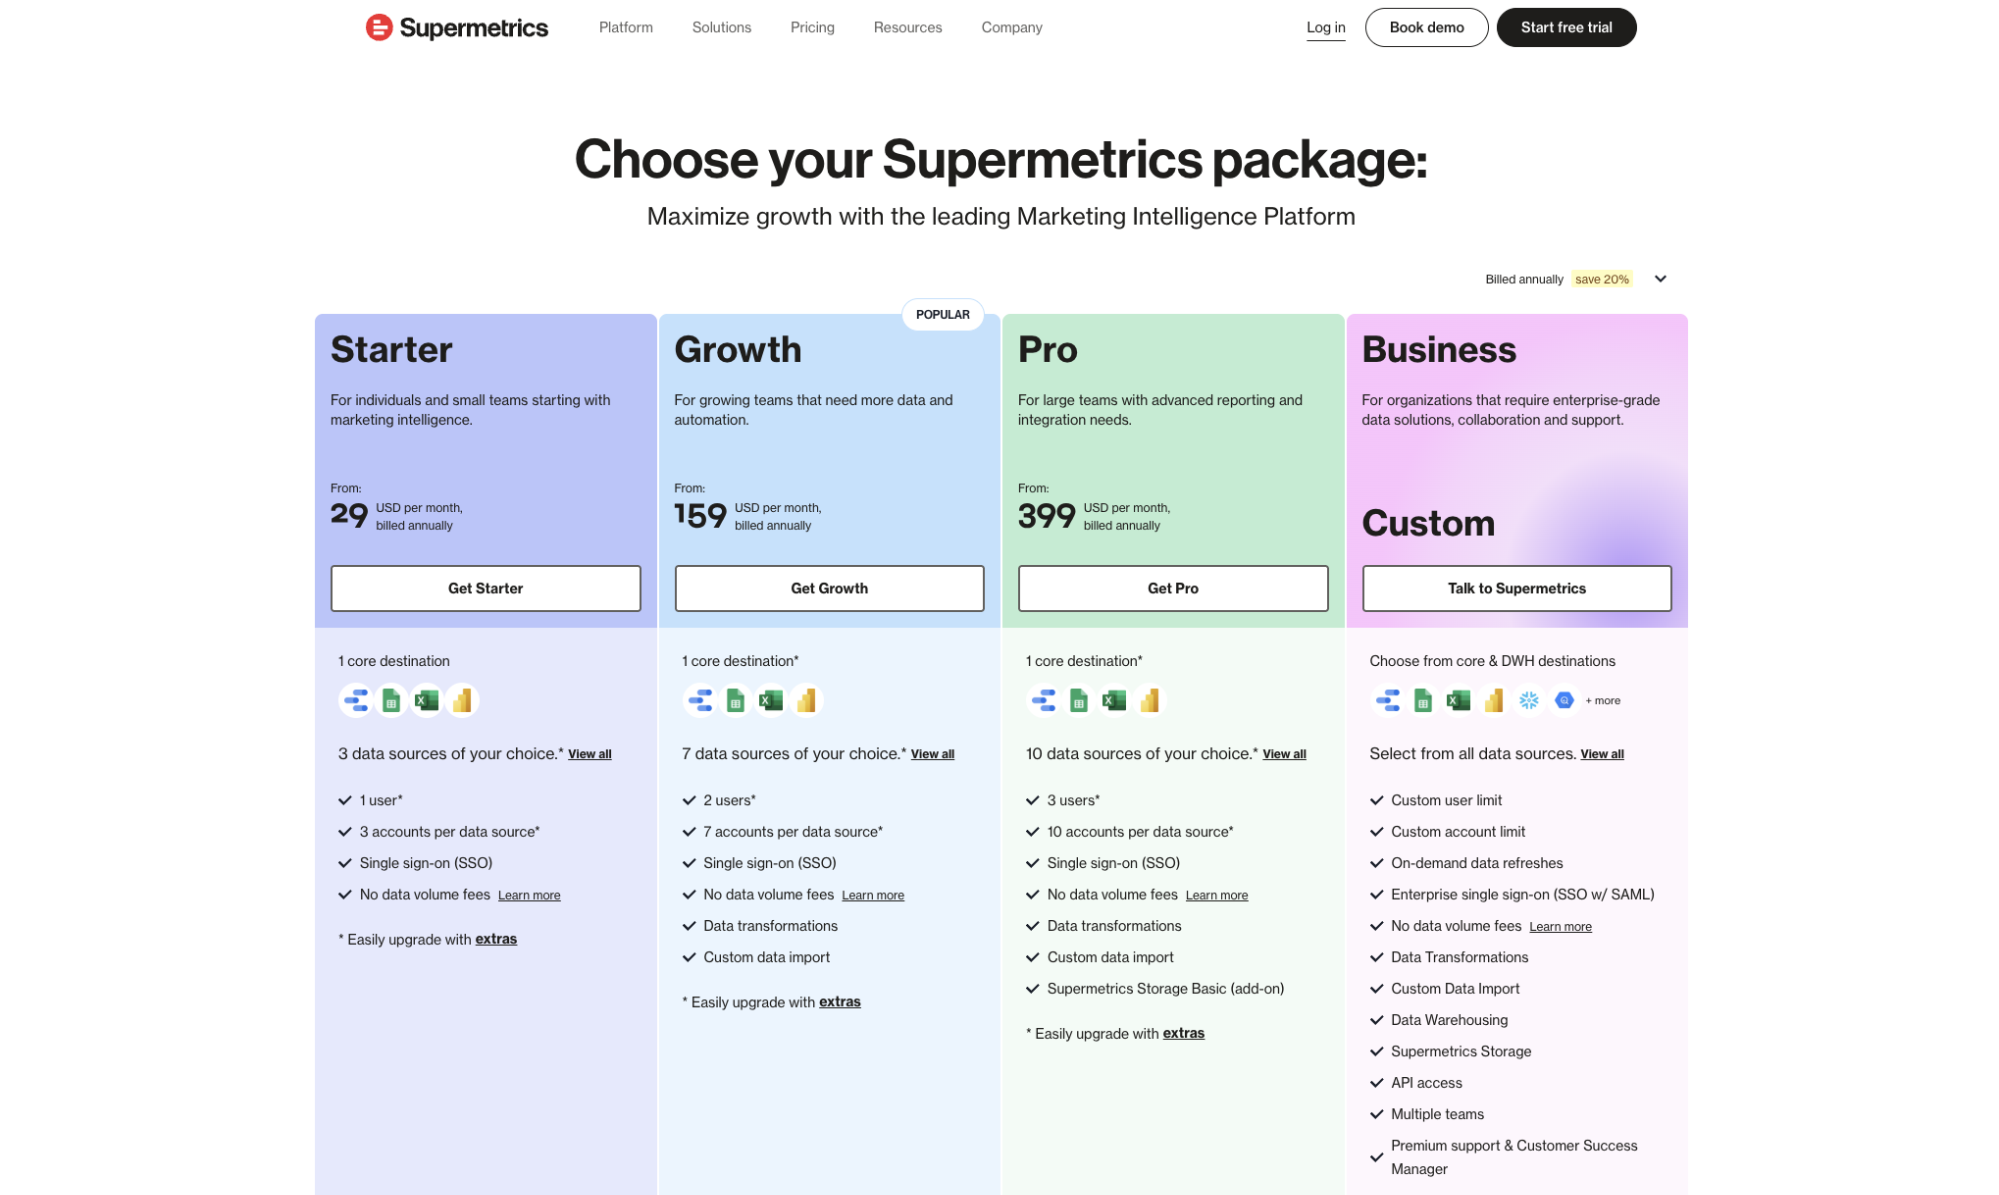 This à la carte model means you’re not paying for what you don’t use – which is great in theory. But in reality, it’s easy to underestimate how many sources or destinations your team actually needs.
You can get a more detailed breakdown of this model in this Supermetrics pricing guide.
Here’s an example. Let’s say you want to pull Facebook Ads, Google Analytics 4, and LinkedIn Ads data into both Google Sheets and Looker Studio for 3 users.
You’ll likely need:
- 3 connectors (one for each platform)
- 2 destinations
- A license that supports 3 users
Even on Supermetrics' entry-level plan, this setup could put you into custom pricing territory, especially if you want scheduled refreshes, higher row limits, or enterprise support.
Supermetrics’ base plans start around $69/month…but that’s usually for one data source and one destination, used by one person. Want to pull multiple platforms or share access with your team? That’s when things scale up fast.
And if you want access to premium sources like TikTok Ads or Amazon Ads, those come with additional fees.
You’ll also run into some frustrating usage ceilings:
- Row limits based on plan tier
- Refresh frequency restrictions (e.g. hourly vs. daily)
- Team collaboration and support tiers gated behind higher pricing
It’s hard to get a predictable monthly cost without talking to sales – and even harder to scale if you’re reporting across multiple clients or business units.
Is Supermetrics Worth It?
The age old answer – it depends.
If your team has the technical know-how, clear reporting workflows, and an existing BI stack like BigQuery or Power BI, Supermetrics can be a solid fit.
It does one job – moving marketing data from platform to platform – and it does it well when everything is set up correctly.
You get access to 100+ integrations, can customize your queries down to the dimension, and automate refreshes on your terms. For some enterprise setups, that level of flexibility is exactly what’s needed.
But for most marketing teams and agencies, the reality looks different.
You’ll need to stack Supermetrics with other tools to create dashboards or send reports.
You’ll need to manage connectors that occasionally break.
You’ll deal with a modular pricing system that makes scaling complicated.
And you’ll probably spend more time than expected troubleshooting errors or reformatting data to “fit” downstream tools.
That’s where the real cost creeps in – not just in dollars, but in time and maintenance.
So is Supermetrics worth it? If all you need is a raw data pipeline and you’ve got the resources to manage it, sure.
But if you’re looking for a more seamless way to collect, visualize, and share marketing data without needing a second platform (or a developer), there are better options, like Whatagraph which is built for marketers, not data scientists.
Published on Mar 01 2023
WRITTEN BY
YamonYamon is a Senior Content Marketing Manager at Whatagraph. With an eye for detail and a knack for always considering context, audience, and business goals to guide the narrative, she's on a mission to create genuinely helpful content for marketers. When she’s not working, she’s hiking, meditating, or practicing yoga.