The Perfect Data Visualization Dashboard for Agencies
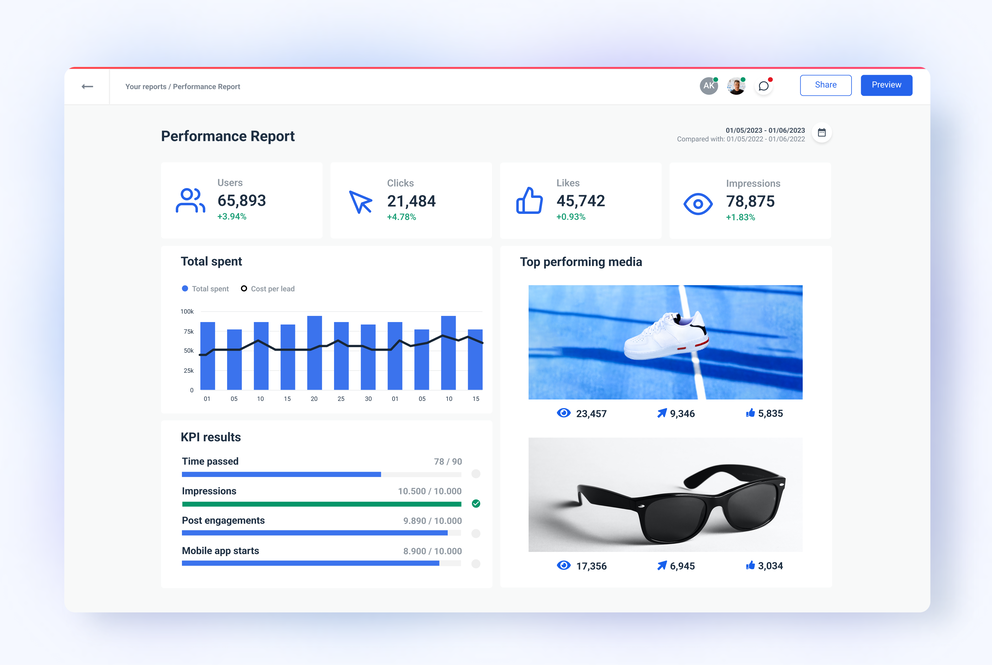
Try Whatagraph’s data visualization dashboard and show your clients’ results in a visual way that is easy to understand. Don’t spend any more time on data analytics than you need. Identify trends and make more informed decisions for your clients’ marketing campaigns. Use graphs, charts, maps, tables, and other widgets to effortlessly track live data and performance metrics.


What is a data visualization dashboard?
Dashboards for data visualization are tools that summarize and present different but related data sets in a way your clients can understand. Dashboards often use different visualization elements like graphs, charts, or tables to break up complex data into metrics that are easier to read.
Build data visualization dashboards & make data easier to understand
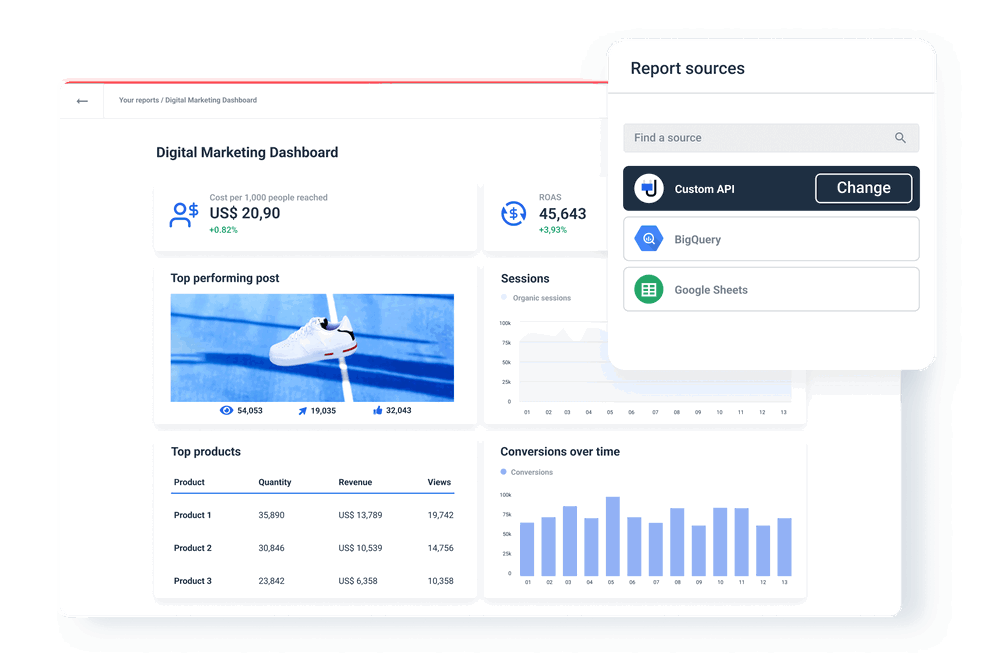
Connect your tools & visualize all your KPIs in a beautiful dashboard
Monitor the effectiveness of your cross-channel marketing campaigns from one place. Create your custom data visualization dashboard with all the marketing KPIs and turn numbers into stunning visual insights. Natively integrate more than 45 marketing tools, including Google Analytics 4, social media, paid ads, SEO, email marketing, eCommerce, and CRM platforms. Connect any data source you have using a Custom API, Google Sheets, or BigQuery data warehouse.
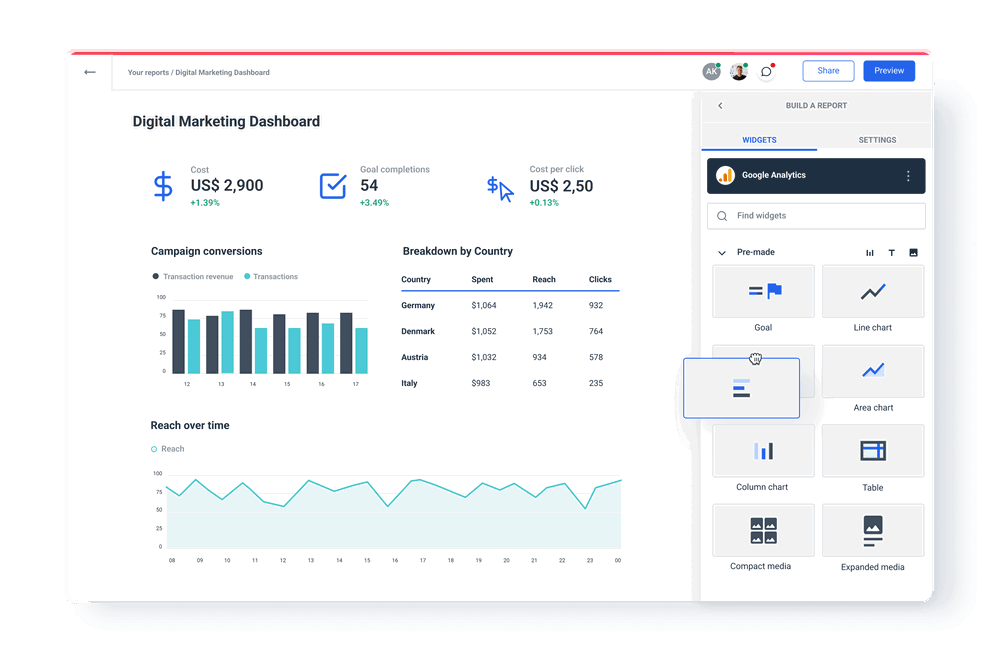
Use Whatagraph’s pre-made dashboards
Whatagraph allows marketing agencies to quickly generate detailed visual data insights. We have a library of pre-made dashboard templates to make your work easier. Use our pre-made dashboards right out of the box or customize them to your client's specifications. Want to build a brand new dashboard from scratch? Drag and drop everything you need from the toolbar onto a blank page. Combine insights from multiple sources in one table, graph, or chart. Create custom metrics, edit existing widgets, and save the new ones you create as widget templates. Build a perfect dashboard design in under 5 minutes and automate its distribution to your clients.
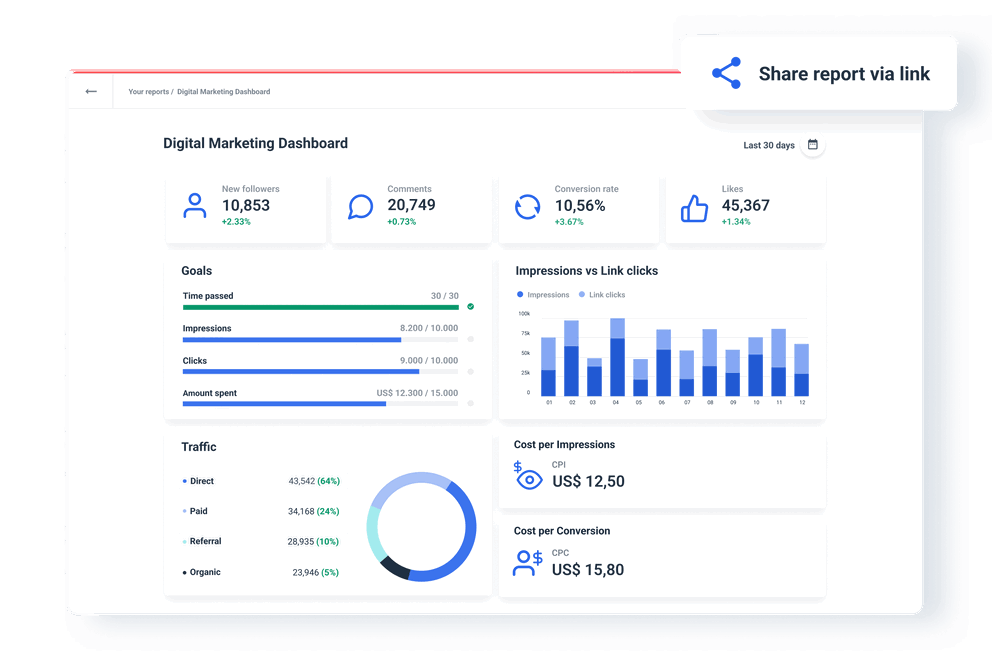
Live links for on-demand access
Take a look at the current status of your marketing performance with our real-time data visualization tools. Whatagraph allows you to share a live link for direct on-demand access. This way, your client can check their marketing metrics whenever they want and make instant business decisions.
Check out some of our dashboard examples to choose from


Frequently Asked Questions
What is data visualization?
Data visualization is the graphical representation of data through visual elements like charts, graphs, tables, infographics, dashboards, and data visualization tools.
How do you visualize data in a dashboard?
You visualize data in a dashboard by combining numbers, charts, graphs, and other visual elements grouped in such a way as to bring focus to metrics that matter the most.
Which tool is best for data visualization?
The best data visualization tool is one that is simple and easy to use, supports various visualization styles for different types of data, can drill down into big data, and has sharing automation and competitive pricing plans.
Whatagraph also allows you to easily connect sources, visualize data points, and share the results from the same page.
If you need a data visualization tool that supports machine learning and has business intelligence features, you can also consider Tableau and Power BI.
If you are on a budget and mainly use Google-based marketing tools, a self-service tool like Looker Studio can help you
What is the purpose of using dashboards for data visualization?
A data visualization dashboard is a tool used by marketing agencies to illustrate data and better communicate with clients. A dashboard can transform massive amounts of raw data into something more actionable and insightful that clients can actually understand.
Pie charts, bar charts, graphs, images, and maps are some of the most common ways to visualize datasets – it's all about making complex numbers understandable and improving decision-making.
While in the past marketers struggled with Excel spreadsheets, now you can use Whatagraph to run data analysis in a few clicks and present your clients with interactive visualizations of their data.
You don’t need a team of data analysts to show your campaign results anymore — just the best data visualization tool out there, Whatagraph.
What is the difference between data visualization and a dashboard?
Data visualization gives a detailed report of the information as a whole, while a dashboard provides a summary of that information. Data visualization is a larger set, and a dashboard is a snapshot of the most critical metrics.
It’s good to be loved! Our clients are not shy about expressing it.
I made a switch from GDS and Sheets for reporting to Whatagraph, and I am saving literal hours each week on performance report creation. Our small firm actually managed to onboard 2 new clients as a result of all the time we saved on managing data and reporting. The customer service is also really helpful and easy to reach.

Capterra verified review by
Mindaugas S., Marketing Consultant
Having active customer support to help fix any issues was a big contributor, but we also really liked the ability to save templates and connect sources to multiple charts/widgets at once without having to edit them individually. And having the grid layout is much easier to stay consistent with than the free form setup that Data Studio has.

Capterra verified review by
Nico T., Media Planner
The system has standard templates that are easy and fast to use. Also you can build your own report with lightning speed. It is very easy to use, has a lot of integration, and let get started very fast.

Capterra verified review by
Rasmus Bernt K., External Senior Management Consultant
We love Whatagraph - we would definitely recommend and our account manager is great! I love how easy this tool is to use, everyone on the team finds it much more user-friendly than other dashboards. Integration was easy, we sent some example reports to the team who duplicated these for us. We literally had to log in and send it to our clients!

Capterra verified review by
Stephanie S., Digital Director
We are showing our clients the work that we're doing for them and this is incredibly important for our clients ROI. They want to see results and having a tool like Whatagraph that can show data from virtually every source we use is hugely important.

Capterra verified review by
John S., SEO Strategist
The tool is easy to use; you do not need to have development resources. Even my junior project managers are capable of making campaign reports in minutes. There are a lot of pre-made templates you can use as well as many pre-made widgets.

Capterra verified review by
Erman E., Marketing Specialist
Really easy to connect data sources within the tool. The library of report templates has been helpful. The customer support team has been responsive to all of our needs. Our team enjoys the simplicity of setting up the reports and how the data is presented.

Capterra verified review by
Brent N., Director of Operations
Easy to create really beautiful graphs and reports which can help other team members to understand the most important takeaways. I especially like the automated report function, so I don't have to check on the same thing repeatedly.

Capterra verified review by
Orsolya S., Online Marketing Manager