Reddit Connector
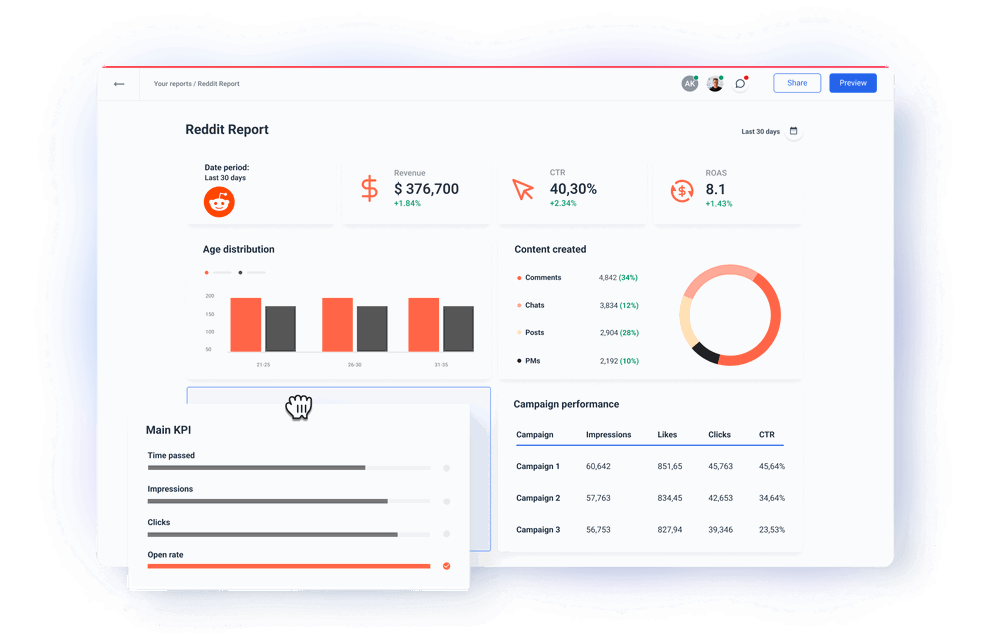
Looking for an easy way to report on your Reddit campaigns? Try our no-code Reddit connector.
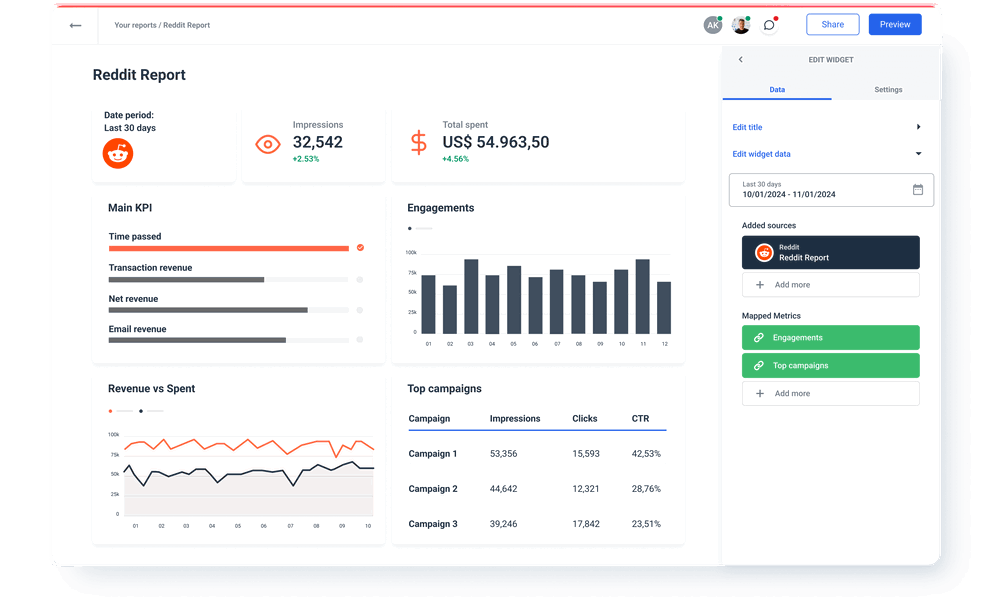
See all your key metrics on one dashboard and stay on top of your campaigns.
Share white-labeled reports with clients or the C-Suite. No third-party tools needed.


All-in-One Marketing Data Platform for Reddit Data

Pull all Reddit Metrics into your Reports and Dashboards


Reddit metrics available instantly in Whatagraph
Reddit (Account)
10Reddit (Subreddit)
5Reddit (Post)
9Search...

Total Karma

Comment karma

Link karma

Coins

Subreddit Subscribers

Friends

Awarder Karma

Awardee Karma

Inbox Count

Gold Earned
Save Time on Monitoring and Reporting


Frequently Asked Questions
How easy is it to connect to Reddit on Whatagraph?
It’s super easy, thanks to our home-built Reddit integration. You don’t need any coding skills or third-party connectors to set up. In just a few clicks, you can connect your or your client’s Reddit account and that’s it.
Do I need Looker Studio to visualize my Reddit data?
No, you don’t need Looker Studio to visualize your Reddit data. Whatagraph is an all-in-one marketing data platform to connect, organize, visualize, and share all your data.
If you use two or three tools to get your data from sources to reports, you should definitely consider switching to a platform that does it all.
Having one platform to connect, organize, visualize, and share insights from your marketing data saves time and allows faster decision-making.
However, having options is even better. If you want, you can share organized Reddit data with Looker Studio or any BI tool you want.
How can I create custom reports using data from Reddit sources?
Creating custom reports with Reddit data is easy if you use Whatagraph.
- Once you connect your Reddit account, you get the pre-made metric widgets you can drag and drop to your report page.
- This way, you can present only those data points that you want to see. Apart from all metrics available from the Reddit API, you can also create new metrics using simple formulas.
- You can also use our customizable goal widget to show the completion of the KPI goals you agree with your client.
- To make sure your clients understand what specific data means for their business, you can add custom text boxes with comments or next steps for each graph, table, or chart.
- If you choose to add data from other channels, you can also organize your reports using tabs for easier navigation.
- Finally, when you customize the content of your report, you can just as easily customize the looks.
- You can completely remove any mention of the Whatagraph brand and use your or your client’s logo and colors instead. You can even host the reports on a custom domain.
What metrics should I highlight on my Reddit report?
The specific metrics will depend on each client or your internal needs, but those that you shouldn’t leave out are:
Post Impressions: The number of times a post was displayed to users on Reddit. This metric helps you assess how well your content is exposed to Reddit’s audience.
Upvotes: This metric is Reddit’s version of a “like” and shows users’ approval. A high number of upvotes can lead to greater visibility on Reddit due to its ranking algorithm.
Downvotes: The opposite of upvotes. Tracking downvotes helps you understand when content might not be resonating with the audience so you can adjust future posts.
Upvote Ratio: The percentage of upvotes vs. total votes (upvotes and downvotes). This metric helps you better understand how well-received your content is overall.
Comments: The number of comments shows how much the content sparks conversation. Monitoring comments also gives you insight into audience opinions and feedback.
Comment Sentiment (Positive, Negative, Neutral): Analyzing the sentiment of comments shows you the community’s response to your content beyond upvotes and downvotes.
Shares (Crossposts): The metric that shows how often users shared your content in other subreddits. It helps you see how relevant your content is beyond its original context.
Engagement Rate: Calculated by dividing total interactions (upvotes, downvotes, comments, shares) by impressions. This metric gives an overall picture of how engaging your content is relative to its reach.
Subreddit-Specific Performance: Performance by subreddit shows which communities engage most with your content. It helps you tailor content strategies for specific audiences.
Top Engaged Users (if available): Identifying top engaged users shows which community members are most interested in your brand or content. You can use this insight to build relationships with advocates and influencers, boosting your reach within Reddit’s community.
Daily Engagement Trends: Tracking when engagement is highest throughout the day or week can help you optimize posting schedules to reach users when they’re most active.
User Mentions and Brand Keywords: Monitoring mentions of your brand or product keywords in comments gives you a glimpse into brand awareness and audience sentiment. This can reveal organic discussions about your brand or products, offering valuable feedback and opportunities for engagement.
Conversion Metrics (if applicable): If your posts have conversion goals, tracking conversions lets you measure the post’s effectiveness in driving specific actions.
Can I blend Reddit data with other data?
Yes, you can blend Reddit data with other data on Whatagraph. And the best part is…you don’t need any coding or data science knowledge to do it.
You can easily blend data sources together or create custom metrics and dimensions using a simple calculator on Whatagraph.


