Shopify Integration
Upgrade how you manage your online store data insights with our fully managed Shopify integration and user-friendly reports your clients will love to explore. Connect your Shopify store metrics and leverage Whatagraph’s superior visualization to identify trends and influence data-driven decisions. Blend and organize your Shopify data to get insights faster. Combine Shopify metrics with data from your paid media or web analytics tools. Automate the way you report to your clients or stakeholders.
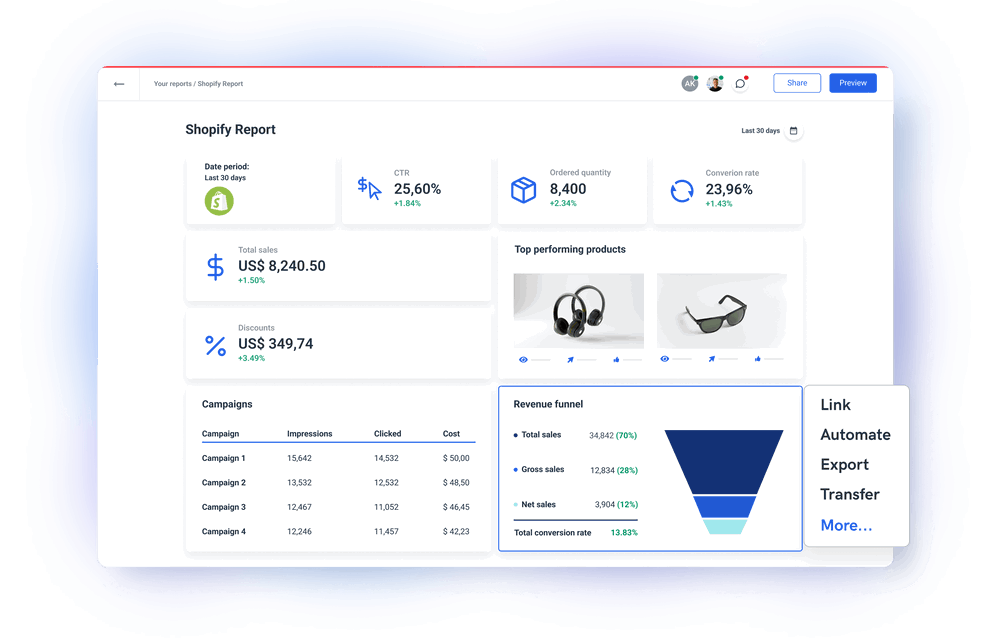


Manage all your Shopify metrics via a direct connector to Shopify API

Blend your Shopify metrics with conversion data from other marketing platforms
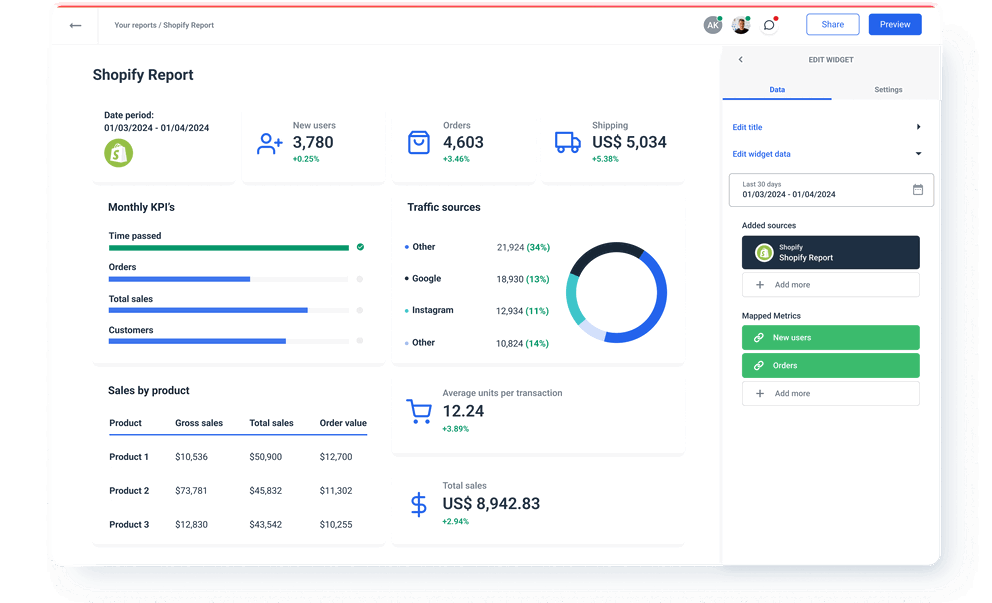
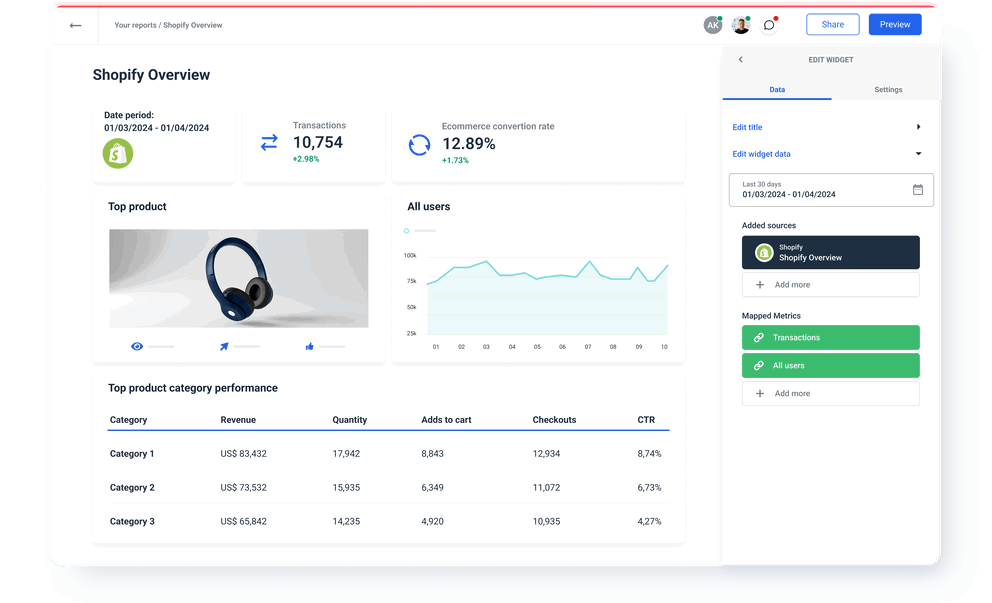
Shopify metrics available instantly in Whatagraph
All
Shopify Sales Over Time
20Shopify Abandoned Checkouts
6Shopify Payments
4Shopify Taxes
1Search...

Orders
Gross sales
Discounts
Returns
Net sales
Shipping
Tax
Total sales
Average order value
Units per transaction
Gross margin
Gross profit
Cost
Tips
Order value
Customers
Ordered quantity
Returned quantity
Net quantity
Average units ordered
Total line items price
Total price
Total tax
Subtotal price
Products count
Count
Transactions
Gross payments
Refunds
Net payments
Amount
Check out related integrations:


Explore marketing automation and custom report features


Frequently Asked Questions
What other marketing data sources can I connect with Whatagraph?
Apart from Shopify sources, you can connect a range of popular marketing platforms like Google Analytics 4, social media like Facebook Page and Instagram, SEO tools like Ahrefs and Semrush, PPC like Google Ads and Amazon Advertising, CRMs like Salesforce and HubSpot, as well as email marketing and e-commerce platforms. If you can’t find the integration for your data source, you can connect it via a Custom API or export it to Google Sheets docs or BigQuery data warehouse and add it as a source.
Do I need a separate tool to visualize Shopify data?
No, you don’t need any other tool to visualize your Shopify data. Whatagraph is an all-in-one marketing data platform to connect, organize, visualize, and share all your data. This makes Whatagraph a better choice than other data platforms that provide only the connection functionality, so users need to use a separate tool to visualize their Shopify data insights.
How to connect Shopify API to Whatagraph?
Whatagraph has a pre-built Shopify connector, so you don’t have to purchase and configure third-party data connectors. Adding a new Shopify source is simple:
1. Go to the Data Sources menu and locate Shopify among the channels.
2. Click +Add new in the Accounts column.
3. Enter the Store URL (the string from your store admin URL), and the Access Token (get it from your Shopify account settings) and click Add account.
4. The new Shopify source will appear.
You have successfully created a connection to your Shopify API. Create a custom report or dashboard and add your Shopify account as a source.
When you connect Shopify storefront data to Whatagraph, you can organize datasets to get more granular insights by regions, customer demographics, or loyalty programs. You can visualize data in various widgets and share the insights via automated email attachments or live links for near real-time access.
What Shopify metrics can I track with Whatagraph?
Whatagraph allows you to track all metrics coming from your Shopify reporting API, however, the ones you should monitor regularly include Shopify Orders, Shopify Product Listings, New Customers, Abandoned Cart Rate, Abandoned Checkout Rate, Order Fulfillment Rate, Average Order Value, Sales by Channel, New vs. Returning Customers.
Can I change the currency on dashboards from USD to EUR?
Yes, you can change the currency on dashboards from the default USD to any of the world’s currencies.
Effortlessly create reports and dashboards


What others think about Whatagraph
I made a switch from GDS and Sheets for reporting to Whatagraph, and I am saving literal hours each week on performance report creation. Our small firm actually managed to onboard 2 new clients as a result of all the time we saved on managing data and reporting. The customer service is also really helpful and easy to reach.

Capterra verified review by
Mindaugas S., Marketing Consultant
Having active customer support to help fix any issues was a big contributor, but we also really liked the ability to save templates and connect sources to multiple charts/widgets at once without having to edit them individually. And having the grid layout is much easier to stay consistent with than the free form setup that Data Studio has.

Capterra verified review by
Nico T., Media Planner
The system has standard templates that are easy and fast to use. Also you can build your own report with lightning speed. It is very easy to use, has a lot of integration, and let get started very fast.

Capterra verified review by
Rasmus Bernt K., External Senior Management Consultant
We love Whatagraph - we would definitely recommend and our account manager is great! I love how easy this tool is to use, everyone on the team finds it much more user-friendly than other dashboards. Integration was easy, we sent some example reports to the team who duplicated these for us. We literally had to log in and send it to our clients!

Capterra verified review by
Stephanie S., Digital Director
We are showing our clients the work that we're doing for them and this is incredibly important for our clients ROI. They want to see results and having a tool like Whatagraph that can show data from virtually every source we use is hugely important.

Capterra verified review by
John S., SEO Strategist
The tool is easy to use; you do not need to have development resources. Even my junior project managers are capable of making campaign reports in minutes. There are a lot of pre-made templates you can use as well as many pre-made widgets.

Capterra verified review by
Erman E., Marketing Specialist
Really easy to connect data sources within the tool. The library of report templates has been helpful. The customer support team has been responsive to all of our needs. Our team enjoys the simplicity of setting up the reports and how the data is presented.

Capterra verified review by
Brent N., Director of Operations
Easy to create really beautiful graphs and reports which can help other team members to understand the most important takeaways. I especially like the automated report function, so I don't have to check on the same thing repeatedly.

Capterra verified review by
Orsolya S., Online Marketing Manager