
What is a campaign performance report template?
A campaign performance report template is a pre-built framework that lets you track, organize, and present results across all your active marketing campaigns.
Instead of jumping between Google Ads, Meta Ads Manager, LinkedIn Campaign Manager, your email platform, and GA4 to manually piece together what's working, a campaign performance report template pulls everything into one place.
The need for this is real. According to Sprout Social's 2025 research, 63% of marketing teams are slowed down by manual tasks - with data analysis and reporting alone eating up 3.8 hours per week. That's nearly two full working days every month, per person.
A well-built campaign performance report template solves this. It should help you:
✅ Track key performance indicators across every active channel - Google Ads, Meta, LinkedIn, email, SEO, and more
✅ Break down marketing performance by campaign, channel, or date range
✅ Compare results against goals and previous periods, so context is always built in
✅ Present marketing data visually - with charts, tables, and trend lines that clients and stakeholders can actually read
✅ Share reports quickly via live links, scheduled emails, or PDF exports
Building this manually is where most teams lose time. Whatagraph cuts that out entirely by connecting directly to 60+ marketing platforms and pulling your data - no spreadsheets, no copy-pasting, no formatting from scratch.
Here's how it works:
- Connect your data sources - link Google Ads, Facebook Ads, LinkedIn, email marketing platforms, and more in minutes. Your campaign data flows in automatically.
- Organize by client or campaign - keep data clean and separate, so each report only shows what it should.
- Visualize and customize - drag-and-drop widgets, branded layouts, and cross-channel views that match your reporting needs.
- Auto-generate performance summaries - write insights directly from your live data with IQ and update them automatically when the date range changes.
- Share automatically - schedule reports to land in client inboxes, share via live links, or export to PDF. No manual sends.
And if you use Claude or ChatGPT as part of your workflow, Whatagraph's MCP connector takes this a step further.
Once connected, you can query your live campaign data in plain language - ask which campaigns are pacing behind budget, get a cross-channel performance briefing, or surface underperforming ad sets, all without opening a single dashboard.
The MCP sits on top of Whatagraph's unified data layer, so the answers Claude gives you are based on clean, normalized data - not raw API output that needs reconciling.
The result: your campaign performance report template doesn't just live in a document. It becomes something you can talk to.
What should a digital marketing report include?
A strong campaign performance report template doesn't just show numbers - it tells a clear story from the top-level summary to the channel-level detail.
This template was co-created with Chantelle Bowyer, the CEO of Metis Marketing, based on how her team actually structures campaign reporting for clients. Here's what to include in yours.
1. Insights tab
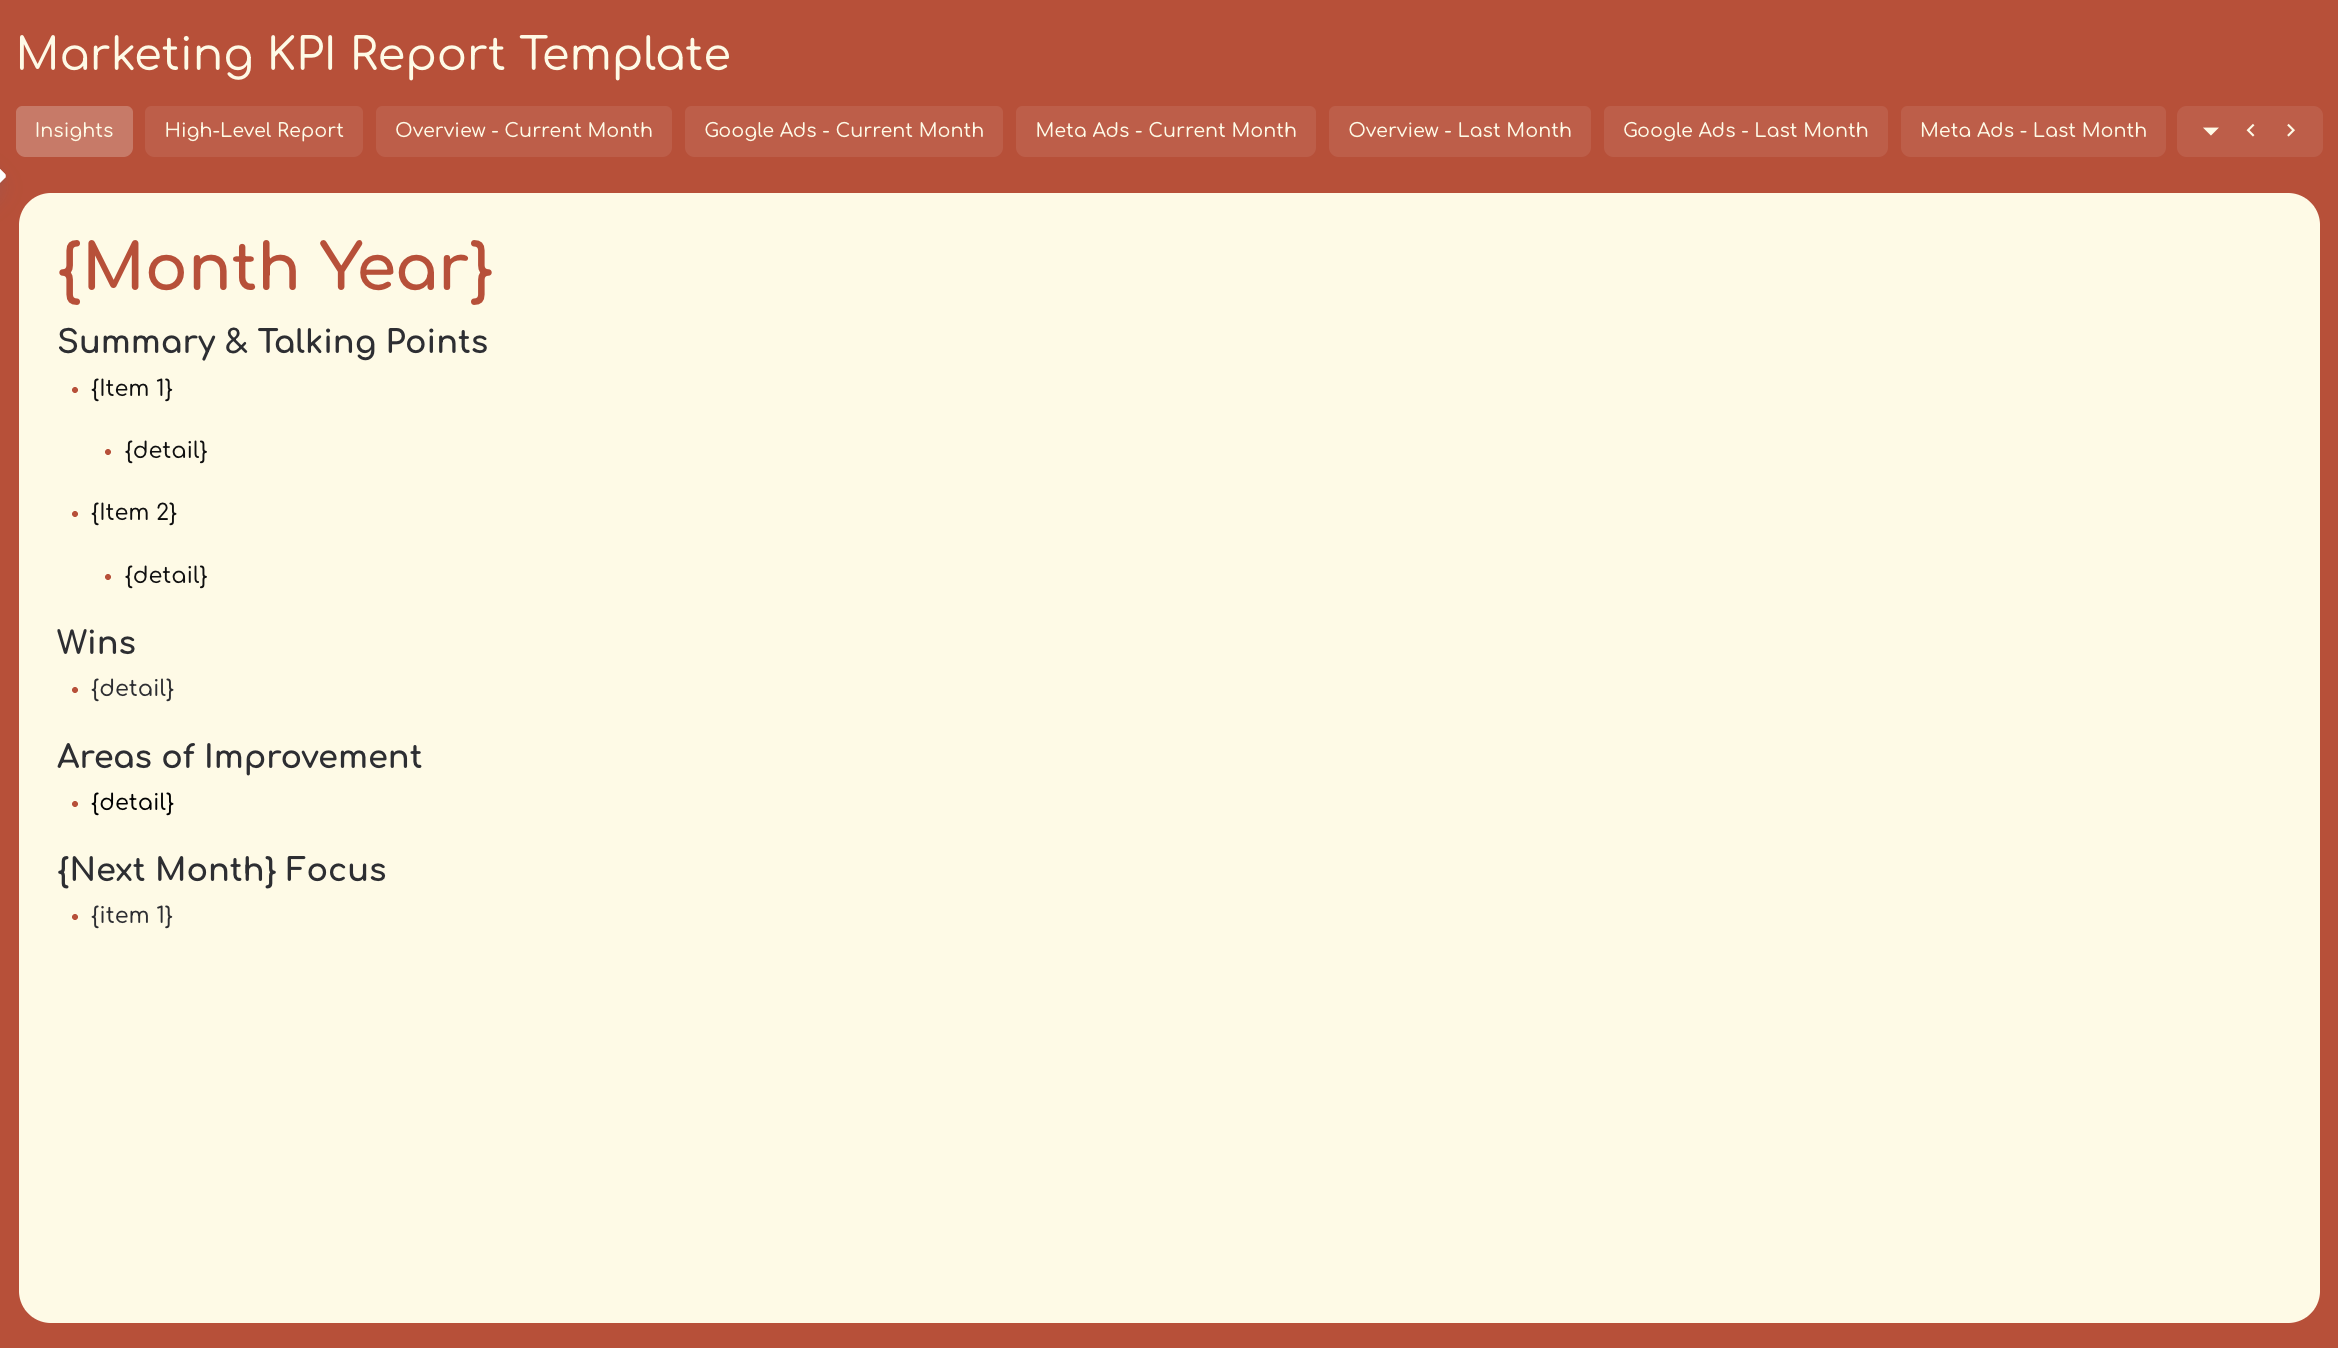
Start with a dedicated insights page that gives anyone reading the report - client, executive, or account manager - an immediate read on what happened and what comes next.
This tab should cover:
- Summary and talking points: the two or three things that define this period's performance
- Wins: what worked and why it matters
- Areas of improvement: what underperformed and what's being done about it
- Next month's focus: the priorities going into the next reporting cycle
Chantelle recommends leading every report with this tab because it sets the narrative before anyone looks at a single number. Clients read the story first, then the data - not the other way around.
With Whatagraph IQ, you don't have to write any of this manually. IQ reads your live campaign data and generates the summary, wins, issues, and recommendations automatically - in 18 languages. You can choose the output type, edit the copy to add your own context, and republish in seconds.
And if you want to go deeper before a client call, Whatagraph's MCP connector lets you query the same data through Claude or ChatGPT in plain language. A few prompts to try:
- "Summarize the key wins and issues across all sources this month"
- "Give me an executive summary of [Client Name]'s performance for the last 14 days"
- "Which campaigns improved the most week-over-week, and which declined?"
You get the same clean, governed data - just in a conversational format you can use before a call or turn into a briefing in seconds.
2. High-level KPIs
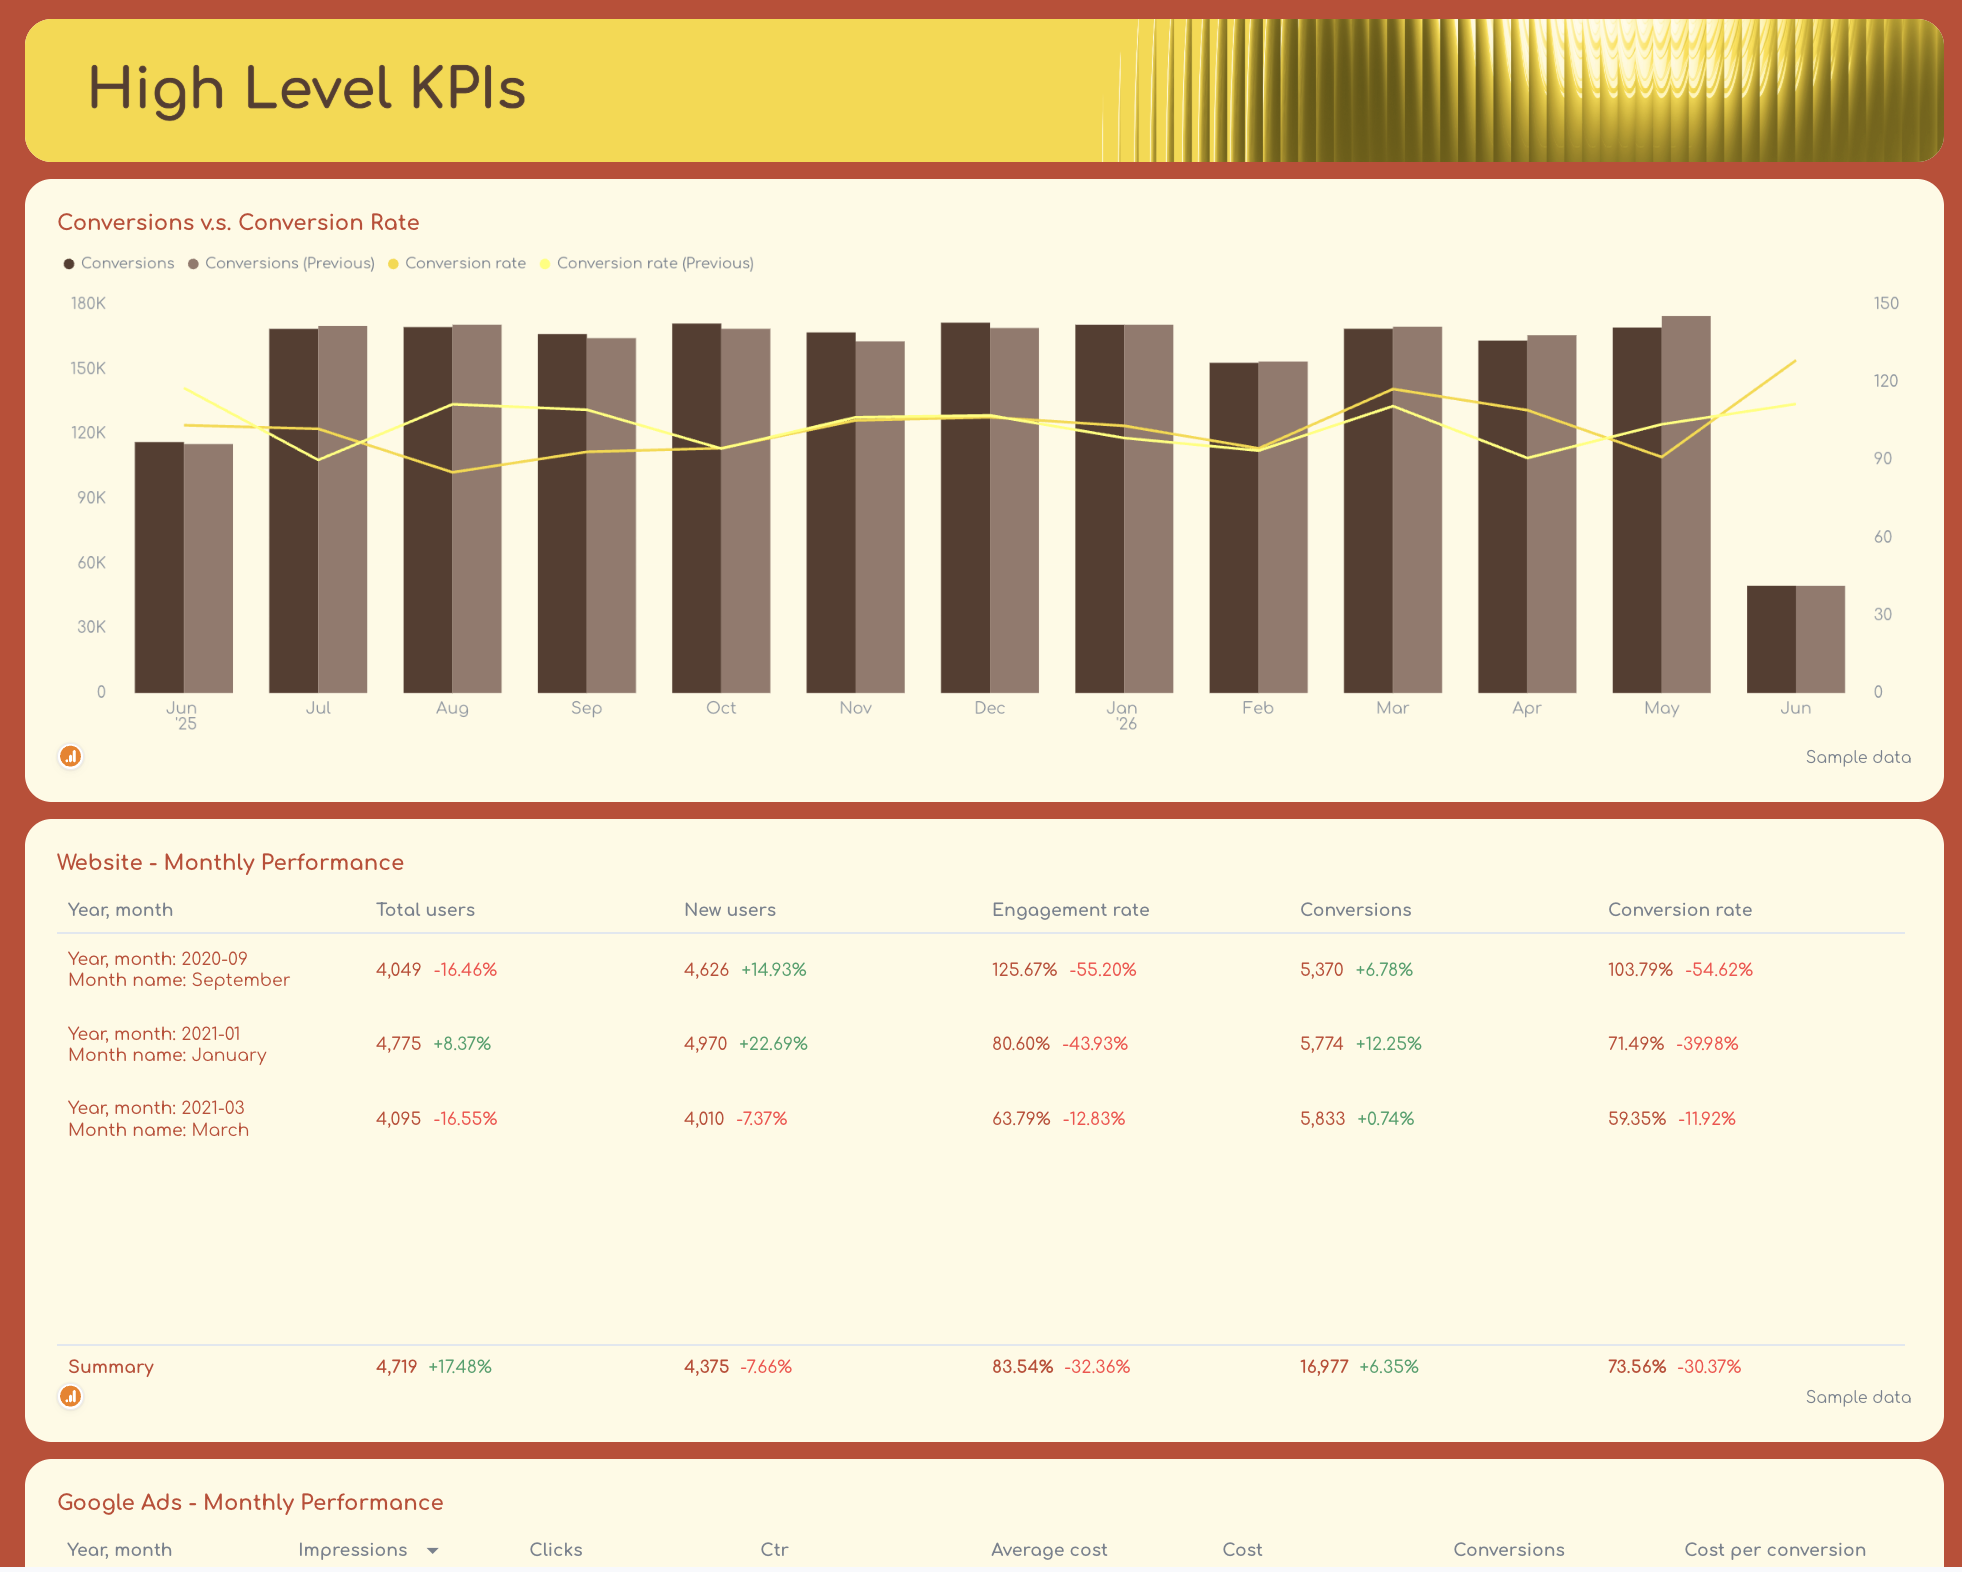
This is the view stakeholders and clients go to first. It gives a single-page read on overall marketing performance, combining website activity and paid channel results without requiring anyone to dig into individual tabs.
Include here:
- Conversions vs. conversion rate over time - a combined bar and line chart that shows volume alongside efficiency
- Website monthly performance - total users, new users, engagement rate, conversions, and conversion rate in a summary table
- Google Ads monthly performance - impressions, clicks, CTR, average cost, total cost, conversions, and cost per conversion
- Meta Ads monthly performance - amount spent, impressions, reach, clicks, post engagement, video plays, and leads
The numbers here should answer one question: are the campaigns moving in the right direction?
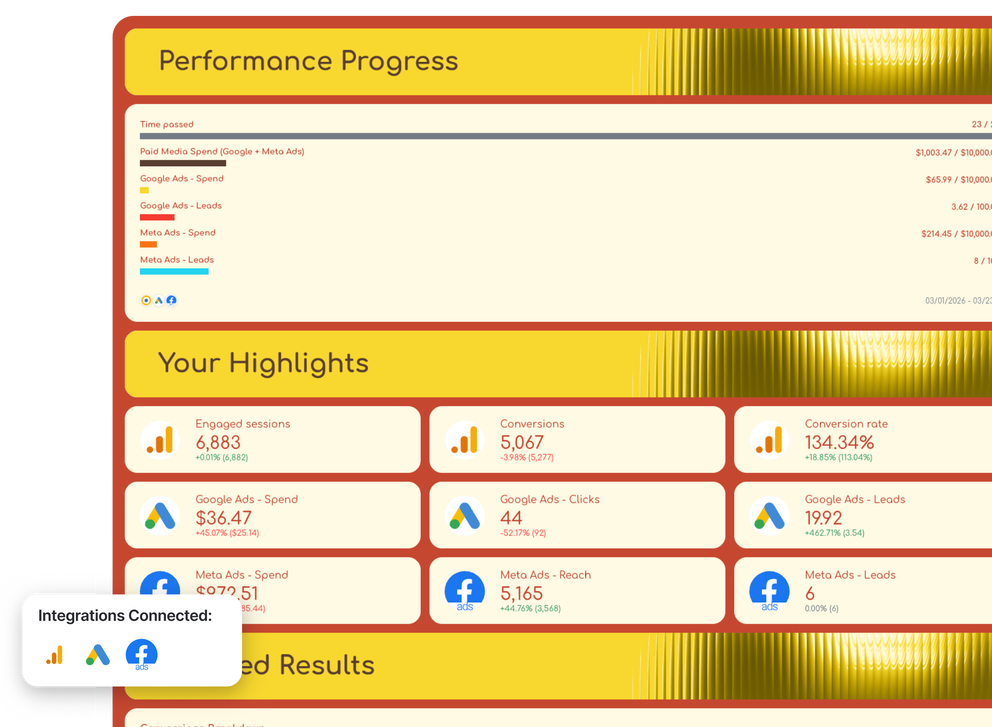
3. Overview - current month and last month
Drill into the current reporting period and the last reporting period with a more detailed breakdown of performance progress and campaign-level results.
This tab covers three areas:
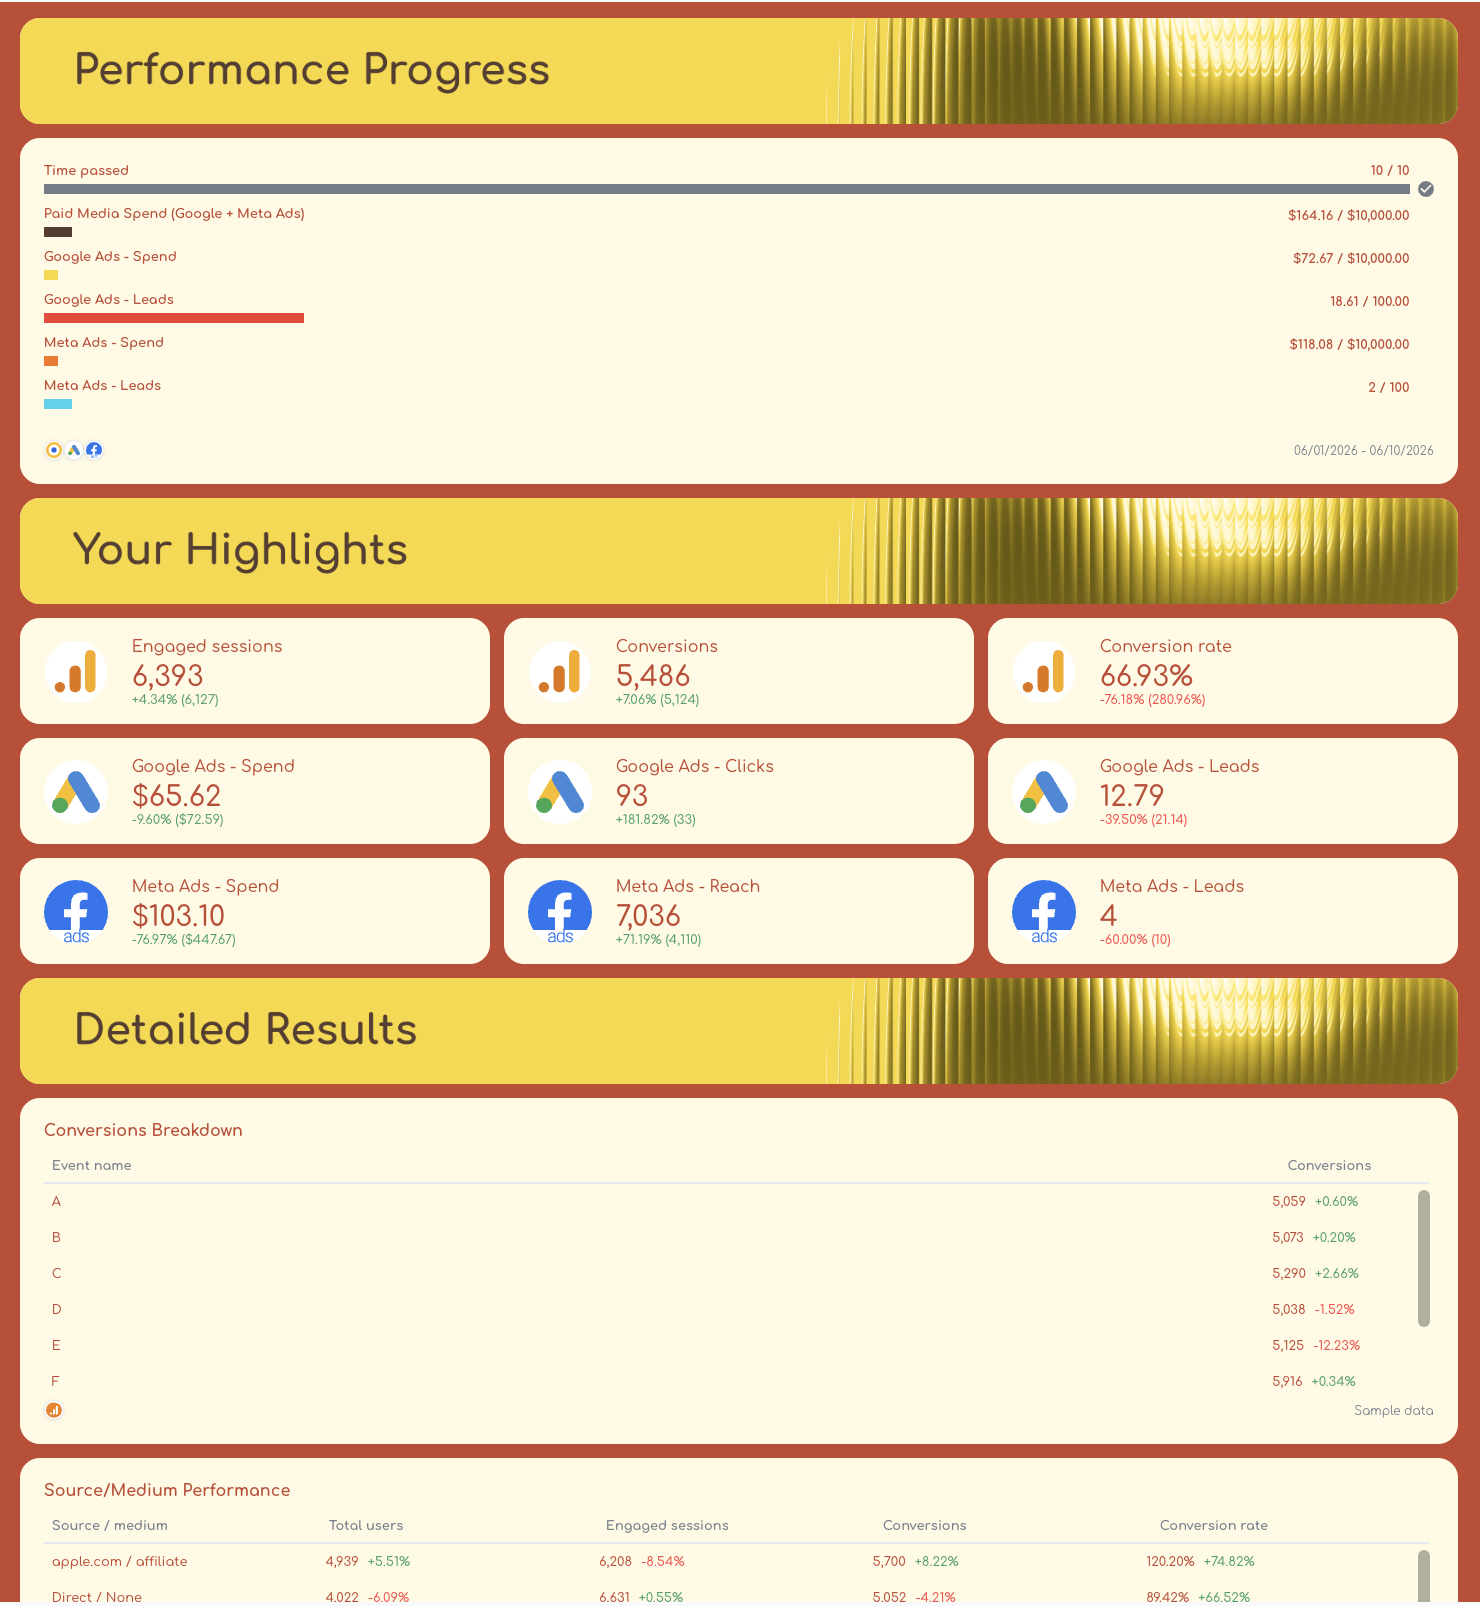
1. Performance progress - a goal widget showing where you stand against targets for paid media spend and revenue, broken down by Google Ads and Meta Ads.
2. Your highlights - key metric widgets for engaged sessions, conversions, conversion rate, and Meta Ads spend, reach, and leads. These give a fast visual snapshot of the most important numbers.
3. Detailed results - this is where the analysis lives:
- Conversions breakdown by event name
- Source/medium performance showing which channels are driving users and converting
- Landing page traffic performance - views, users, engaged sessions, and conversion rate per page
- City performance - which locations are delivering the most conversions
- Device performance - how results split across device categories and brands
This level of detail helps performance marketing teams pinpoint exactly where campaigns are working and where to optimize.
4. Google Ads breakdown
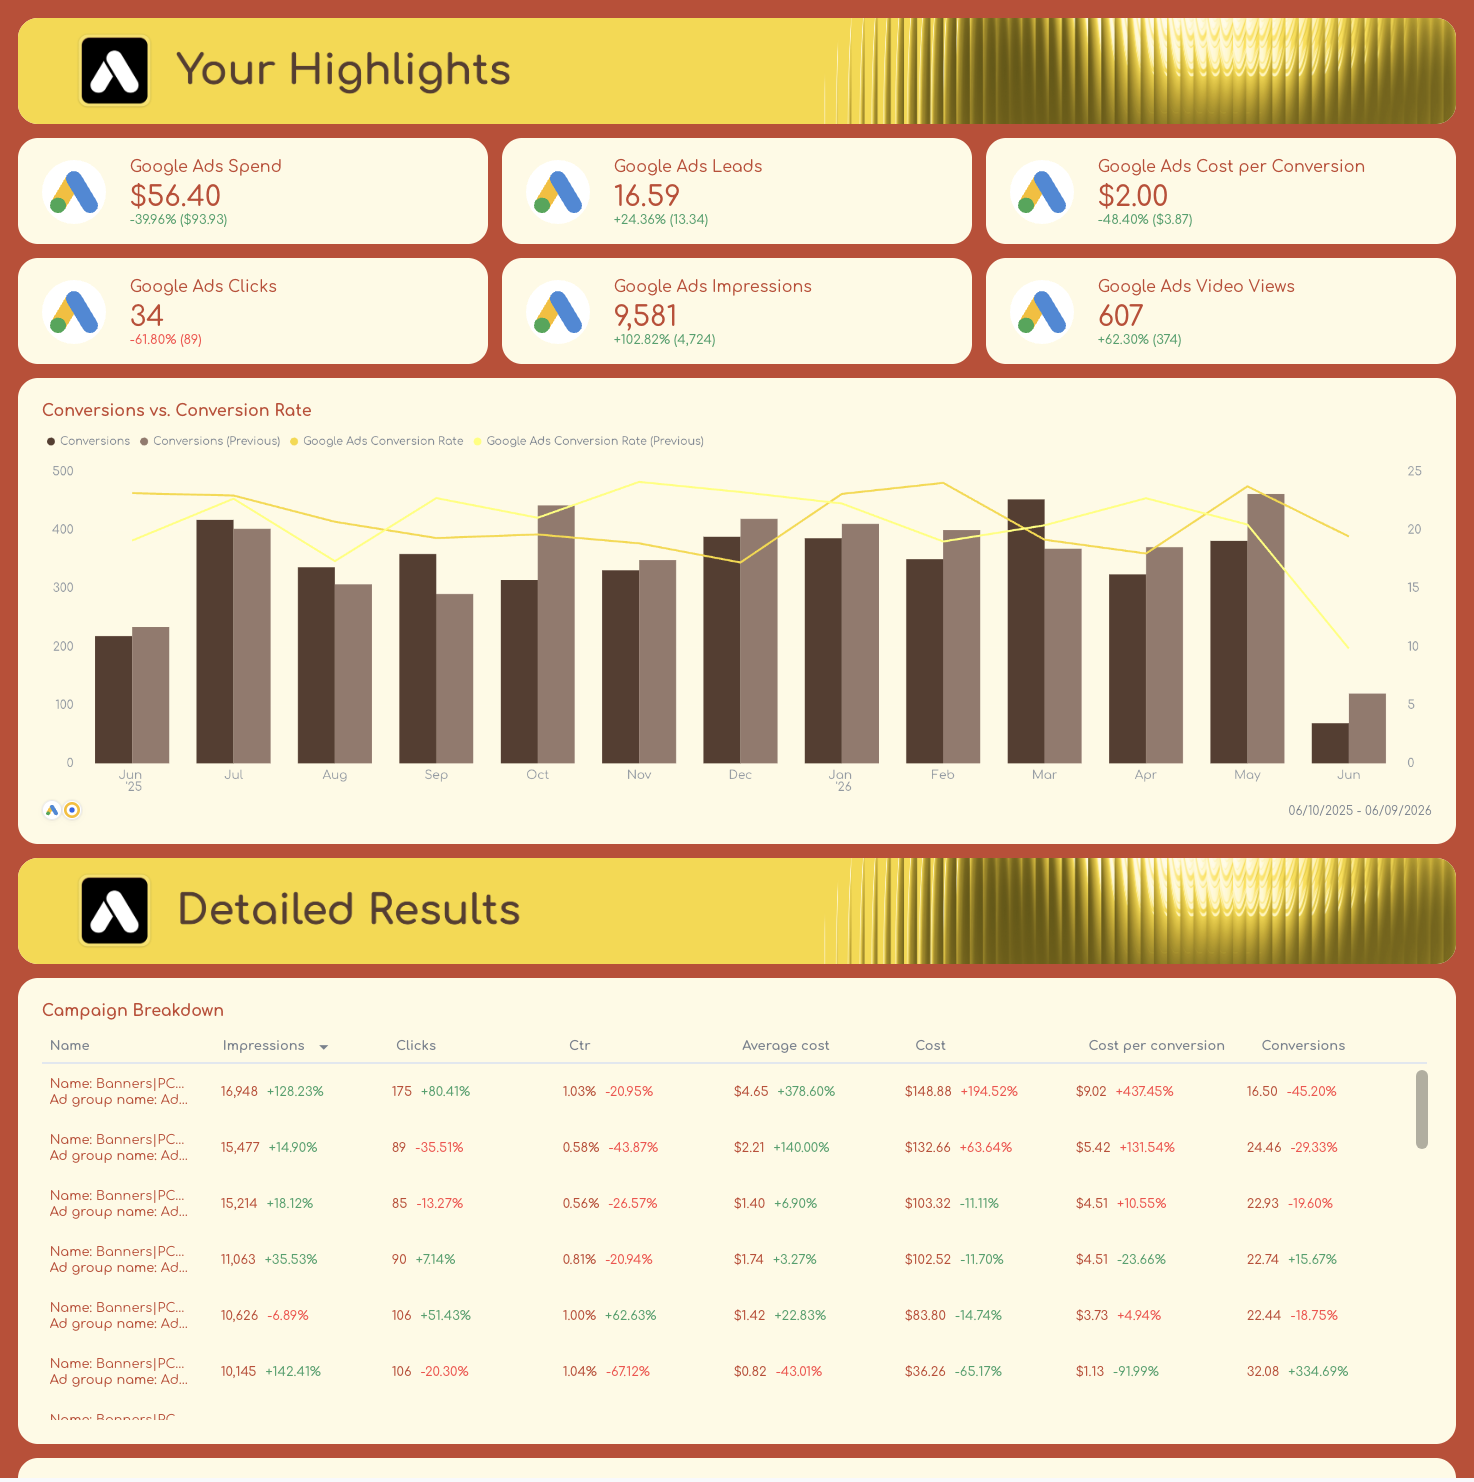
A dedicated section for Google Ads performance, with separate tabs for the current and previous month, so trends are always visible side by side.
Primary KPIs to track: spend, leads, conversions, conversion rate, and cost per conversion. These are the metrics that directly connect ad spend to business outcomes.
Secondary KPIs: impressions, clicks, CTR, average cost, and video views - useful for diagnosing what's driving or limiting the primary numbers.
Each Google Ads tab includes:
- Highlights - primary KPIs in single-value widgets at the top for quick scanning
- Conversions vs. conversion rate - a daily chart showing volume and efficiency trends together
- Campaign breakdown - a granular table with impressions, clicks, CTR, average cost, total cost, cost per conversion, and conversions per campaign
- Popular search terms (excluding brand) - keyword-level data showing where clicks and conversions are actually coming from
- Top ad creatives performance - a visual display of the best-performing ads with impressions, clicks, CTR, and conversions per creative
Creating two tabs for each channel - one for the current month to date and one for the same period year-over-year - makes it easy to separate genuine performance shifts from seasonal patterns without toggling date ranges manually.
For lead generation, Chantelle recommends using bar graphs for conversions and line charts for conversion rate, and breaking down top-performing search terms to show the real incremental reach of paid activity.
For ecommerce, her approach is to swap the focus to revenue and ROAS as primary KPIs, and use a bar graph to show conversion value by month over the past 365 days. It gives clients a longer arc to judge performance against.
5. Meta Ads breakdown
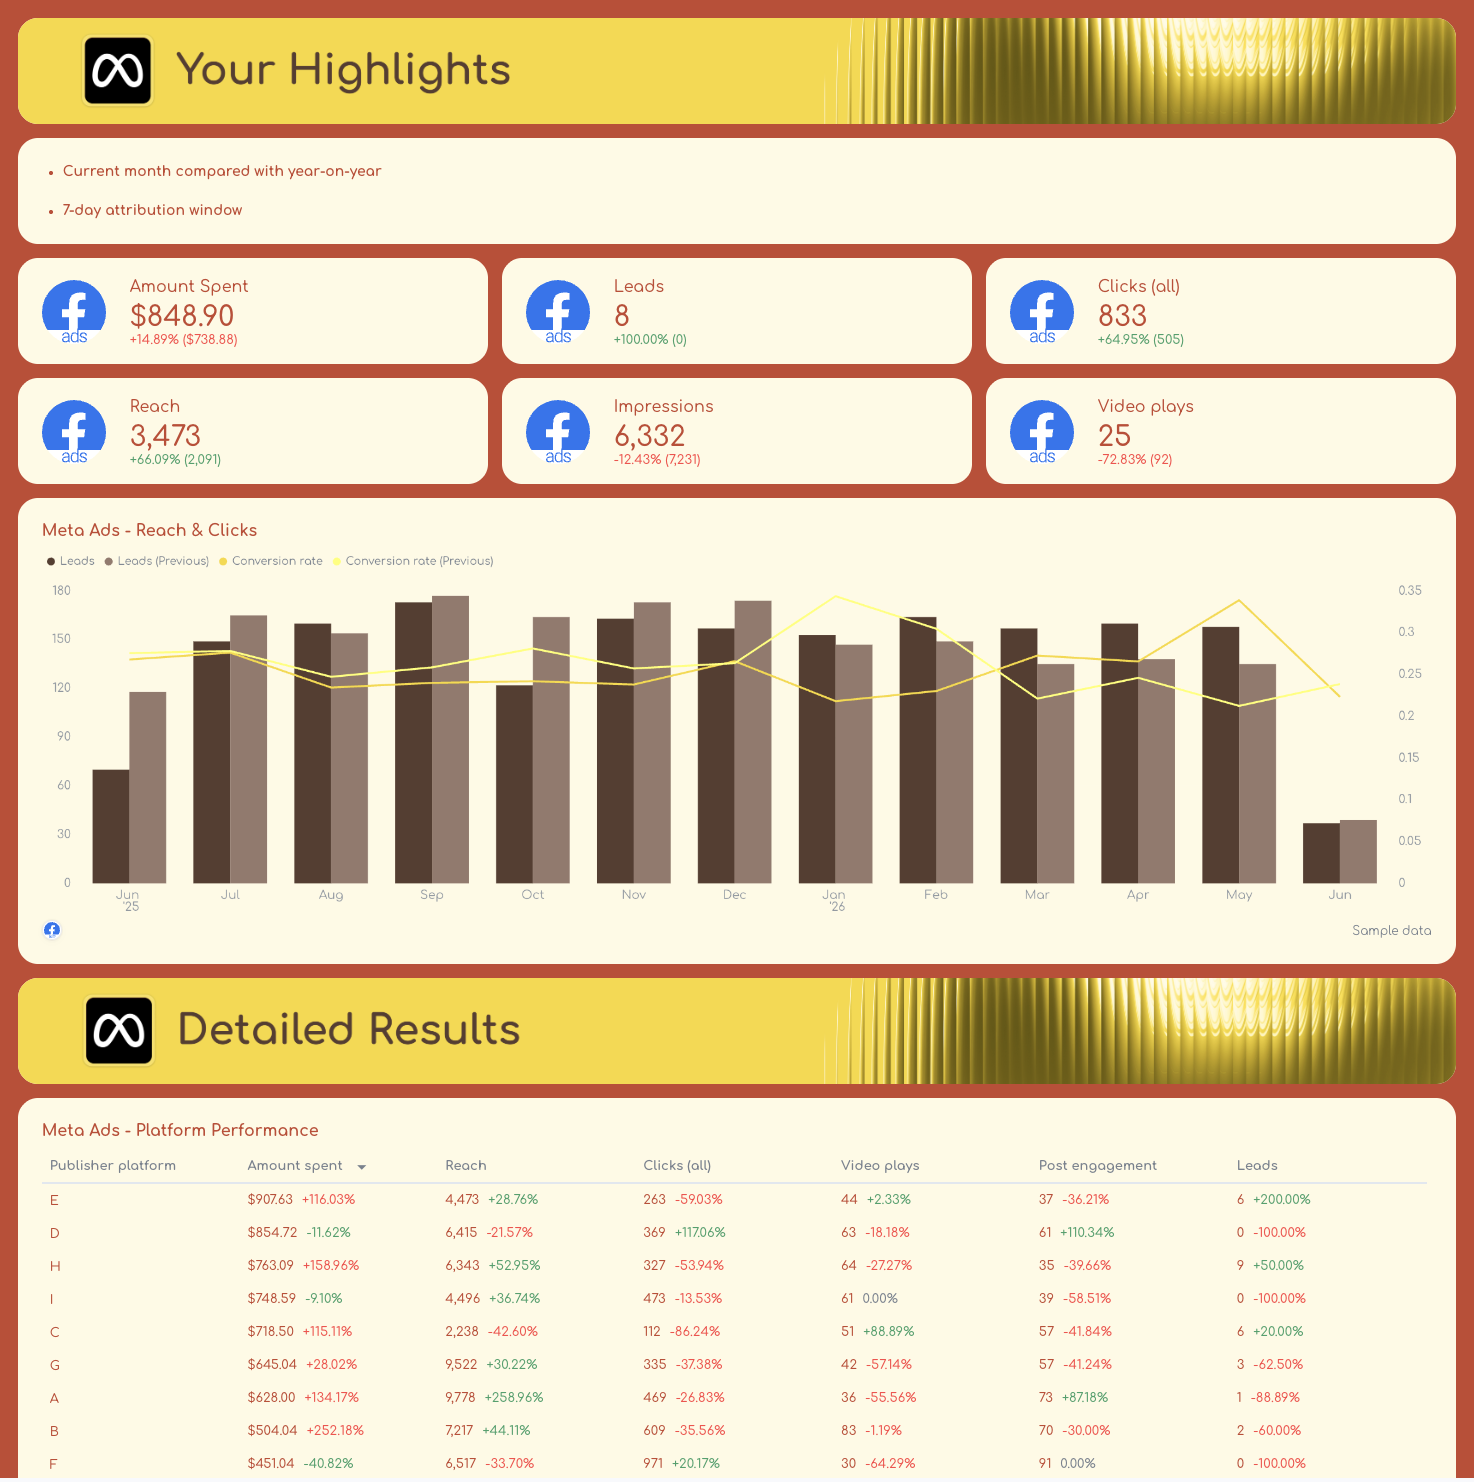
The Meta Ads tabs mirror the Google Ads structure, giving Facebook and Instagram data its own dedicated section with both current and previous month views.
Primary KPIs for lead generation: amount spent, leads, frequency, and reach. For ecommerce: purchases, purchase conversion value, total spend, revenue, and frequency.
Secondary KPIs: clicks, impressions, video plays, post engagement, and - for ecommerce - reach and messaging conversions started.
Each Meta Ads tab includes:
- Highlights - primary KPIs in single-value scorecards at the top
- Meta Ads reach and clicks - a daily chart tracking leads and conversion rate together
- Platform performance - results split by publisher platform, so you can see Facebook vs. Instagram contribution separately
- Campaign performance - a full breakdown with spend, reach, clicks, video plays, post engagement, and leads per campaign
- Top 6 ads - a carousel view of the best-performing creatives with spend, reach, frequency, and CTR per ad
On the attribution side, Chantelle's preference is a 7-day attribution window for Meta Ads reporting, with platform performance always broken down by Facebook vs. Instagram separately.
Different audiences, different creative formats, different results - adding them together hides where the budget is actually working.
What key metrics should be included in a campaign performance report template?
The right metrics depend on what the campaign is trying to achieve. A lead generation campaign and an ecommerce campaign are asking different questions - and the KPIs in your report should reflect that.
That said, there's a core set of marketing metrics that belongs in every campaign performance report.
1. Conversion metrics
These are the numbers that connect ad activity to actual business outcomes.
Everything else in the report exists to explain these.
- Conversions - the total number of completed goals, whether that's a form fill, purchase, or sign-up
- Conversion rate - the percentage of clicks or sessions that resulted in a conversion; a key indicator of how well your landing pages and messaging are working
- Cost per conversion - how much you're spending to generate each result; the primary efficiency metric for most campaigns
- Revenue (ecommerce) - total value generated from conversions; always track alongside spend to get a true picture of return
Most clients won't care about vanity metrics, such as impressions or an average position increase, but rather how the work that has been completed is driving more traffic and revenue for the business. - Henry Smith, Head of SEO, Dark Horse
2. Paid media spend and return
These metrics tell you whether the budget is being used efficiently across your ad campaigns.
- Ad spend - total spend per channel and per campaign; essential for pacing and budget tracking
- ROAS (return on ad spend) - revenue generated per dollar spent on ads; the headline profitability metric for ecommerce campaigns
- Cost per lead - for lead generation campaigns, this replaces ROAS as the primary cost efficiency metric
3. Traffic and reach metrics
These show how broadly your campaigns are landing and how much interest they're generating before the conversion happens.
- Impressions - total times your ads were shown; useful for gauging visibility and brand exposure
- Clicks - the number of users who acted on the ad; a leading indicator of interest
- Click-through rate (CTR) - clicks divided by impressions; shows how compelling your ad creative and messaging are
- Reach - the number of unique users who saw your ads; particularly important for Meta Ads, where frequency matters
- Frequency - how many times the average user sees your ad; critical for spotting ad fatigue before it drags down performance
4. Google Ads-specific metrics
For search and PPC campaigns, these metrics add the layer of context that platform-level data alone doesn't give you.
- Average cost (CPC) - what you're paying per click; helps assess bid competitiveness and keyword efficiency
- Search term performance - which queries are actually triggering your ads and converting, excluding branded terms to isolate incremental reach
- Impressions by campaign - how often each campaign appears in search results; useful for identifying scaling opportunities
For PPC, the main guiding light is cost per conversion. We'll watch click-through rate and CPM, but only care about them if we see an opportunity to improve cost per conversion by improving one of those metrics. - Brandon Rollins, Founder & CEO, Pangea Marketing Agency
5. Meta Ads-specific metrics
For Facebook and Instagram campaigns, audience and creative performance data add context that conversion numbers alone can't explain.
- Amount spent - broken down by platform (Facebook vs. Instagram) to see where the budget is going
- Video plays - for video-heavy campaigns, this shows whether the creative is stopping the scroll
- Post engagement - likes, comments, shares, and saves; signals content resonance beyond direct response
- Leads - for lead gen campaigns, tracked separately from website conversions to capture Meta's native lead forms
- Platform performance split - always break down results by Facebook vs. Instagram separately; the audiences behave differently, and lumping them together hides where the budget is actually working
6. Website and attribution metrics
These connect your paid activity to on-site behavior and help you understand what happens after the click.
- Engaged sessions - users who spent meaningful time on site, not just bounced immediately
- New vs. returning users - shows whether campaigns are reaching fresh audiences or retargeting existing ones
- Landing page conversion rate - conversions divided by landing page views; isolates the page's role in the funnel
- Source/medium performance - which traffic sources are driving the most conversions; essential for cross-channel campaign reporting
- Device performance - how results split across desktop, mobile, and tablet; informs creative format decisions
Once these metrics are set up in Whatagraph, you can go beyond the report itself.
With the MCP connector, you can ask Claude or ChatGPT to surface exactly the metrics that need attention - without opening the dashboard. A few prompts that work well here:
- "Which campaigns have a ROAS above target but are losing impression share due to budget?"
- "Find campaigns where spend has increased, but conversions have dropped compared to last month."
- "Which ad sets have a CTR below 1% right now?"
The metrics stop being a static table and become something you can actively interrogate.