Facebook Ads Dashboard Template for Marketers

Want to know how your Facebook Ads campaigns are performing?

Connect all your Facebook Ads accounts and get an instant overview of performance on one Facebook Ads dashboard template.

See key trends and make better decisions with real-time data.

Facebook Ads Dashboard Template for Marketers
Trusted by 1,000+ marketing agencies and brands around the world
Lactogal - Logo with stylized leaf-like graphic to the left of the brand name.
Wise Pirates - A gray W-shaped design and a small gray circle on a black background.
Ticketmaster - The Ticketmaster logo.
Seo Sherpa - A logo displaying mountain graphic and text "seo sherpa"
Property Guru - Image completely black.
Awestruck Logo - The word "AWESTRUCK" in a bold, dark-colored sans-serif font on a black background.
Brand Logo 7
Rentable - The Rentable logo featuring a house inside of a square to the left of the company's name.
Brand Logo 9
Brand Logo 10
Brand Logo 11
Lekker Bikes - Logo featuring a stylized tulip and the word "Lekker" in outlined letters.

A stunning Facebook Ads dashboard to easily track your campaigns

Connect your Facebook Ads accounts

Bring all your Facebook Ads data into Whatagraph in a few clicks.


No more relying on third-party data connectors. Whatagraph’s fully-managed integrations mean your data is reliable.


Plug in all the integrations you need and watch the data flow right in.

Spend less time creating Facebook advertising dashboards with premade template

Organize your data

Clean, standardize, and structure data the way you want.


Unify campaign names, metrics, currencies, and dimensions.


Create custom KPIs that match your client's goals. Combine Ads data with metrics from other channels for quick cross-channel insights.

Monitor all your Facebook Ads metrics in one premade Facebook Ads Dashboard Template

Visualize all your Facebook Ads metrics

Static reports no longer cut it.


Use our Facebook Ads report and dashboard templates to build interactive reports in under 30 minutes. 


Select from pre-made widgets, brand your reports with client logos, and add your own custom domain.

Whatagraph marketing reporting tool

Get actionable insights with AI

Tired of manually shifting through Facebook Ads Manager dashboards?


Use our AI chatbot to get real-time insights into your data.


Or, ask our AI to write performance summaries on your client’s Facebook Ads campaigns.

Whatagraph marketing reporting tool

Keep clients in the loop with automated dashboards

Share a live link to a Facebook Ads dashboard. Give clients a quick overview of their Facebook ad campaigns' performance.


Use the interactive dashboard to explore the data. 


Change date ranges and secure it with a password if necessary.

Fully automated Facebook Ads insights with Whatagraph Facebook Ads Dashboard Template

It’s good to be loved! Our clients aren't shy about expressing it.

I made a switch from GDS and Sheets for reporting to Whatagraph, and I am saving literal hours each week on performance report creation. Our small firm actually managed to onboard 2 new clients as a result of all the time we saved on managing data and reporting. The customer service is also really helpful and easy to reach.

Mindaugas S., Marketing ConsultantCapterra logo for Whatagraph review

Capterra verified review by

Mindaugas S., Marketing Consultant

Having active customer support to help fix any issues was a big contributor, but we also really liked the ability to save templates and connect sources to multiple charts/widgets at once without having to edit them individually. And having the grid layout is much easier to stay consistent with than the free form setup that Data Studio has.

Nico T., Media PlannerCapterra logo for Whatagraph review

Capterra verified review by

Nico T., Media Planner

The system has standard templates that are easy and fast to use. Also you can build your own report with lightning speed. It is very easy to use, has a lot of integration, and let get started very fast.

Rasmus Bernt K., External Senior Management ConsultantCapterra logo for Whatagraph review

Capterra verified review by

Rasmus Bernt K., External Senior Management Consultant

We love Whatagraph - we would definitely recommend and our account manager is great! I love how easy this tool is to use, everyone on the team finds it much more user-friendly than other dashboards. Integration was easy, we sent some example reports to the team who duplicated these for us. We literally had to log in and send it to our clients!

Stephanie S., Digital DirectorCapterra logo for Whatagraph review

Capterra verified review by

Stephanie S., Digital Director

We are showing our clients the work that we're doing for them and this is incredibly important for our clients ROI. They want to see results and having a tool like Whatagraph that can show data from virtually every source we use is hugely important.

John S., SEO StrategistCapterra logo for Whatagraph review

Capterra verified review by

John S., SEO Strategist

The tool is easy to use; you do not need to have development resources. Even my junior project managers are capable of making campaign reports in minutes. There are a lot of pre-made templates you can use as well as many pre-made widgets.

Erman E., Marketing SpecialistCapterra logo for Whatagraph review

Capterra verified review by

Erman E., Marketing Specialist

Really easy to connect data sources within the tool. The library of report templates has been helpful. The customer support team has been responsive to all of our needs. Our team enjoys the simplicity of setting up the reports and how the data is presented.

Brent N., Director of OperationsCapterra logo for Whatagraph review

Capterra verified review by

Brent N., Director of Operations

Easy to create really beautiful graphs and reports which can help other team members to understand the most important takeaways. I especially like the automated report function, so I don't have to check on the same thing repeatedly.

Orsolya S., Online Marketing ManagerCapterra logo for Whatagraph review

Capterra verified review by

Orsolya S., Online Marketing Manager

Holistic Facebook Ads reporting on one dashboard

Connect your Facebook Ads account and other marketing channels in a few clicks. The data flows directly to your dashboards and always matches the source platforms. No third-party connectors, no coding. 

What is a Facebook dashboard template?

Facebook Ads dashboard templates let you track your Facebook Ads performance by clicks, relevance, reach, engagement, and other key metrics.

Instead of manually searching for insights between multiple Facebook and Meta Ads dashboards, dashboard templates give you a unified view of all your campaigns.

What can Whatagraph's Facebook Ads dashboard template tell you?

With Whatagraph's Facebook Ads dashboard template, you can easily identify your best-performing ads and discover which campaigns have the highest ROI.

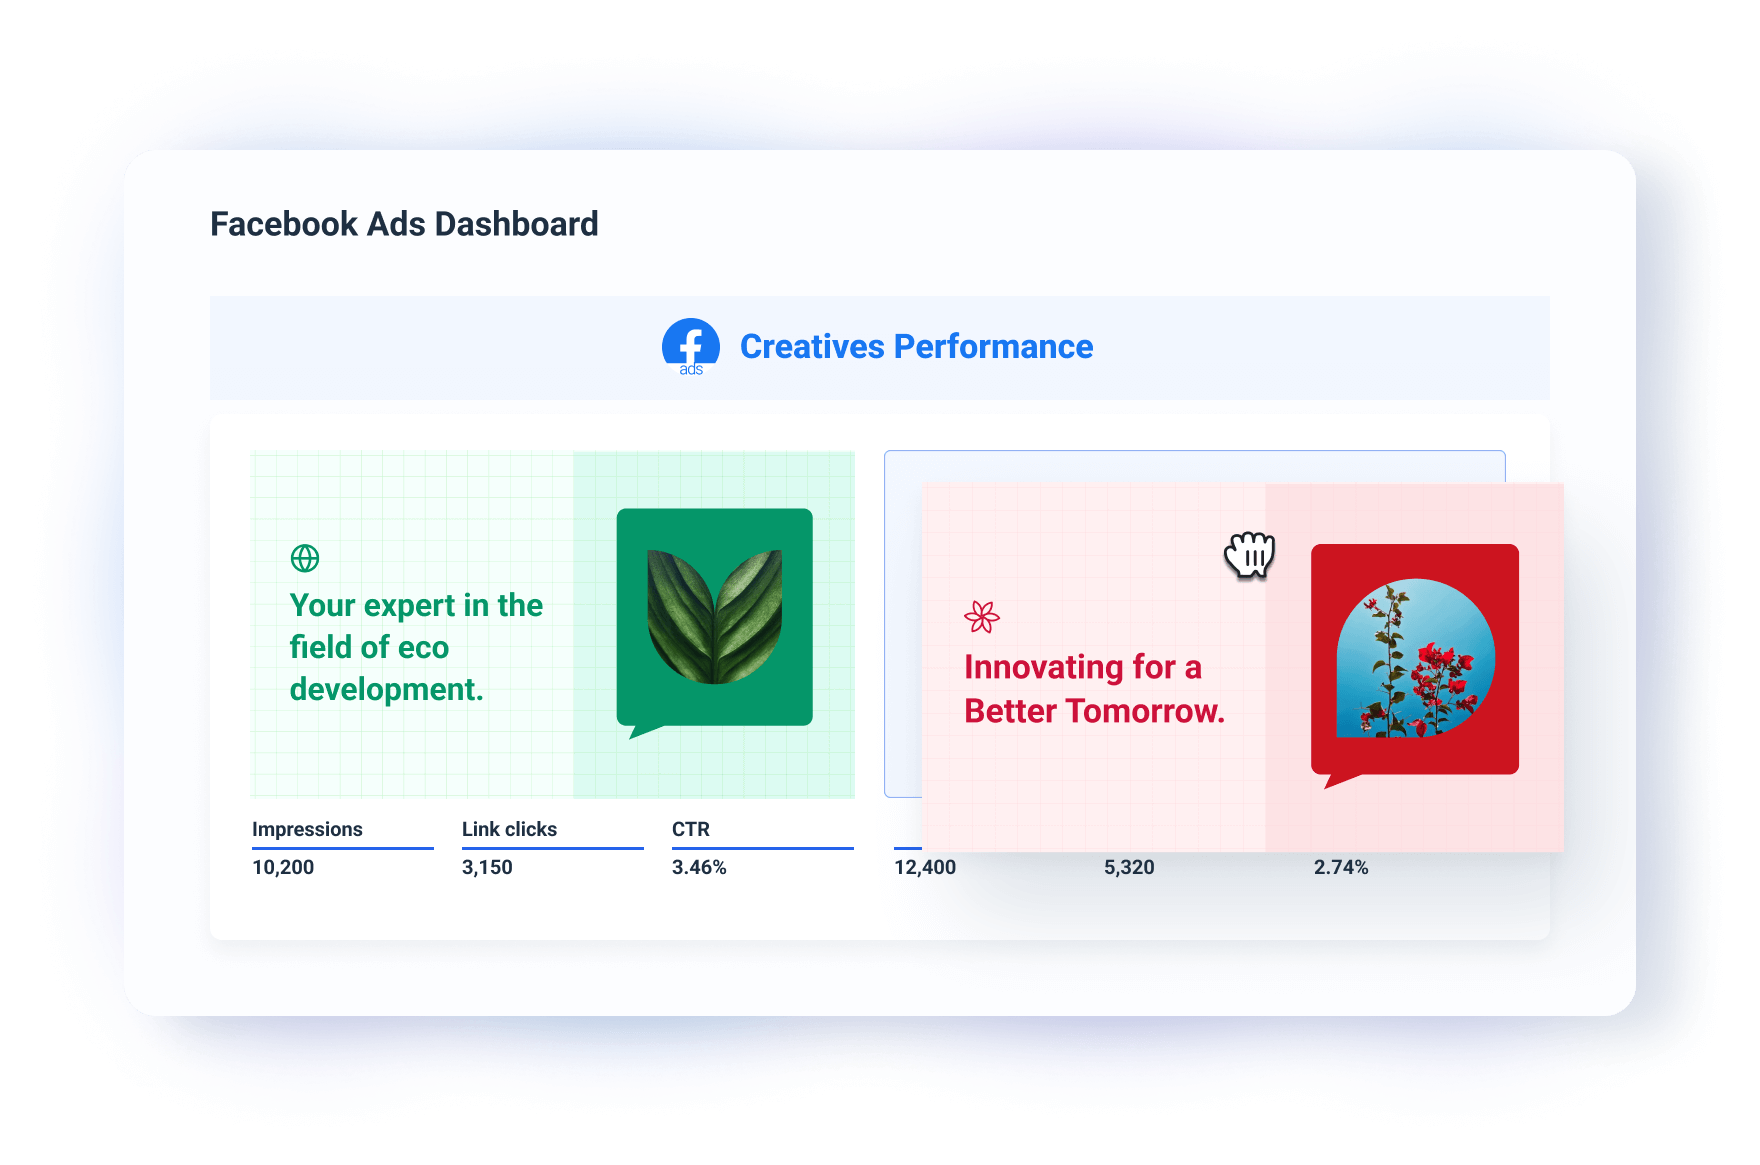
Which campaigns or ads are the highest performing

What are the top-performing ad copies and visuals? Which has a lower cost per click? Using these insights, you can make timely adjustments to underperforming campaigns.

Ad Creatives - Facebook ads dashboard showing creative performance metrics.

How many clicks your ads received

Knowing the total number of ad clicks your campaigns receive over a given time period allows you to easily single out the content that resonates best with your audience.

Goal And Funnel Widgets - Facebook Ads dashboard displaying campaign goals and funnel activity.
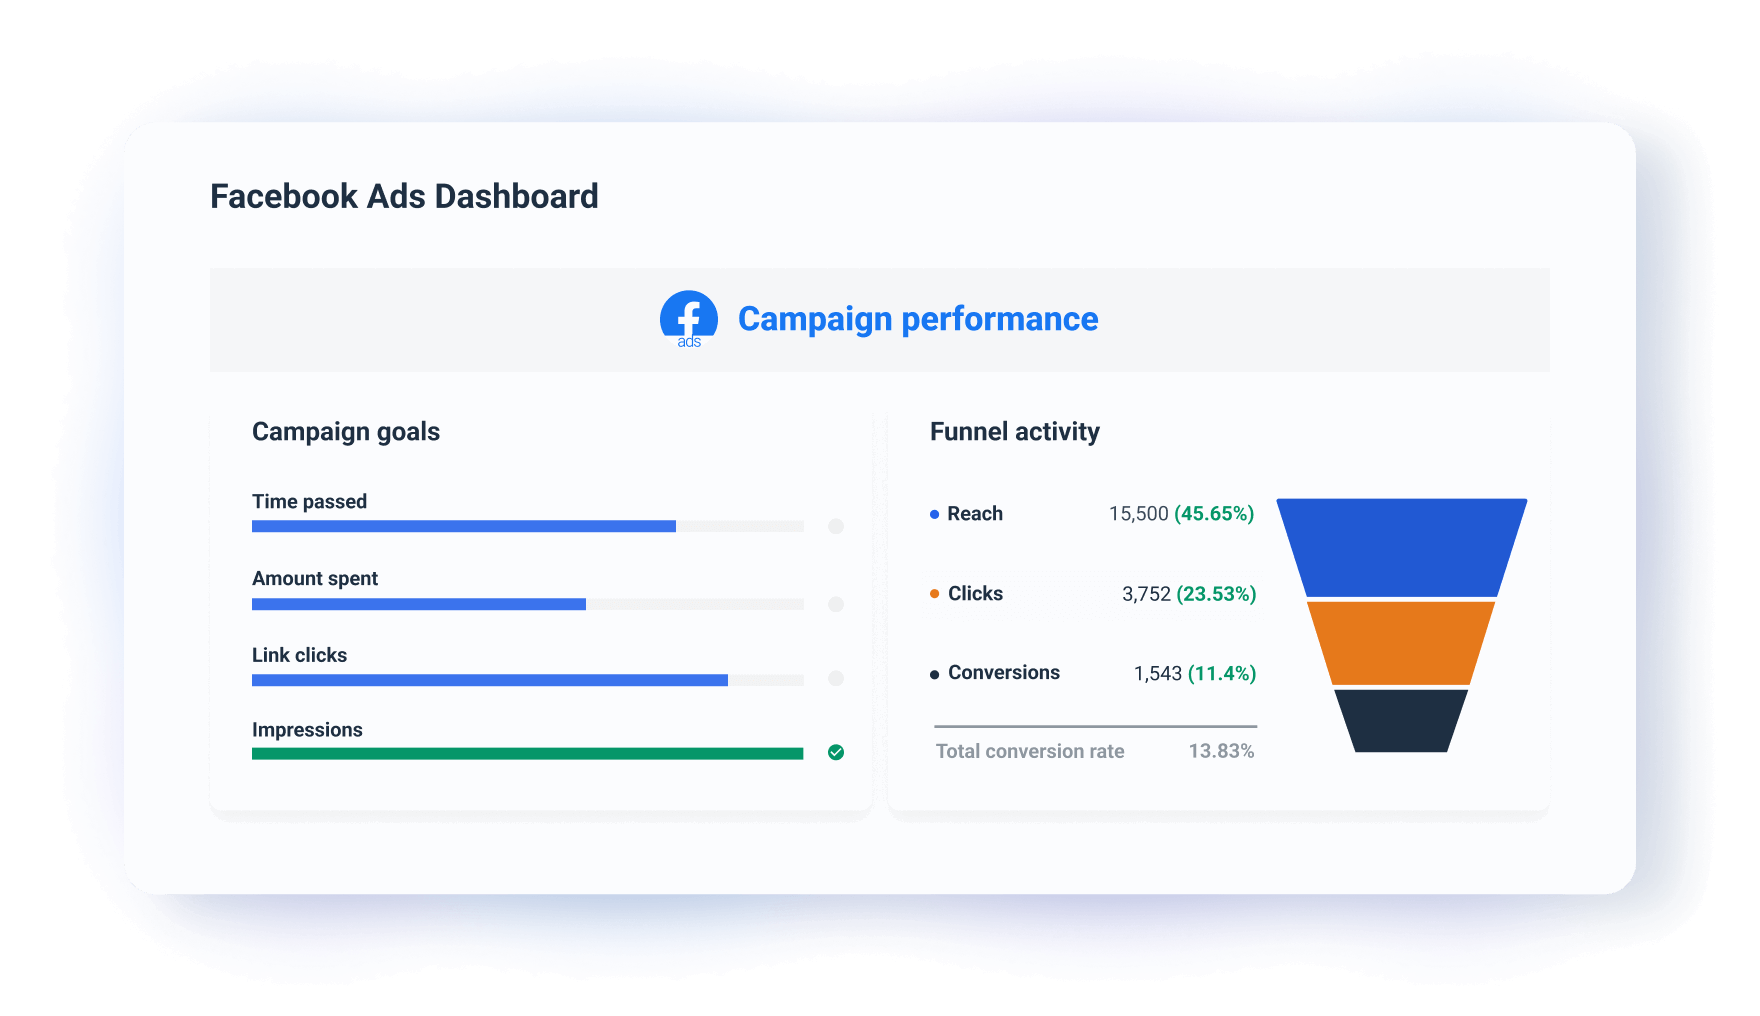
How your ad campaigns are trending daily

Monthly social media data is important for any business; however, this template allows you to track the number of engagements your Facebook advertising campaigns receive daily. This informs you that you’re on track to meeting your goals and improving over time.

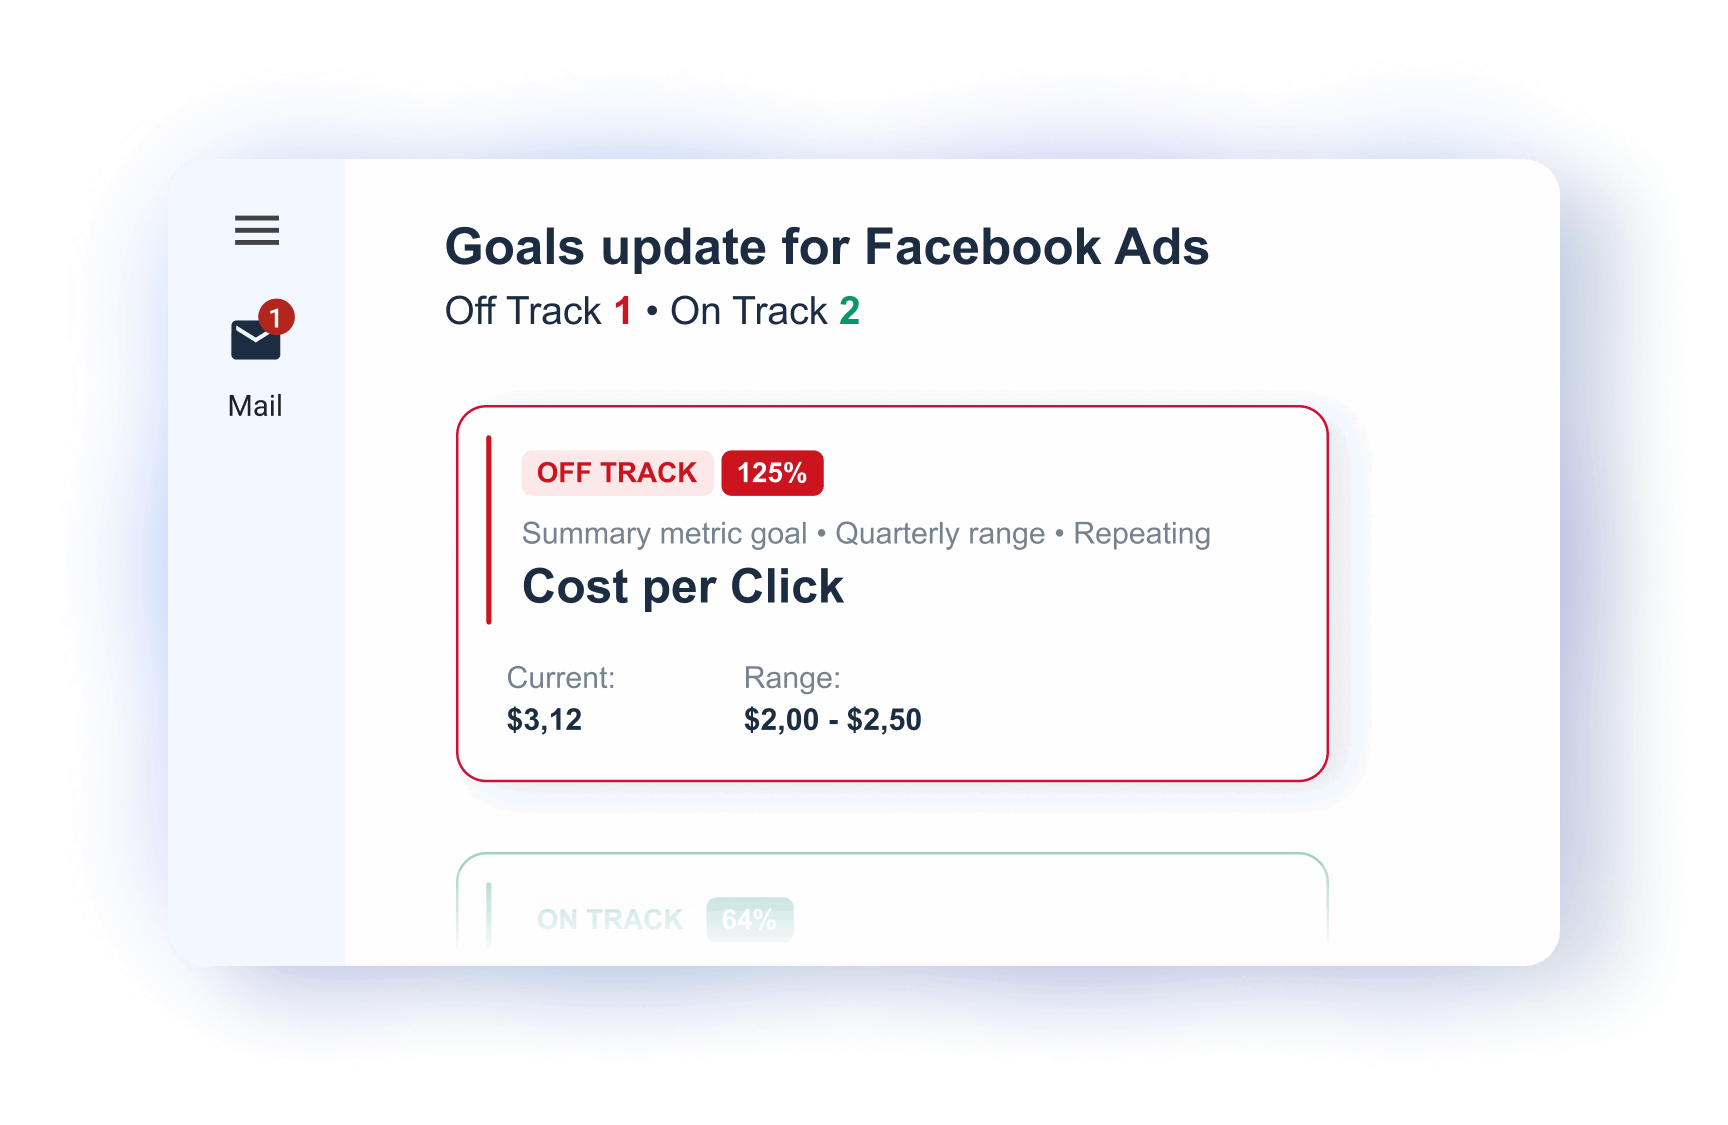
With Whatagraph, you can set performance goals for each ad campaign and get daily or weekly alerts via email, Slack, or in-app about whether they're on or off track.

Email Alerts - Interface showing Facebook Ads goals with cost per click information.

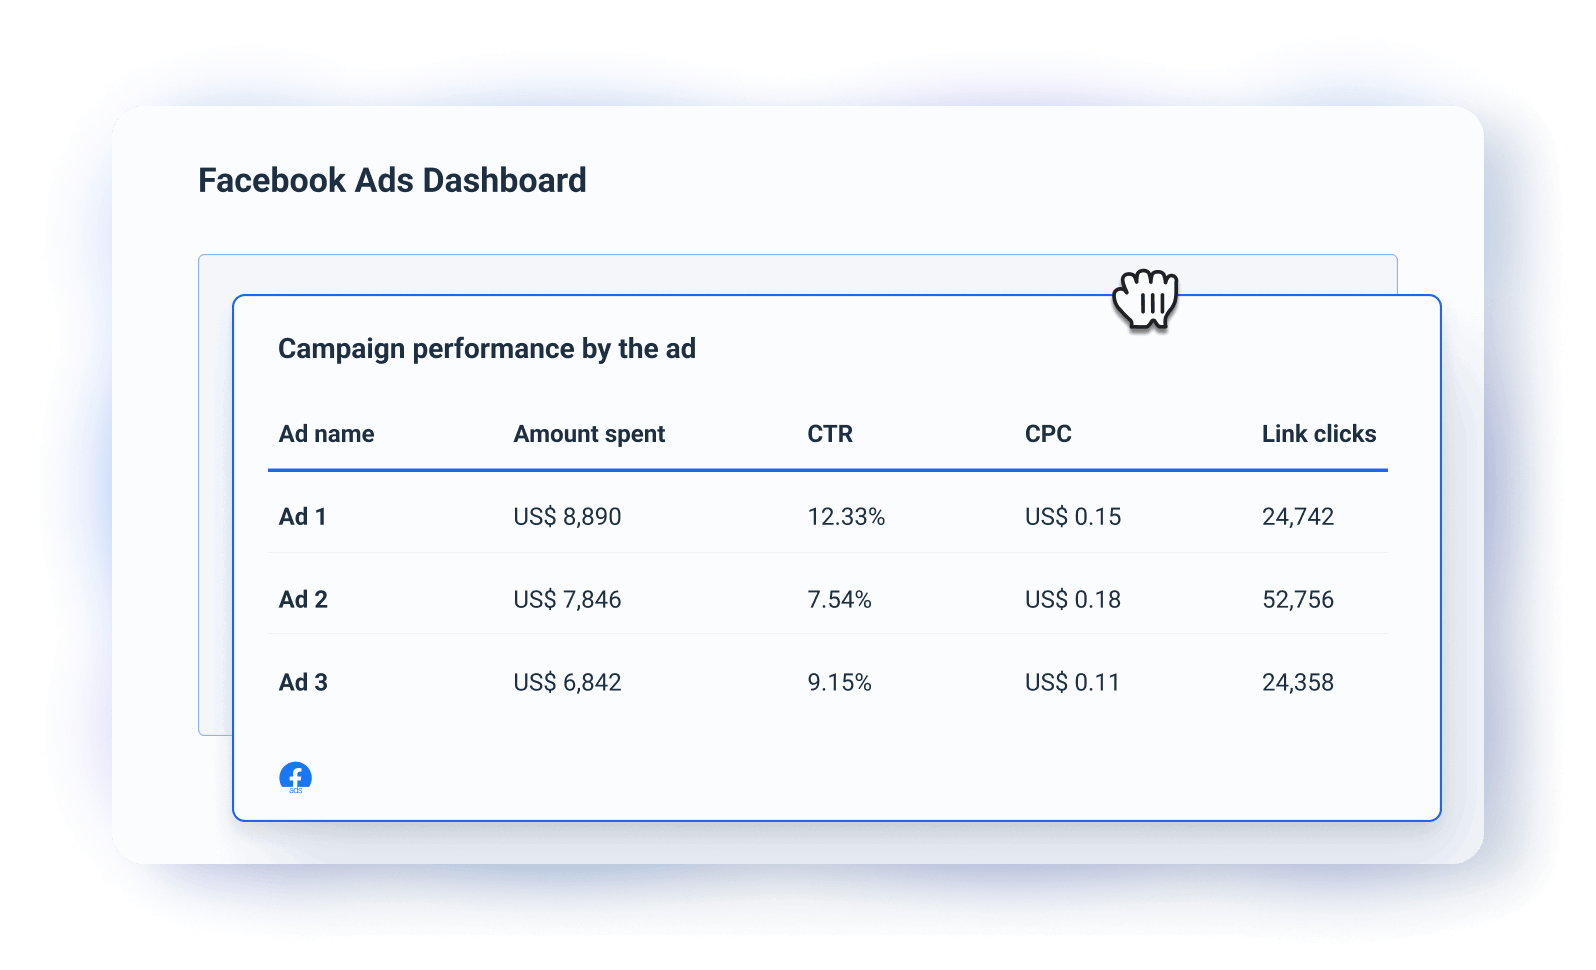
What your most cost-efficient ad campaigns are

This dashboard can help you quickly identify which ad campaigns drive results at a lower cost. Use this information to reallocate your budget to your most cost-efficient ad campaigns.

Table Ads Breakdown - A dashboard displayes Facebook ads campaign performance metrics.

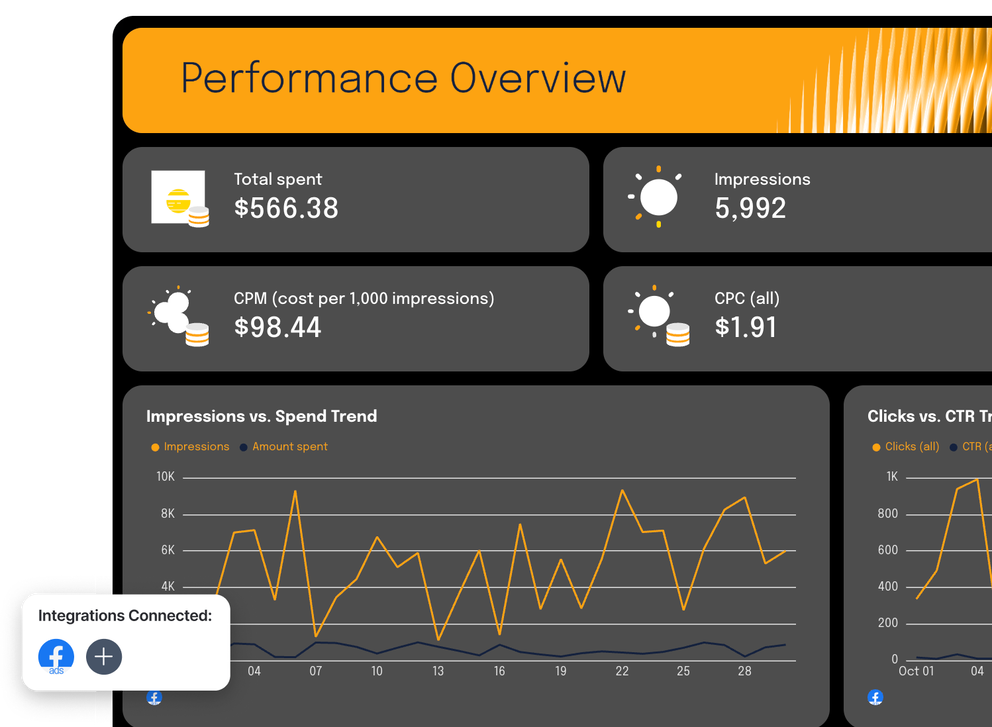
How often people see your ads in their news feed?

Gauge the overall impressions of your ad campaigns and compare the results to previous periods. Measure whether your reach is improving with time and what you can do to improve it.

How to create a Facebook Ads dashboard?

The easiest way to create a Facebook Ads dashboard is to use a dedicated Facebook Ads reporting tool, like Whatagraph.

On Whatagraph, you can create Facebook analytics dashboards in four simple steps:

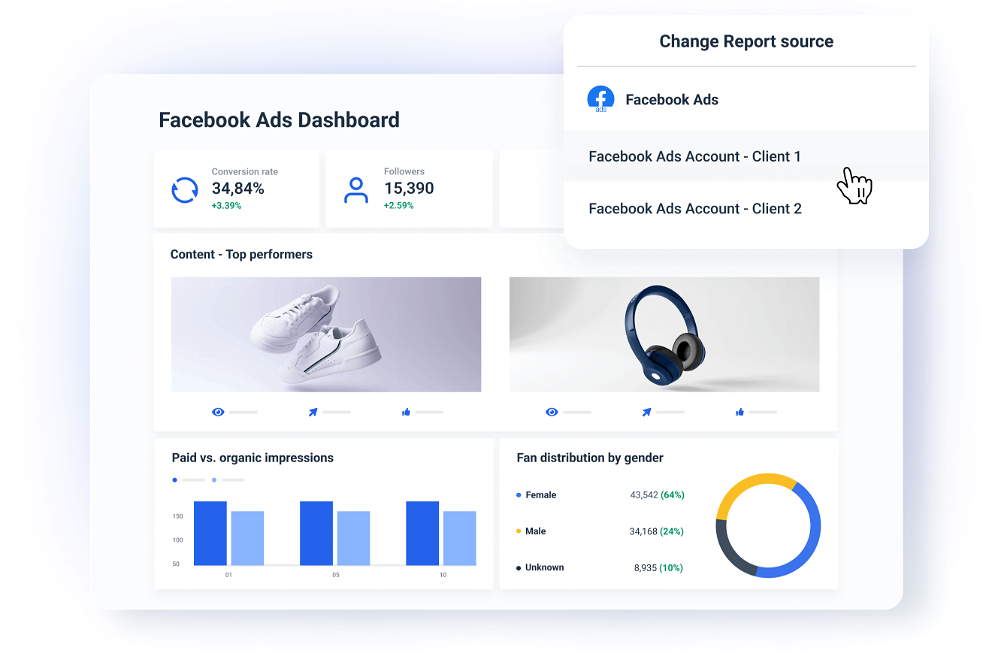
1. Add Facebook Ads account as a source

The first step is to connect your Facebook Ads accounts through a plug-and-play integration.

From Whatagraph’s workspace, choose Facebook as your data source, authenticate with your login, and you’re set.

In addition to Facebook, we support 55+ other integrations, including:

  • PPC platforms, like Meta Ads, LinkedIn Ads, Pinterest Ads, Google Ads
  • Social media platforms, like Instagram, TikTok, YouTube
  • E-commerce platforms, like Shopify, BigCommerce, Magento
  • SEO platforms, like Ahrefs, Semrush, SE Ranking
  • Email platforms, like Klaviyo, Mailchimp, ActiveCampaign

And, you can also pull data from Google Analytics, PPC platforms, Google Sheets, or API connections.

2. Organize your data

Once your data sources are connected, it's time to organize your data.

Data organizing helps everyone in your team (and your clients) to understand what’s happening in your dashboards.

With Whatagraph, you can:

  • Standardize naming across campaigns and accounts
  • Group data from multiple campaigns into regions or tiers
  • Blend data sources, like Facebook Ads and Google Ads, together
  • Create custom metrics that show, for example, ROAS across multiple campaigns
  • Apply tags and folders to organize by Account Manager, client, or region

This may sound complicated at first, but Whatagraph makes it easy through our "Organize" page.

3. Select a dashboard template

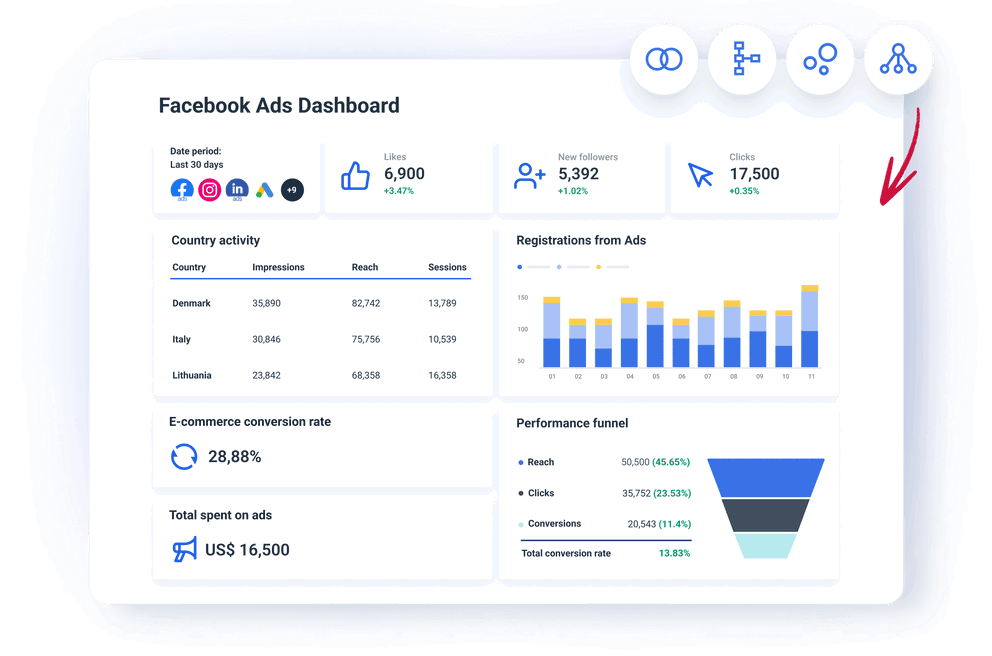
Whatagraph has 55+ dashboard and report templates for different scenarios, one of which is the Facebook advertising dashboard template.

It gives you an in-depth view of your Facebook Ads account performance and includes all key KPIs. Think of ones like amount spent, impressions, ROAS, CTR, and conversions.

If you want full control over your report, you can start from a blank canvas and add customizable widgets and visualizations.

Want to follow your Facebook page's performance? Use our Facebook page insights dashboard template.

4. Use AI for insights and performance summaries

Clients don’t just want a dashboard full of charts. They also want to understand what’s happening in their campaigns.

With Whatagraph’s AI, you can:

  • Create performance summaries and add them directly to your reports
  • Ask questions about the campaign performance and get real-time answers

For the performance summaries, you can choose short or long format, then tweak tone and messaging.

Plus, you can always edit the summaries further to give a bit of a human touch.

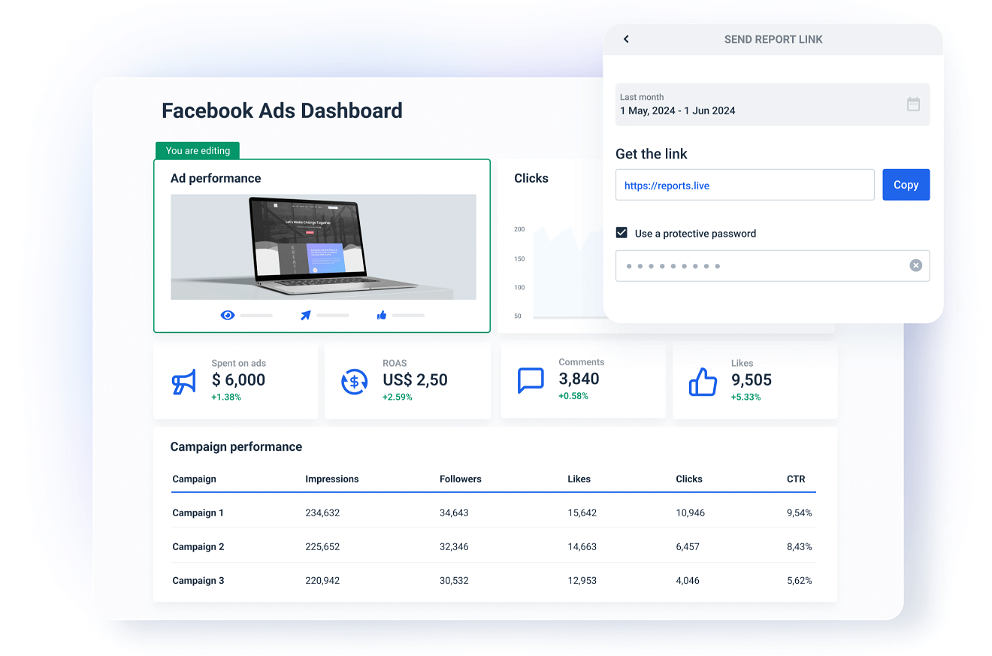
5. Share the dashboard with clients

After you’re happy with your Facebook reporting dashboard, the only thing left is to share it with clients.

Whatagraph offers a few ways to share the dashboards:

  • Share a link and give viewers an option to explore the data and change date ranges
  • Schedule and send it via email, for example monthly, weekly, or daily
  • Export the whole dashboard (or parts of it) as PDFs or CSVs

If you’re an agency, you might also want to move your data to BigQuery or visualize it in Looker Studio.

What metrics can be tracked using a Facebook Ads Dashboard?

Impressions: Impressions show how many times your ad has been shown, which is helpful in determining its reach. It should be viewed in conjunction with other metrics like engagement or conversion rate.

Link clicks: Link clicks show how many people clicked on your links in your ad campaigns. This is a key metric to add to your Facebook insights dashboard so clients understand how many people enter their website from Facebook ads.

Engagement rate: The percentage of people who interacted with your ad after seeing it. A good indicator of how well your ad creative and messaging are resonating with your audience.

Amount spent: A simple yet effective metric displaying the amount spent on ad campaigns. You can show the amount spent at the ad set or campaign level.

Click-through rate (CTR): CTR shows the ratio of users who clicked your ad to those who saw it. A high CTR often shows your ads are resonating with the target audience.

Cost-per-click (CPC): CPC tells you how much each click is costing you. It’s an important metric for managing budgets and optimizing spending. Ideally, you want a low CPC while still attracting high-quality clicks.

Return-on-ad-spend (ROAS): ROAS measures the revenue generated for every dollar spent. It’s a go-to metric for understanding if your ads are profitable.

Conversion rate: Conversion rate is the percentage of people who purchased your product after clicking on your ad. It helps to understand how effectively your ad and landing page convert buyers.

Frequently Asked Questions

All your questions answered. And if you can’t find it here, chat to our friendly team.

What is a Facebook reporting dashboard?

A Facebook reporting dashboard is a tool that shows key metrics from your Facebook ads and page performance. It gives you easy-to-read insights into your audience engagement, ad reach, and conversion rates, helping you track and optimize your social marketing efforts efficiently.

What is the main purpose of Facebook Ads?

The main purpose of Facebook Ads is to help businesses get more visibility for their Facebook content and generate more traffic to their website content, including core pages or blogs. You can set Facebook ads to target greater site traffic, impressions, and click-through rate (CTR).

What other marketing channels can I connect with Whatagraph?

Apart from Facebook Ads, you can connect all popular PPCs like LinkedIn Ads and Google Ads, social media such as LinkedIn and Instagram, e-commerce platforms like Shopify and WooCommerce, SEO tools like Ahrefs, Semrush, and Google My Business, email marketing tools like Klaviyo and Mailchimp, Google Analytics 4, and CRMs like HubSpot and Salesforce.


If you can’t find the integration for your data source, connect it via a Custom API or export it to Google Sheets docs or BigQuery data warehouse and add it as a source.