
What Should a Facebook Report Include?
A strong Facebook reporting template should make it effortless to track Facebook performance, explain results, and unearth insights that guide your social media strategy.
Here’s what you should add to your Facebook analytics report:
1. Performance Summary
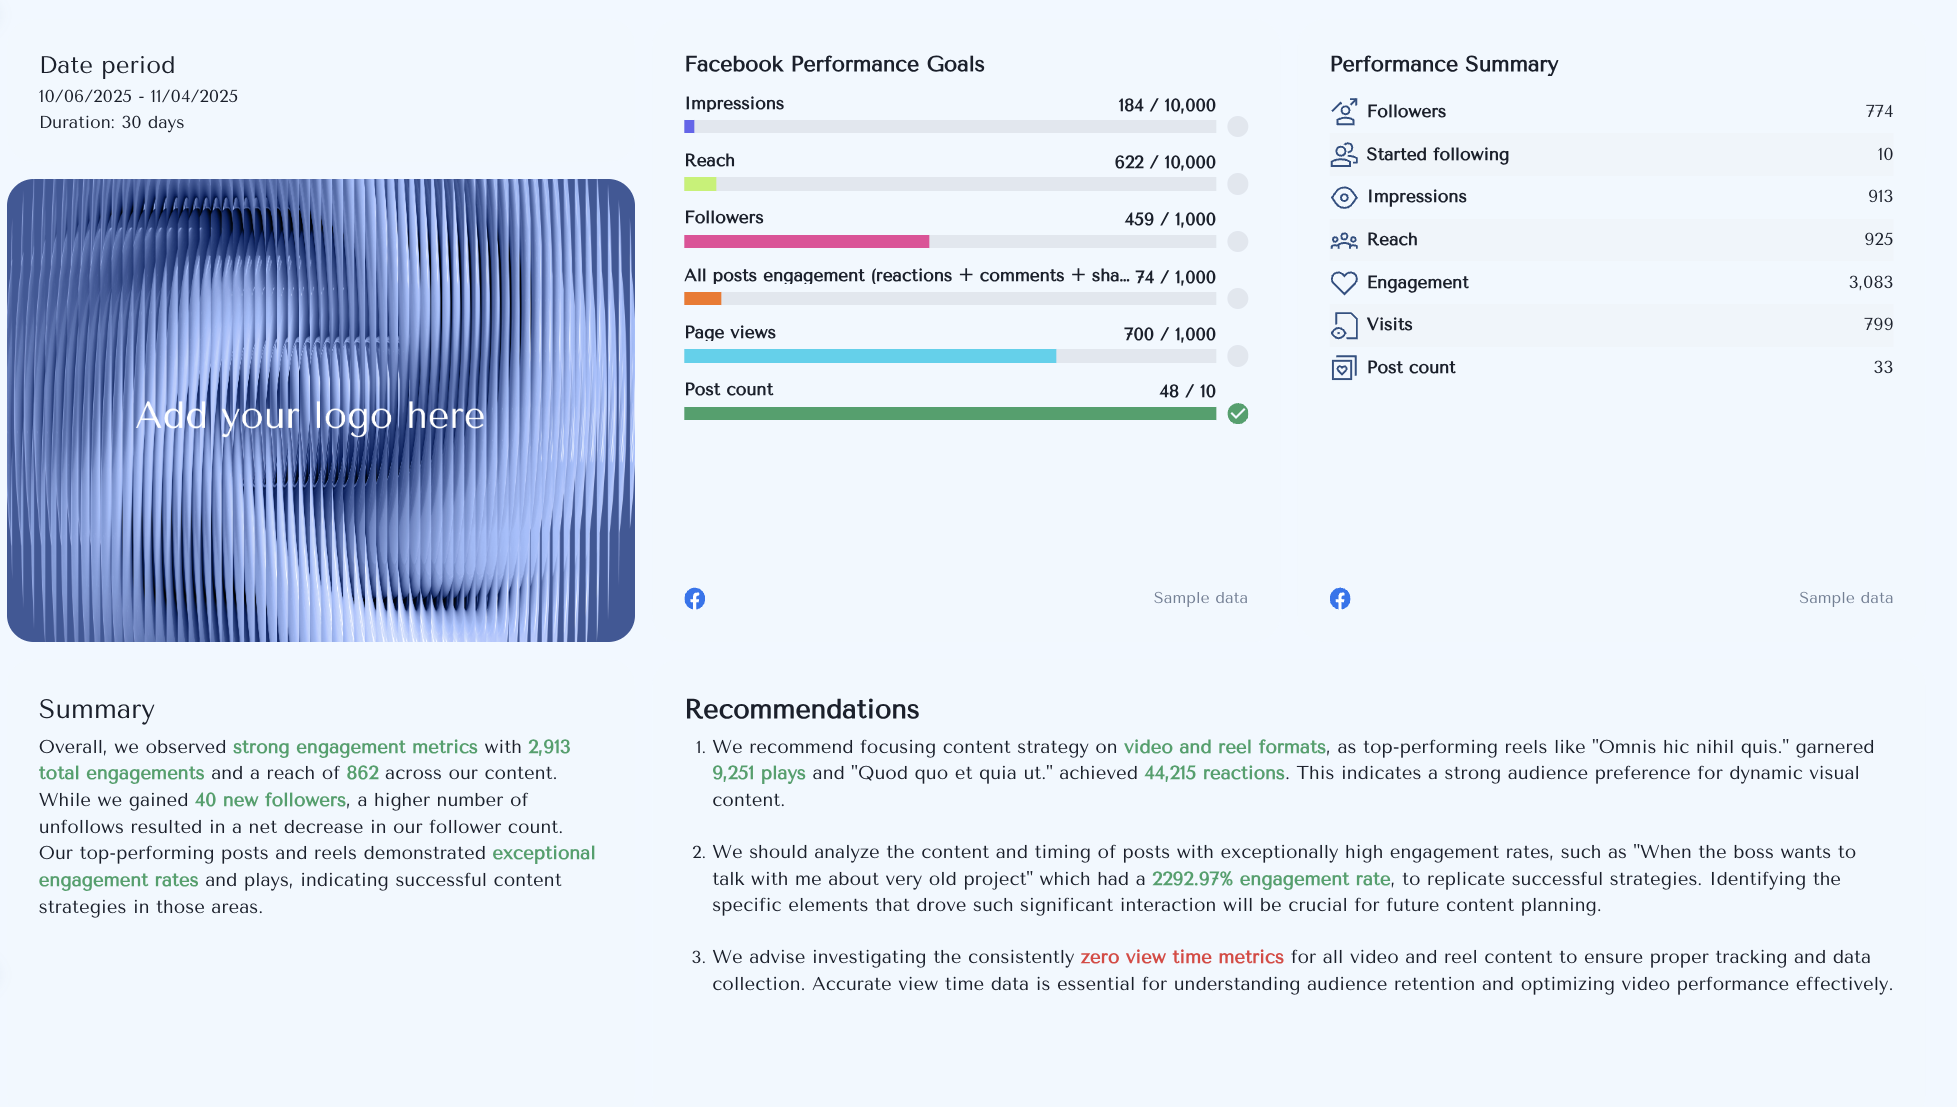 Start your Facebook performance report with the essentials:
- The date range for your reporting period
- A goal widget that visualizes how close you are to reaching your KPIs
- A performance summary list showing your key metrics like reach, engagement, and page views
- Summaries and recommendations text box
Use Whatagraph IQ to generate your summary and recommendations automatically. Choose from four content types — Summary, Wins, Issues, or Recommendations — or use your own custom prompt.
IQ analyzes the real Facebook data in your report (no hallucinations) and writes insights in 18 languages. There are no data security risks either since your data never has to leave Whatagraph.
2. Followers Breakdown
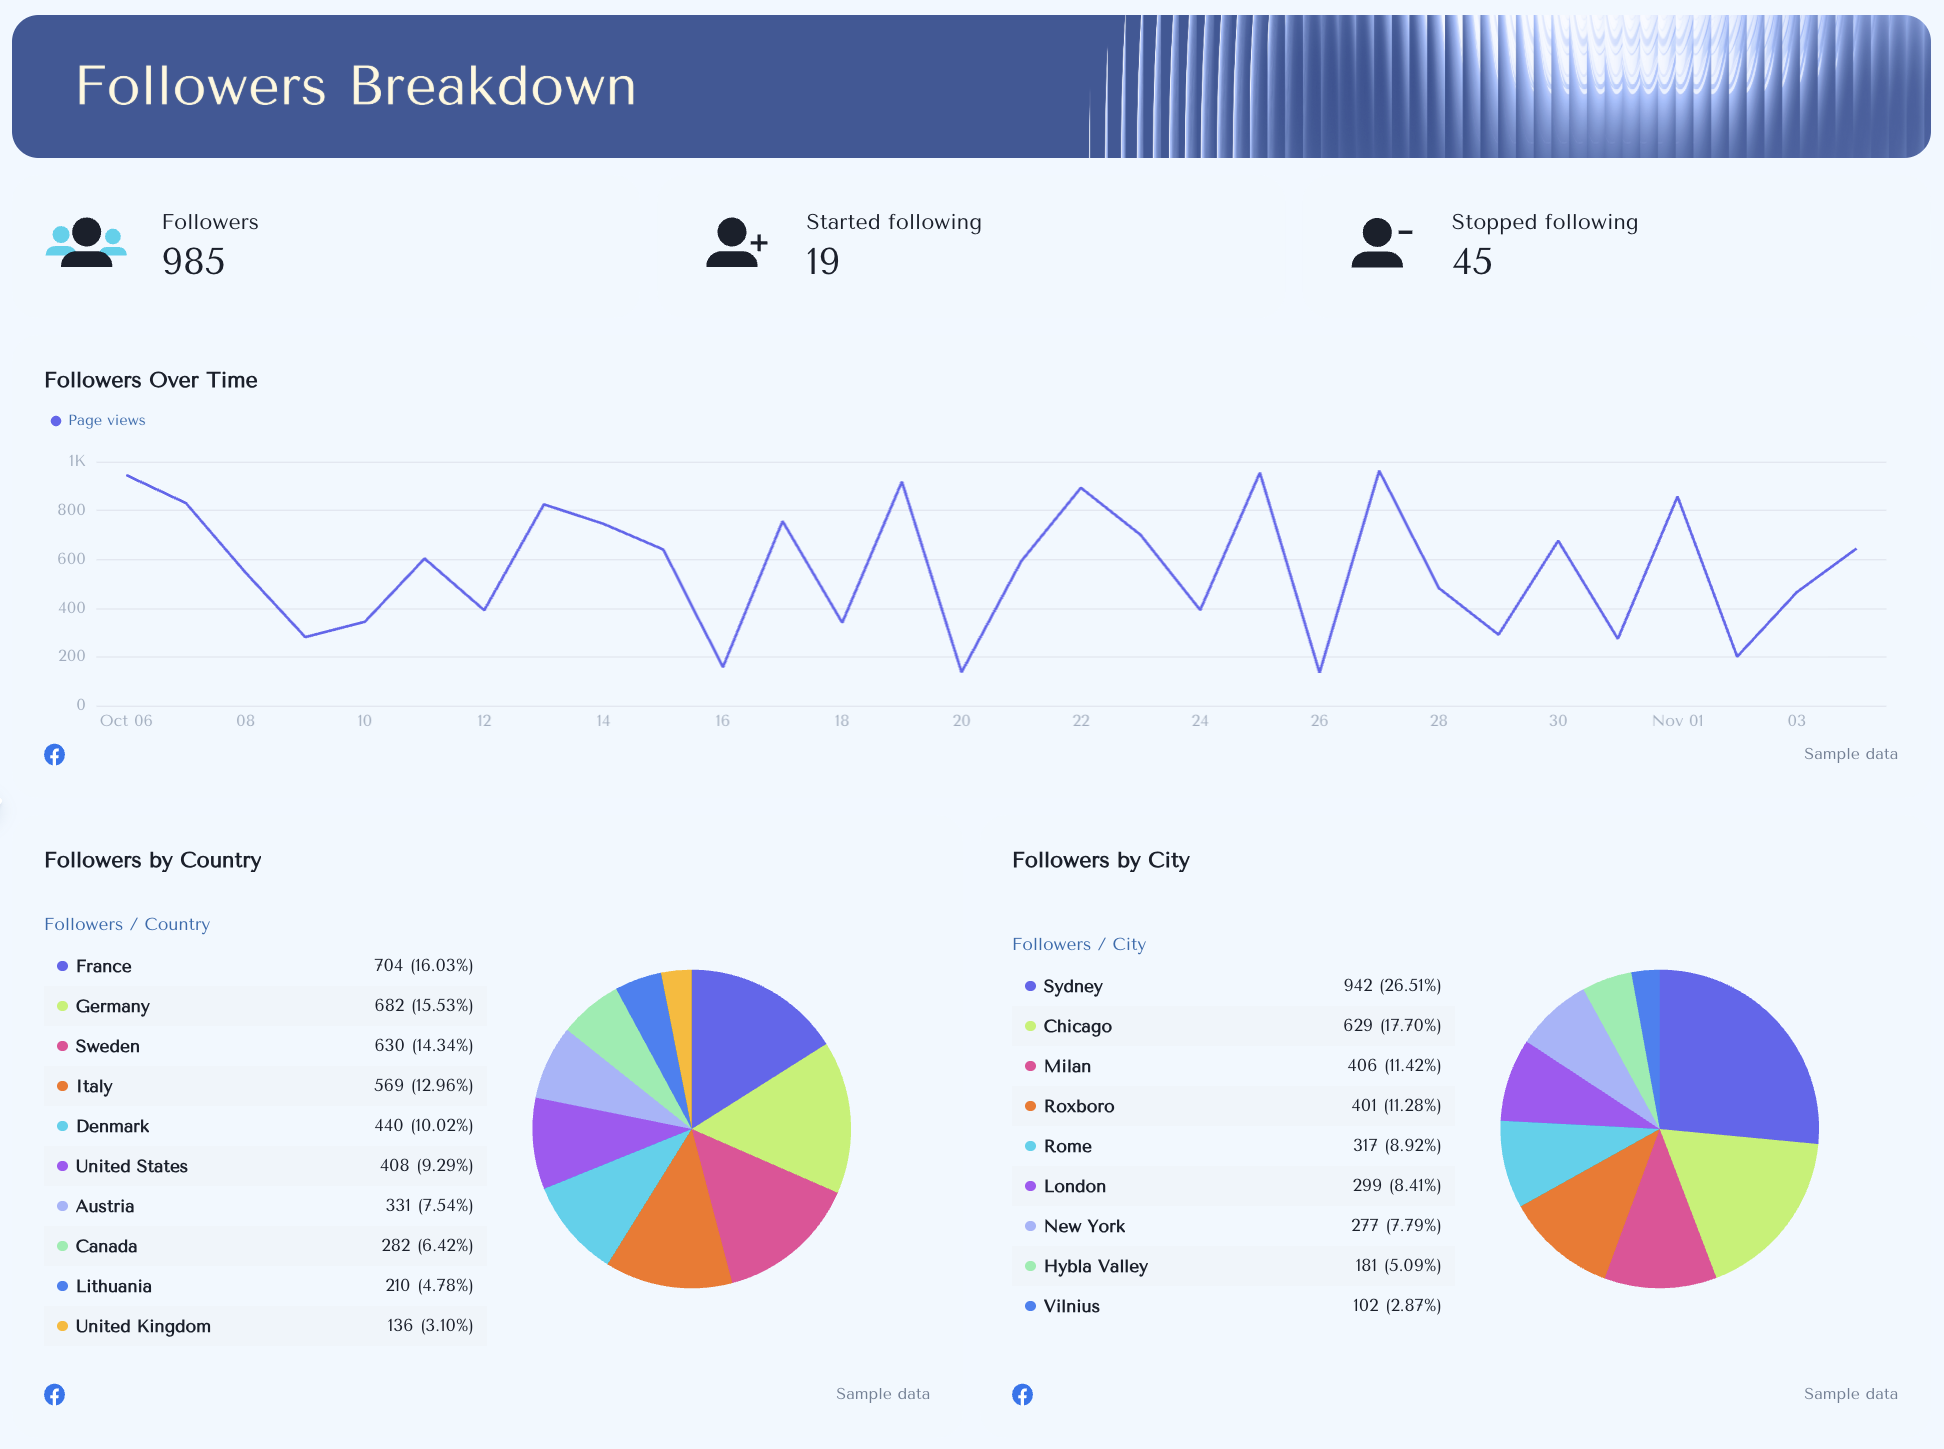
Understand your audience growth at a glance.
See your total followers, new followers gained, and users who stopped following. Visualize follower changes with a followers over time trend line.
Add audience demographics by country and city to identify where engagement is coming from and align your content strategy with your target audience.
3. Impressions and Reach Breakdown
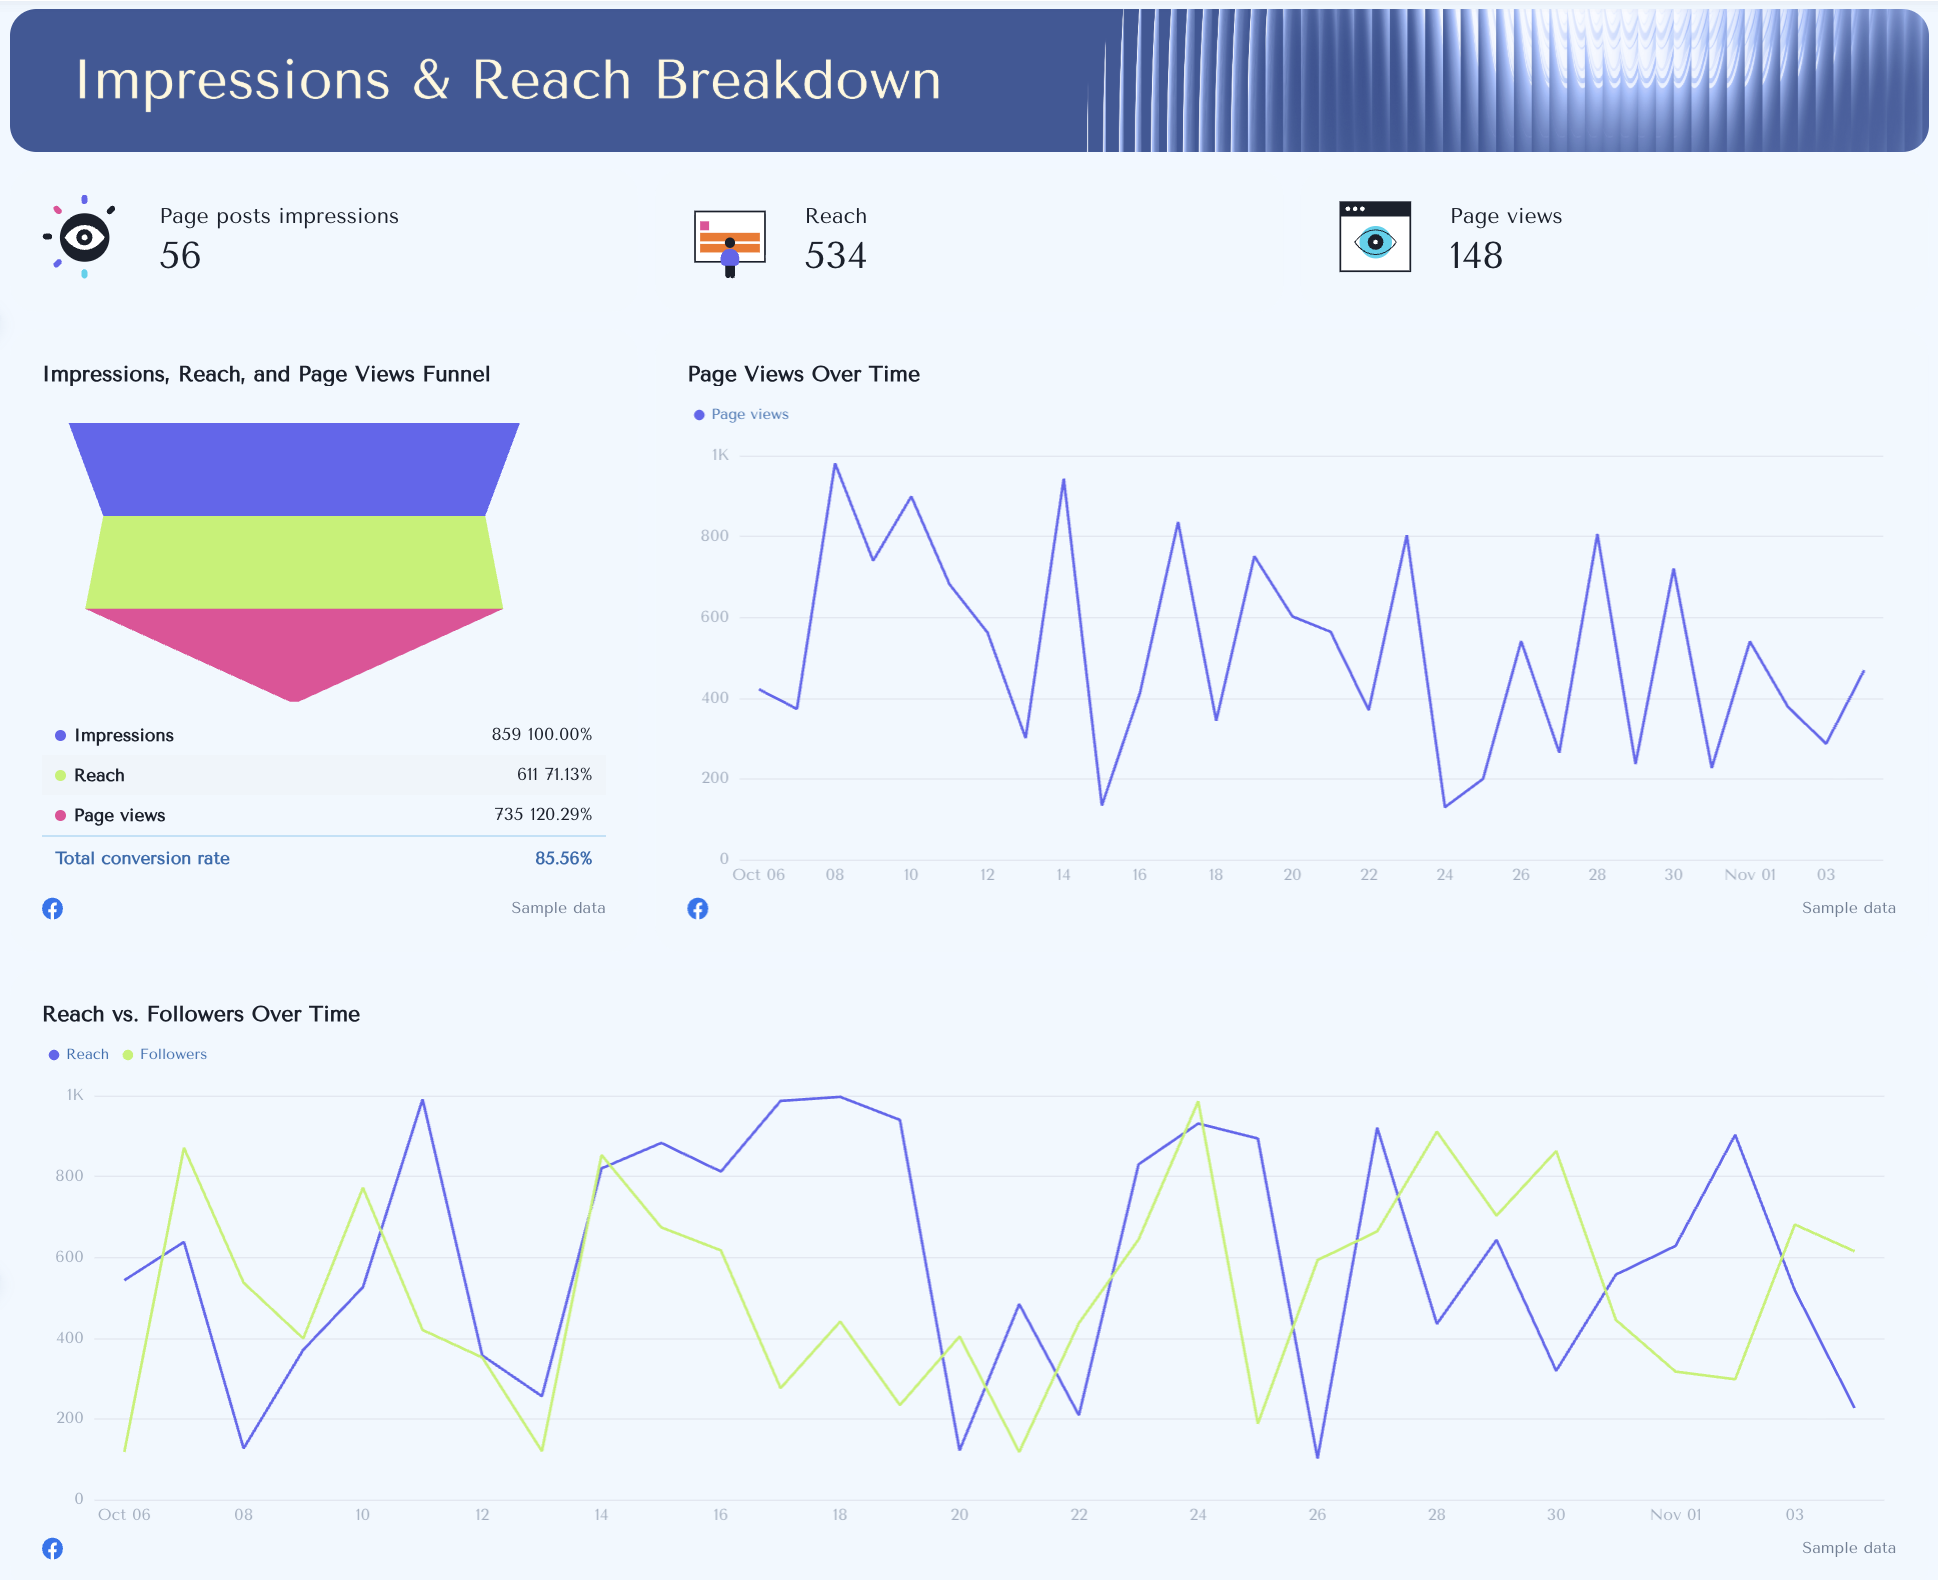
This section focuses on page performance and visibility.
Track page post impressions, reach, and page views, and visualize the relationship between them with a funnel chart.
Monitor page views over time and compare reach vs. followers to spot organic growth trends. These performance metrics help you see how effectively your Facebook content is expanding audience reach.
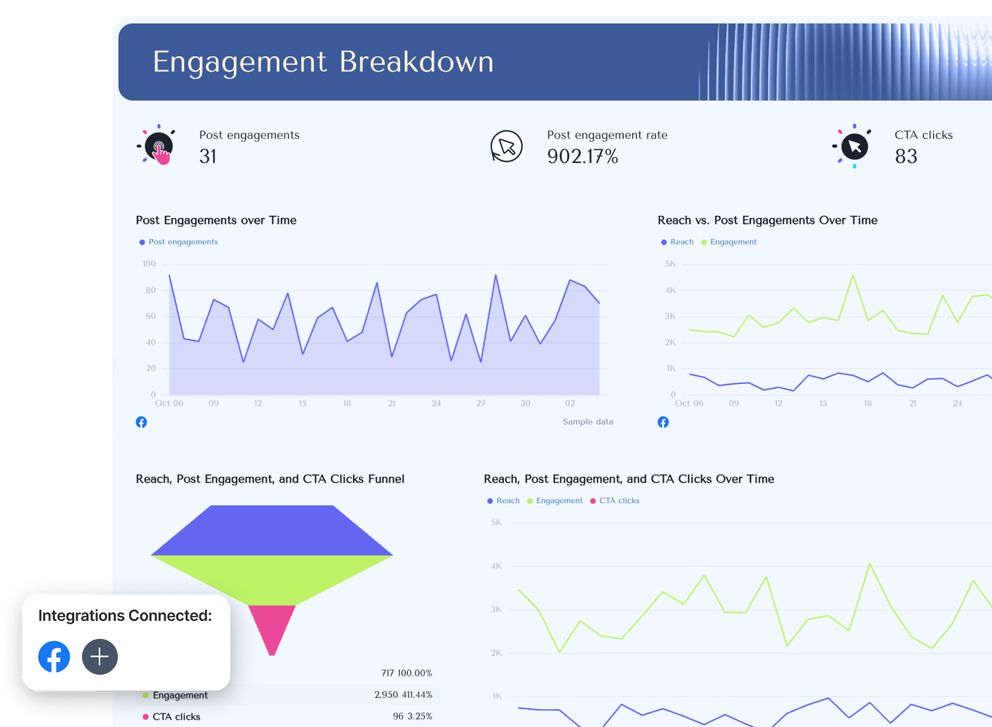
4. Engagement Breakdown
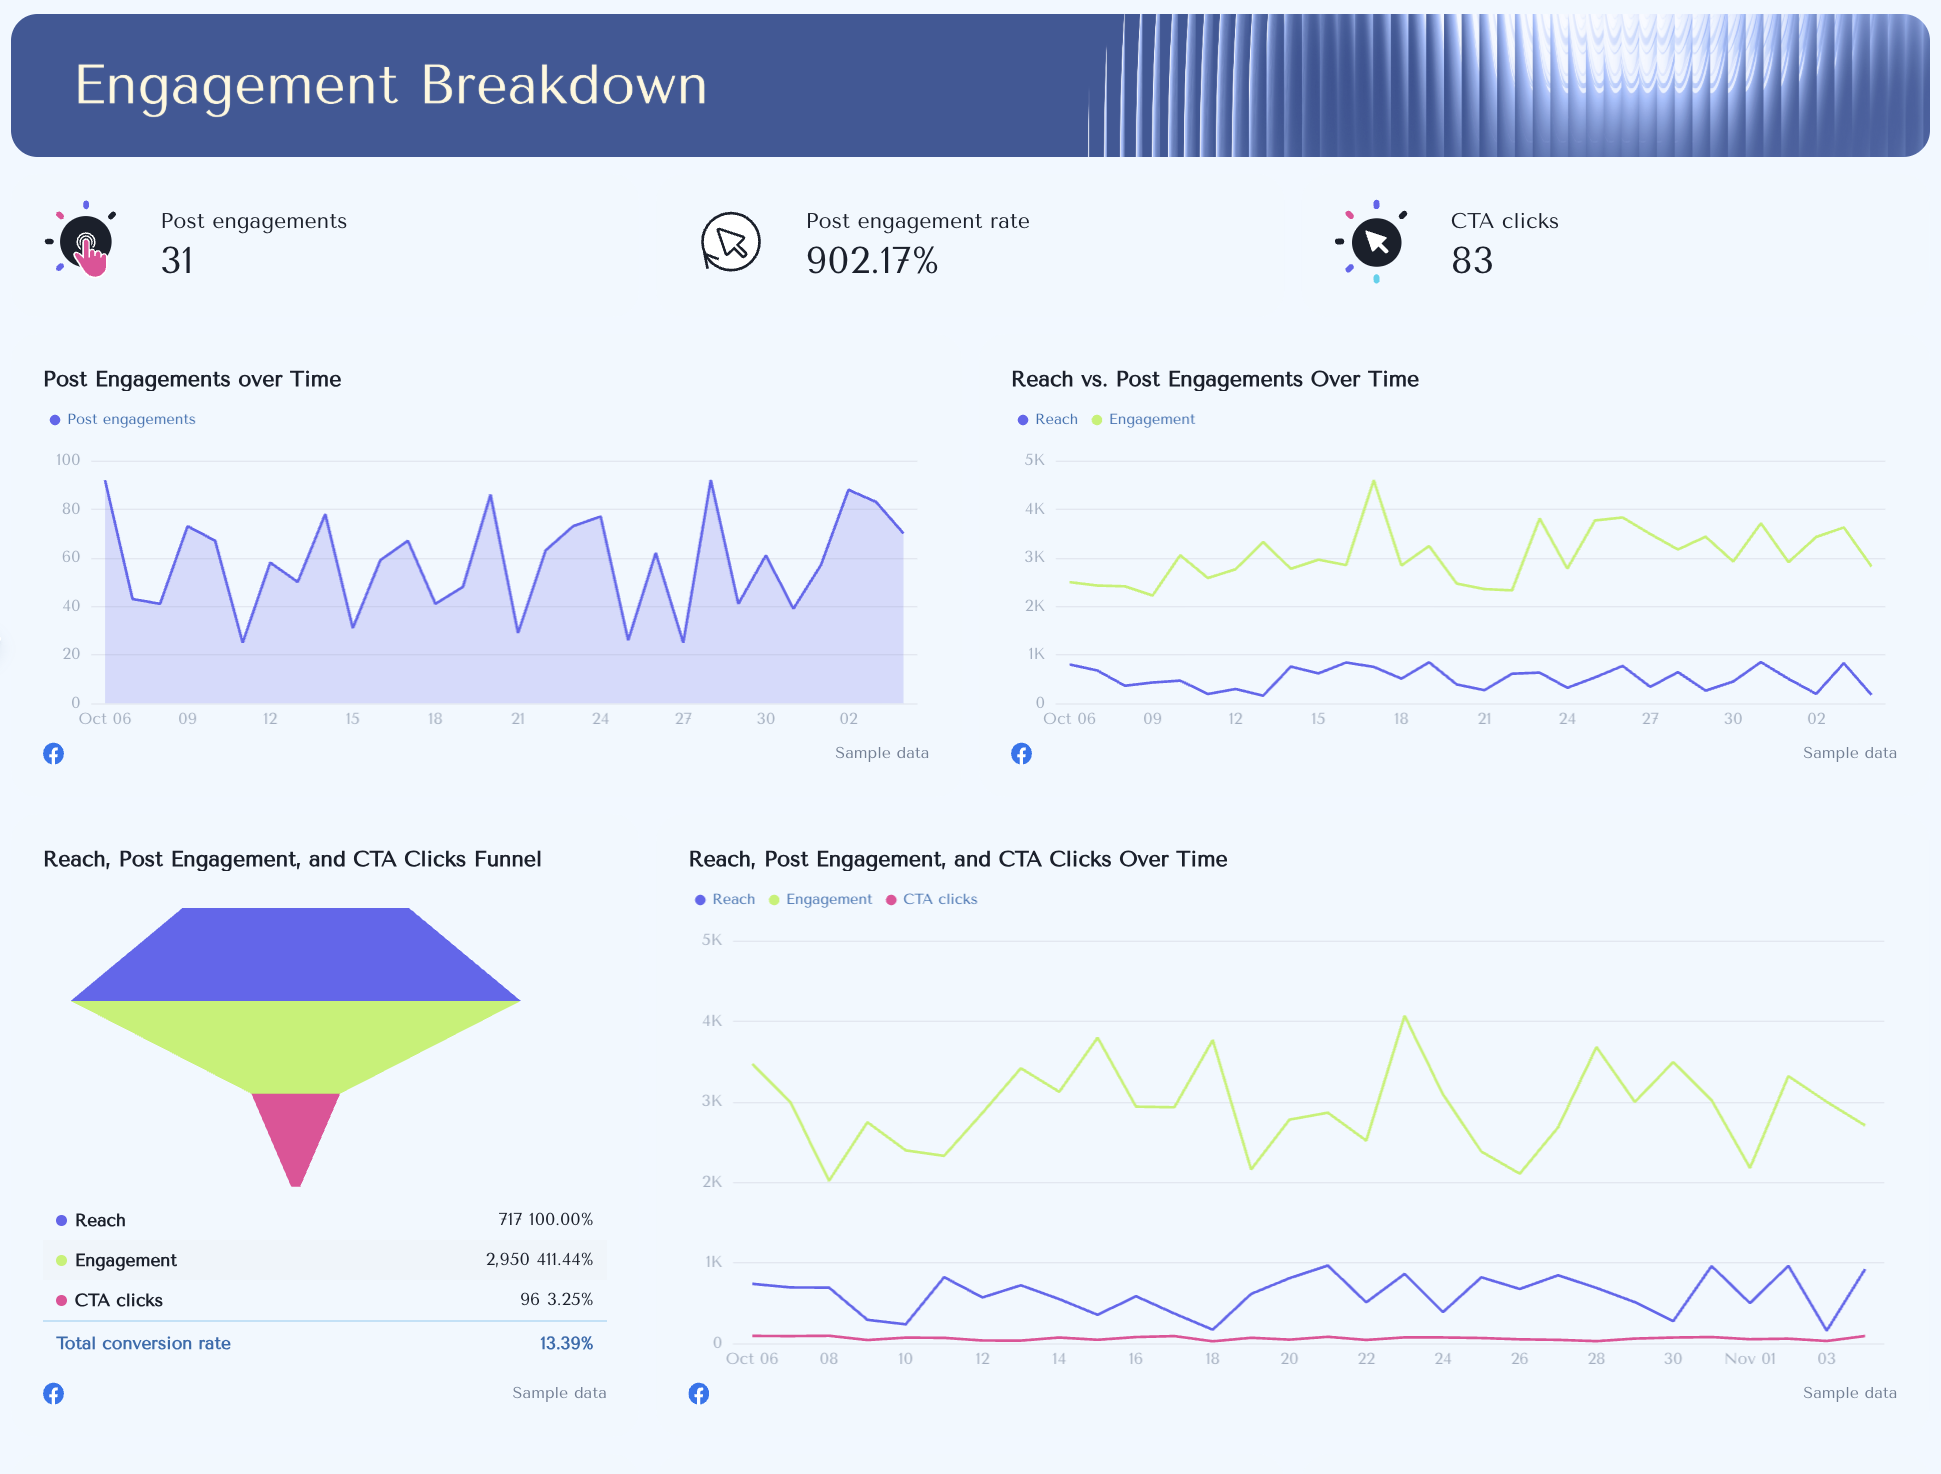
Dive into how your audience interacts with your posts.
Show engagement metrics like post engagements, engagement rate, and CTA clicks to evaluate content performance. Use line charts to track engagement trends and compare them with reach over time.
Break engagement down by type — likes, comments, and shares — with pie charts and reaction breakdowns that show unique engagement averages. This section highlights what drives the strongest interaction across your Facebook posts.

5. Top-Performing Posts Breakdown
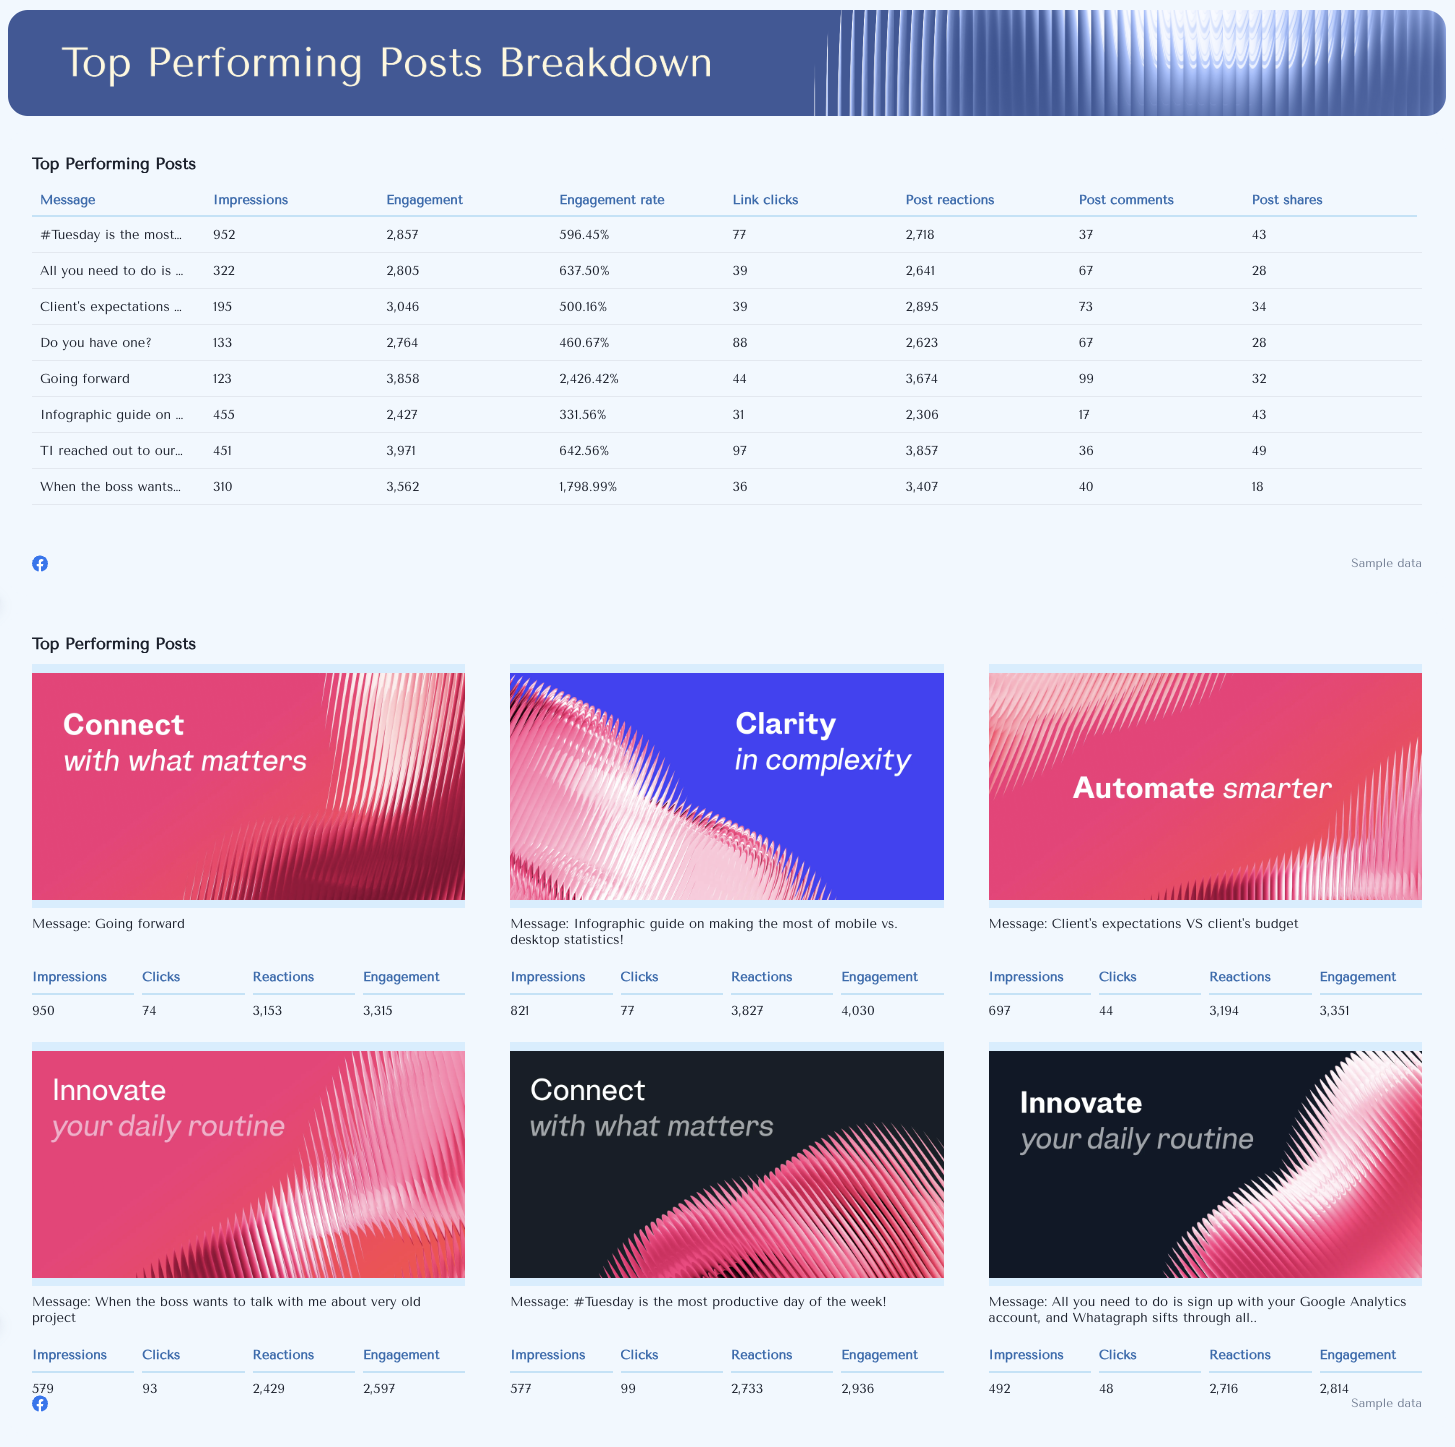
This post performance section shows which posts resonate most with your audience.
Include a table that lists all posts alongside key metrics like impressions, engagement rate, reactions, comments, and link clicks.
Then, add a carousel view of your top-performing posts to showcase standout visuals and creative results that support your social media marketing efforts.
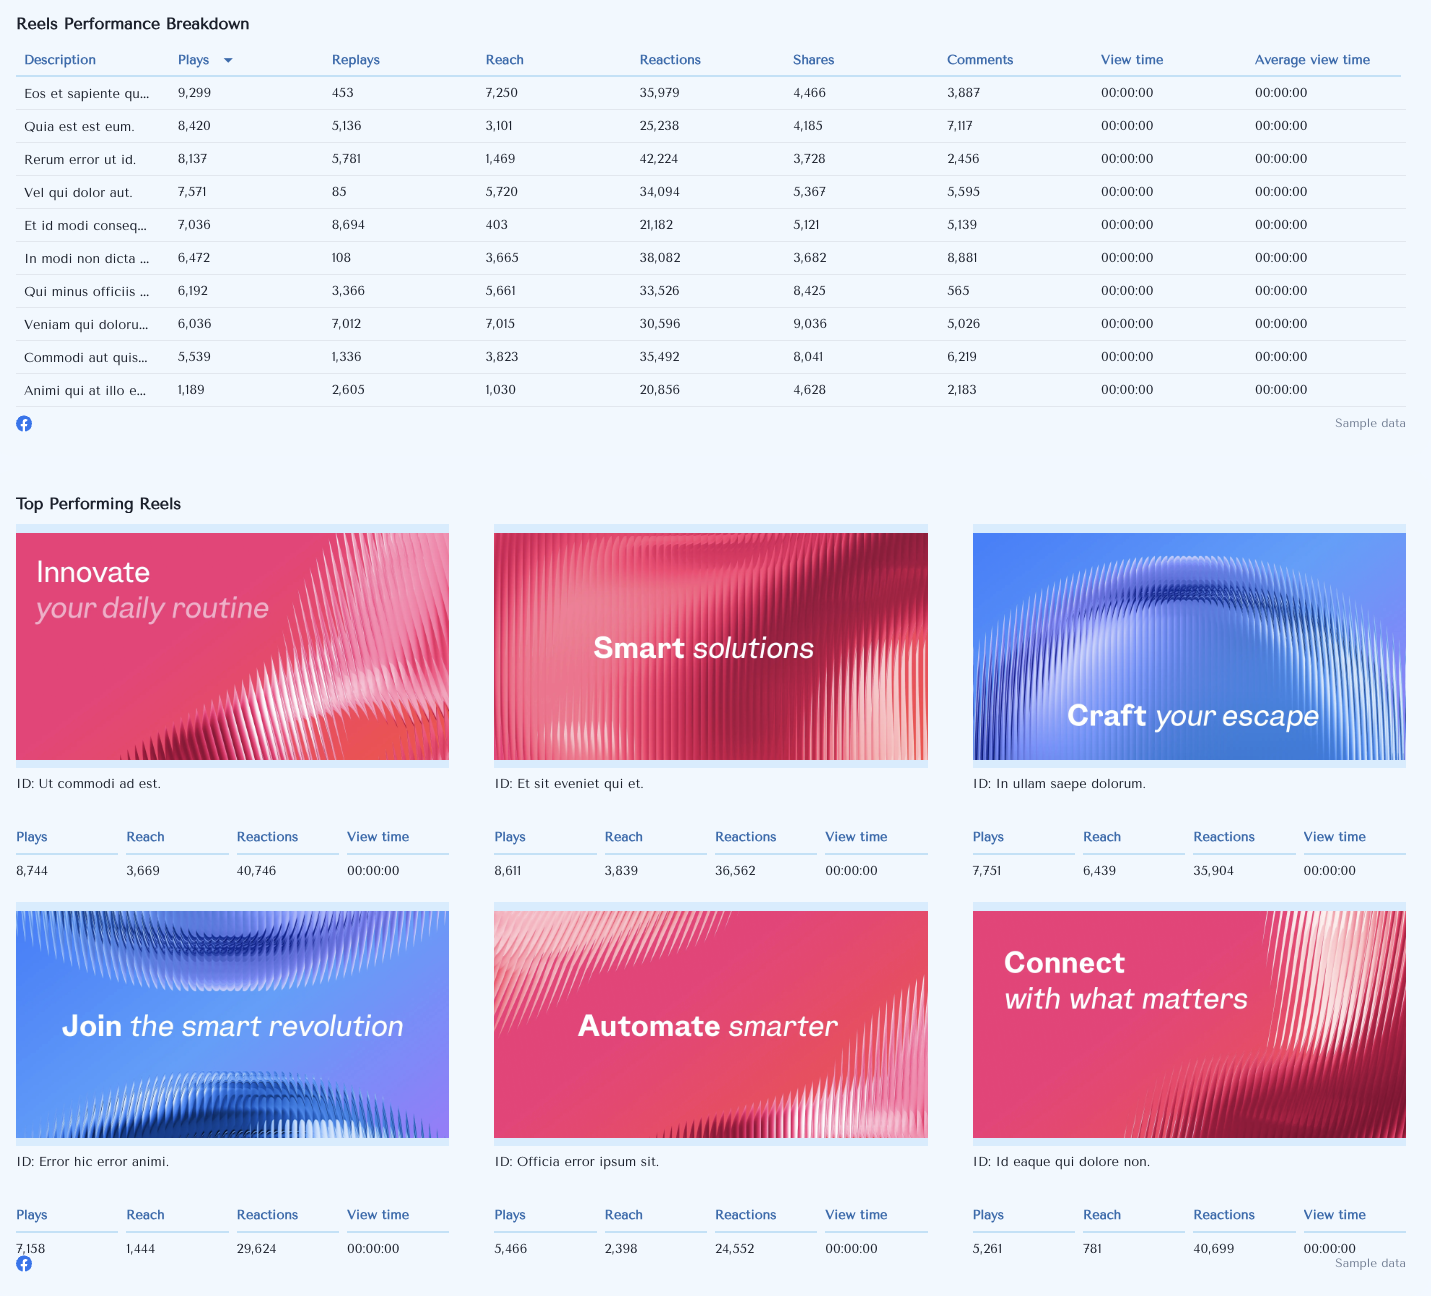
6. Reels Performance Breakdown
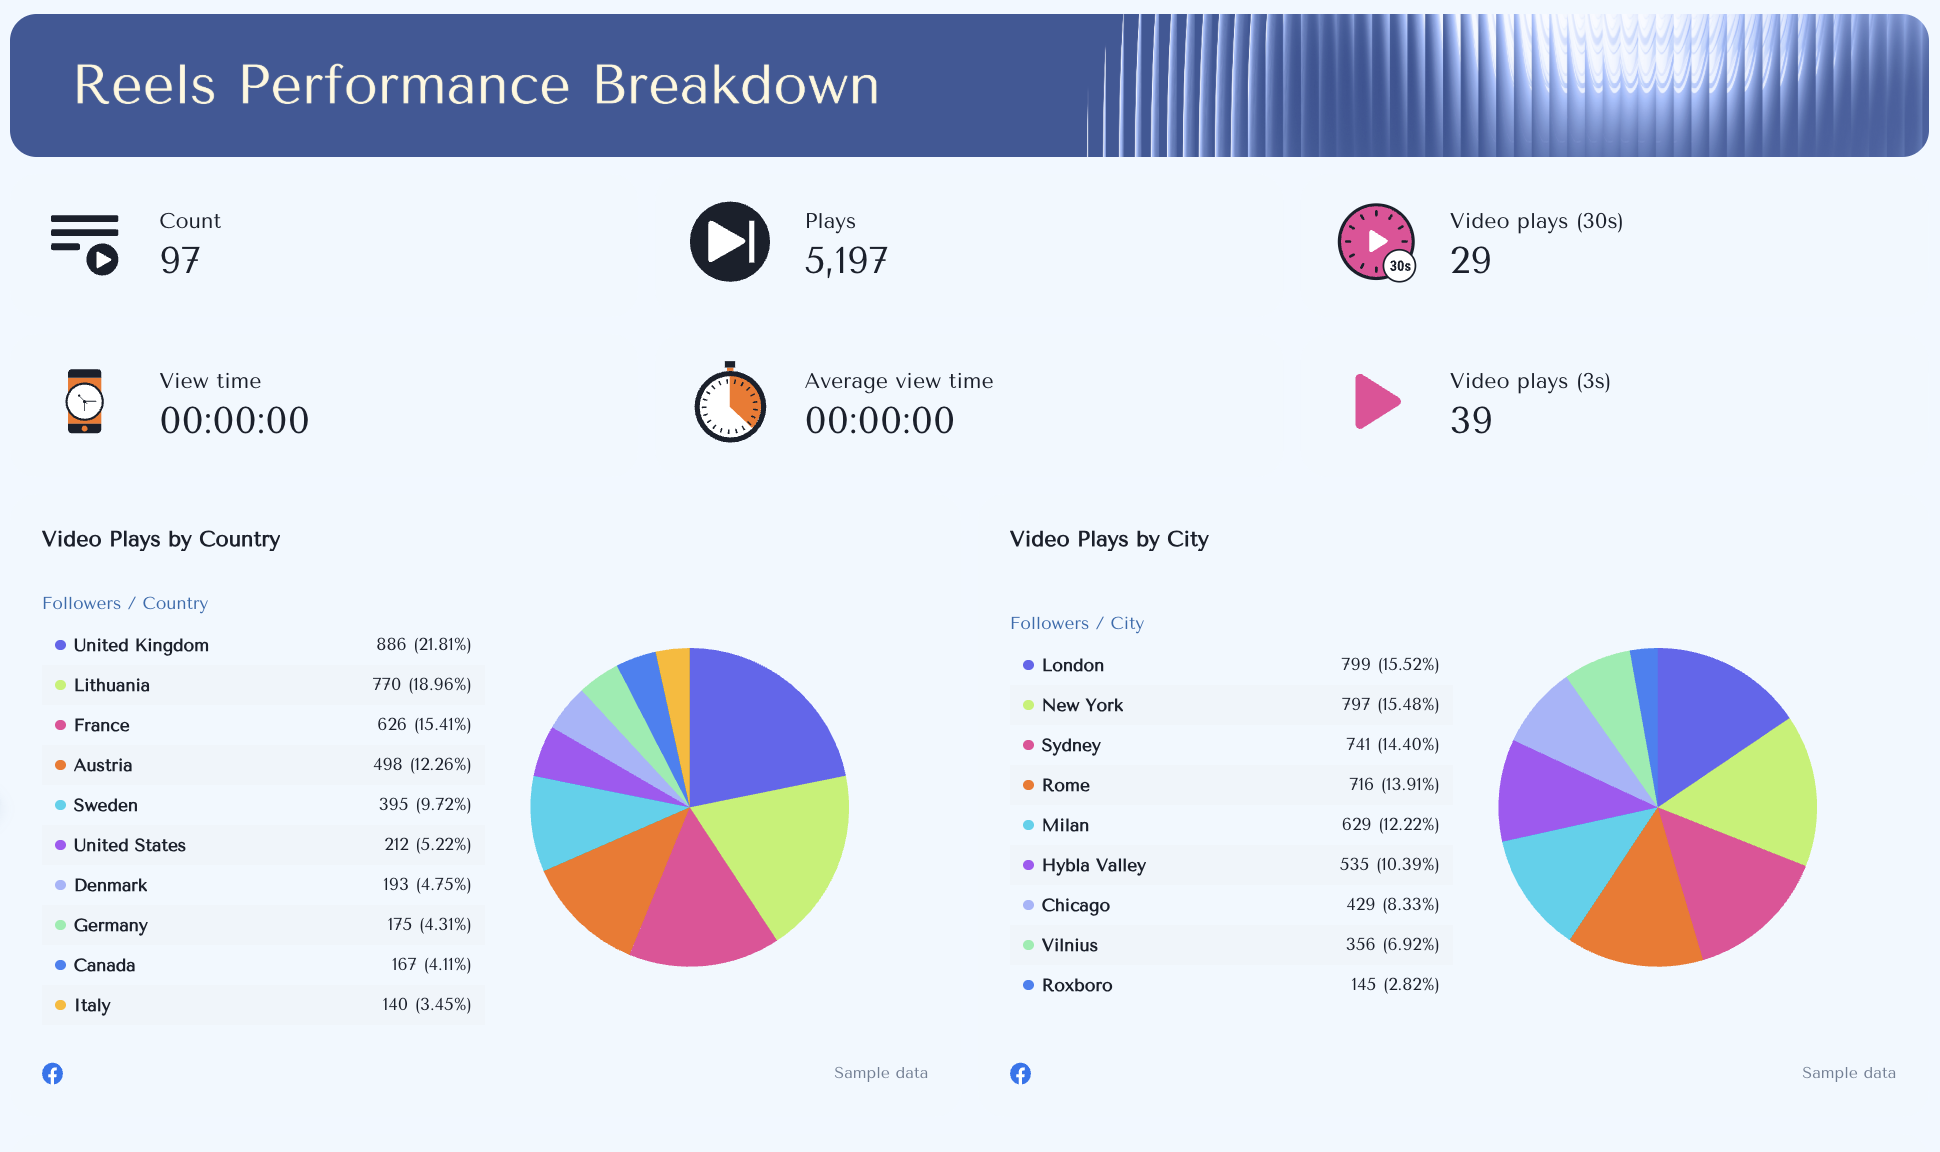 Analyze your video content performance with data-rich insights on your Facebook Reels.
Track video plays (3s and 30s), replays, total view time, and average view duration.
Include a table showing performance per reel — with metrics like reach, reactions, comments, shares, and engagement rate — plus maps showing video plays by country and city. Wrap up with a carousel of top Reels to highlight creative assets and their engagement outcomes.