YouTube Dashboard Template

Create a stunning YouTube analytics dashboard and visualize your video content metrics in one place with a few clicks with our YouTube dashboard template. Our dashboard is already pre-loaded with the essential YouTube metrics, while the data populates automatically when you connect your YouTube account. Connect your client’s YouTube channels for fast and accurate takeaways and tailor the campaign performance results to your client’s needs. Share every YouTube dashboard via live links for real-time on-demand view.

YouTube Dashboard Template for Marketers
You are in good company with 1,000+ marketing agencies and in-house teams worldwide
Dentsu
mc cann logo
Whatagraph image
Whatagraph image
Whatagraph image
Ogilvy logo
havas logo
n365 logo

One YouTube analytics dashboard to monitor and share all your YouTube channel performance

Analyze all YouTube KPIs and metrics in one dashboard

Want to know how your Instagram account is performing? Highlight your video performance results in our YouTube KPI dashboard to quickly identify the effectiveness of your YouTube videos. Use stunning data visualization to recognize key trends and subscriber behavior patterns. Learn who your target audience is, what the average watch time for every video is, the number of times our videos get seen, and how many likes and dislikes your content gets.

YouTube Dashboard Template - Analyze all YouTube KPIs and metrics in one dashboard

Save hours with cross-channel insights

Check the metrics behind your top-performing video without logging into your YouTube analytics. Our actionable YouTube dashboard template is built with drag-and-drop widgets that you can rearrange, remove, and add new ones, just like building blocks. Pick a metric and dimension for every table, graph, and chart, and apply filters to present the needed data. Bring together metrics from other social media channels for quick and easy cross-channel insights and a complete view of your social marketing strategy. Save every dashboard or widget you create as a new template. Link multiple templates and edit them all in bulk.

YouTube Dashboard Template - Save hours with cross-channel insights

24/7 insights with live YouTube dashboards

Share a live link to your YouTube dashboard that updates automatically instead of gathering and sending over marketing data whenever your clients request it. Another great feature is that the YouTube live dashboard is interactive. The viewers can change the date ranges, explore the data, and, if needed, secure it with a password. Quick insights into YouTube performance metrics for faster decision-making.

YouTube Dashboard Template - 24/7 insights with live YouTube dashboards

All dashboard features your agency needs

50+ data sources

Create a true cross-channel digital marketing dashboard in Whatagraph. Over 50 integrations for your cross-channel marketing campaigns.

Cross-channel insights

Include data from different sources into the same widgets or dashboards with a few clicks. Provide a full picture of your campaigns’ success.

Live dashboards

Securely share interactive access to your dashboard at any time from anywhere.

White-label dashboards

Customize colors and logos in each dashboard to align it with your agency’s or clients’ branding and style.

Why should you use a YouTube analytics dashboard with cross-channel data?

Using a YT dashboard that integrates data from other marketing channels has multiple benefits:

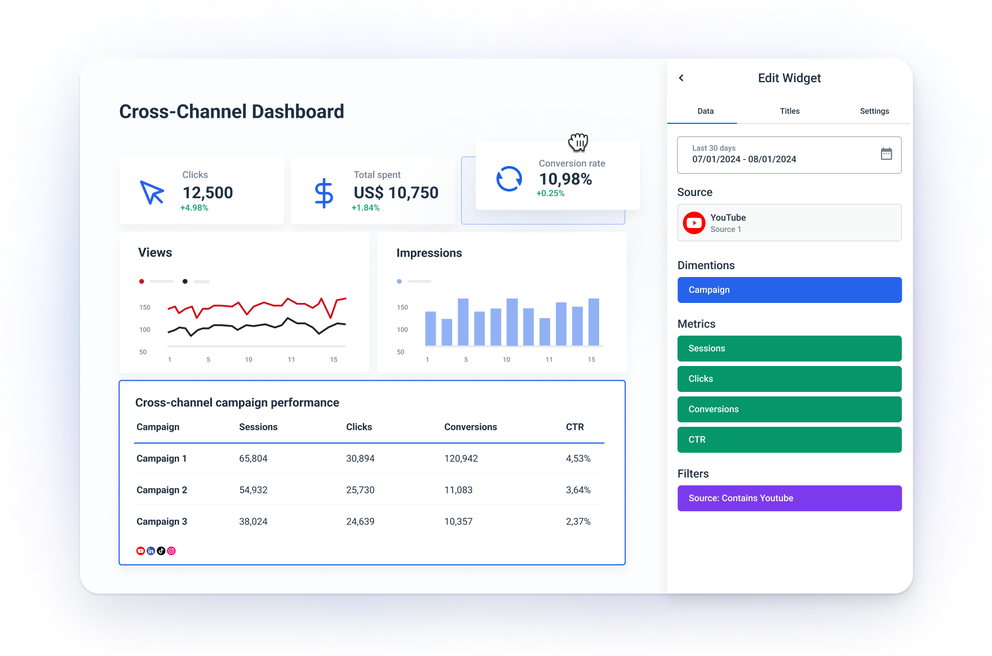
1. Unified view of performance: Combining your YouTube video performance data with data from various marketing channels such as other social media, email marketing, PPC, and SEO gives you a complete picture of your marketing performance. You can use the dashboard to understand how different channels contribute to overall sales and customer engagement, which helps you make better data-driven decisions.

2. Improved attribution and ROI analysis: With an all-in-one dashboard, it becomes easy to track customer journeys across multiple touchpoints and accurately attribute sales and conversion to the correct channels. This way, you can measure the return on investment for each marketing channel and campaign and allocate your budget accordingly.

3. Deeper customer insights: When you combine YouTube data with analytics from all your channels, you get deeper insights into customer behavior, preferences, and purchasing patterns. As a result, this allows you to create more accurate customer segments by analyzing data from different sources.

4. Optimized marketing strategies: With a consolidated view of all your marketing data in one place, it’s easy to compare the performance of marketing campaigns across different channels to identify what works and replicate it. You have more confidence in performing A/B testing when your decisions are fueled by data from multiple channels.

YouTube Dashboard Template - Whatagraph

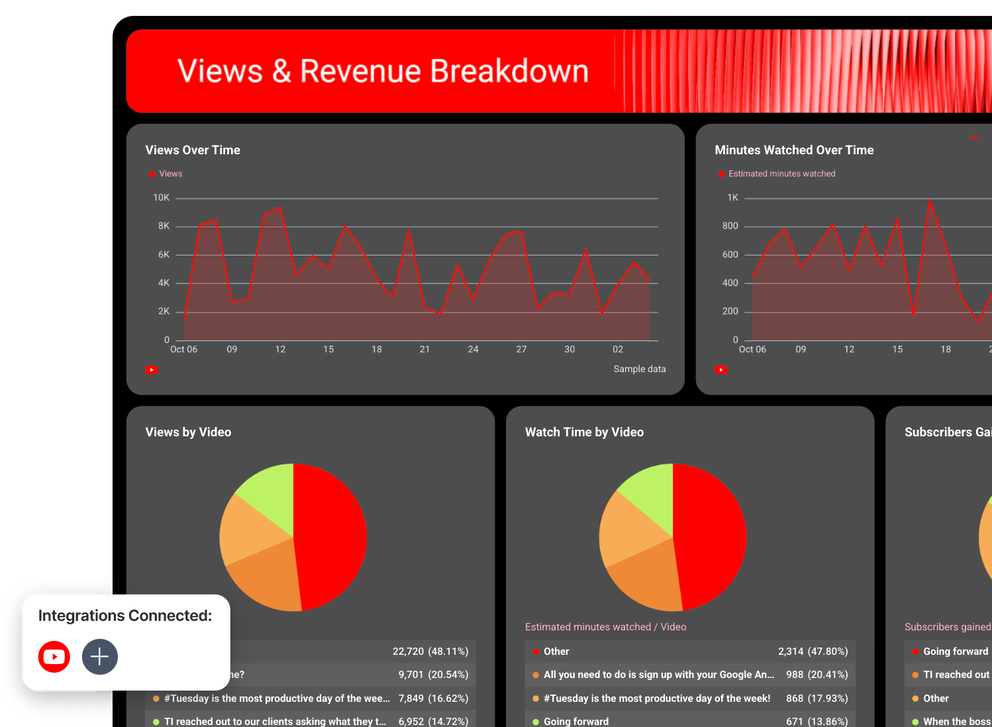
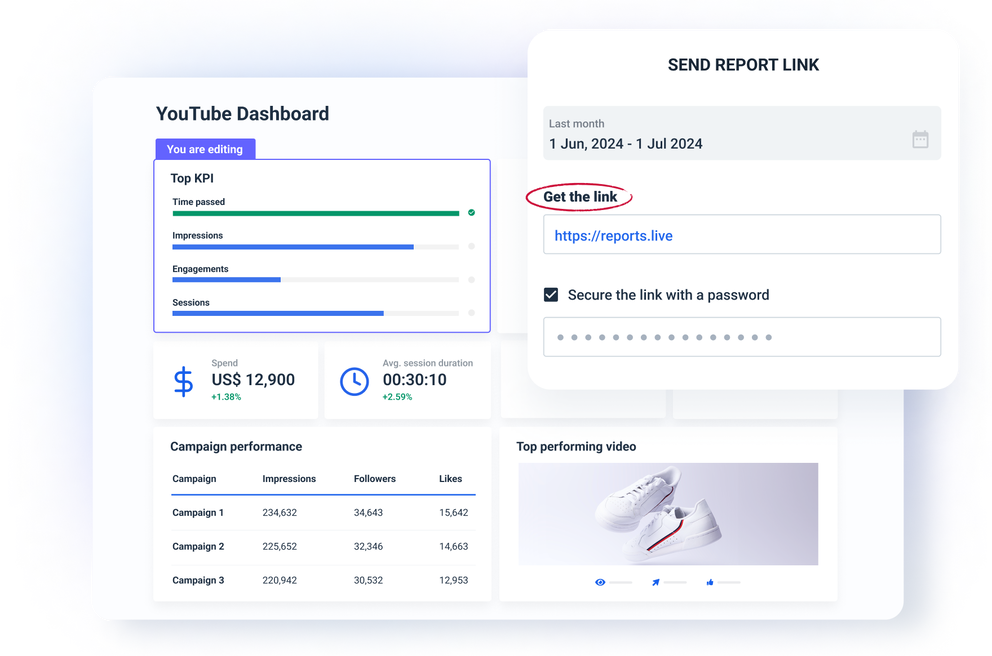
5. Centralized reporting: By integrating the YouTube KPI dashboard with additional data sources, you have all key metrics in one place, so there’s no need to switch between different platforms. With automated data collection, the only thing remains to automate the process across the channels. Share a link to a YouTube live dashboard and your clients or stakeholders will never miss an update.

6. Better budget management: A centralized data hub allows you to monitor and analyze marketing spending across all channels to make sure funds are allocated effectively, with minimal inefficiencies. Tracking the cost-effectiveness of each channel and campaign helps you make informed decisions about where to invest more.

7. Advanced customization: Whatagraph’s dashboard templates are highly customizable so you can easily adapt the dashboard design to focus on the most relevant KPIs and metrics for your client’s goal. You can use the dashboard insights to create detailed customer segments based on data from multiple channels, which allows you to further refine your targeting and video content strategy.

8. Scalability and growth: As your business grows, you can easily integrate additional marketing channels into any Whatagraph dashboard and ensure it remains a valuable tool as your marketing efforts expand. Stay ahead of industry trends by having the flexibility to connect new marketing channels and data sources.

By using a professional YouTube dashboard template that includes data from other marketing channels, marketing agencies can build a more strategic approach to their marketing efforts, ultimately driving better results and higher ROI.

Build a custom YouTube analytics dashboard in minutes

Pick from over 80 YouTube metrics and create standalone YouTube dashboards for clients or easily combine marketing data from different social media platforms and build cross-channel dashboards in Whatagraph. 

FAQs

All your questions answered. And if you can’t find it here, chat to our friendly team.

How do I see my YouTube Analytics?

You can see your YouTube Analytics in the YouTube Studio app:


1. Sign in to YouTube Studio.

2. From the left menu, select Analytics.

3. Find the report you'd like to download and click Advanced mode or See more.

4. Make any adjustments you'd like to the dashboard.

5. At the top, select Export current view and choose your preferred file format.


This is a very manual way of getting data from YouTube Analytics. If you need to do this for a number of clients, prepare specific insights, and present the data in a way that is understandable to anyone, you need a proper YT dashboard.

What is a YouTube Analytics dashboard?

A YouTube Analytics dashboard is an interactive real-time display that shows the essential KPIs and metrics that you need to understand the marketing performance of your YouTube videos. These metrics include total view duration, subscribers gained vs. lost, total views, and others.

What other marketing channels can I connect with Whatagraph?

Apart from YouTube, you can connect all popular social media such as LinkedIn, Facebook, and Instagram, PPCs like Facebook Ads and Google Ads, e-commerce platforms like Shopify and WooCommerce, SEO tools like Ahrefs and Semrush, email marketing tools like Klaviyo and Mailchimp, Google Analytics 4, and CRMs like HubSpot and Salesforce.


If you can’t find the integration for your data source, connect it via a Custom API or export it to Google Sheets docs or BigQuery data warehouse and add it as a source.

It’s good to be loved! Our clients are not shy about expressing it.

I made a switch from GDS and Sheets for reporting to Whatagraph, and I am saving literal hours each week on performance report creation. Our small firm actually managed to onboard 2 new clients as a result of all the time we saved on managing data and reporting. The customer service is also really helpful and easy to reach.

Mindaugas S., Marketing Consultant Capterra logo for Whatagraph review

Capterra verified review by

Mindaugas S., Marketing Consultant

Having active customer support to help fix any issues was a big contributor, but we also really liked the ability to save templates and connect sources to multiple charts/widgets at once without having to edit them individually. And having the grid layout is much easier to stay consistent with than the free form setup that Data Studio has.

Nico T., Media Planner Capterra logo for Whatagraph review

Capterra verified review by

Nico T., Media Planner

The system has standard templates that are easy and fast to use. Also you can build your own report with lightning speed. It is very easy to use, has a lot of integration, and let get started very fast.

Rasmus Bernt K., External Senior Management Consultant Capterra logo for Whatagraph review

Capterra verified review by

Rasmus Bernt K., External Senior Management Consultant

We love Whatagraph - we would definitely recommend and our account manager is great! I love how easy this tool is to use, everyone on the team finds it much more user-friendly than other dashboards. Integration was easy, we sent some example reports to the team who duplicated these for us. We literally had to log in and send it to our clients!

Stephanie S., Digital Director Capterra logo for Whatagraph review

Capterra verified review by

Stephanie S., Digital Director

We are showing our clients the work that we're doing for them and this is incredibly important for our clients ROI. They want to see results and having a tool like Whatagraph that can show data from virtually every source we use is hugely important.

John S., SEO Strategist Capterra logo for Whatagraph review

Capterra verified review by

John S., SEO Strategist

The tool is easy to use; you do not need to have development resources. Even my junior project managers are capable of making campaign reports in minutes. There are a lot of pre-made templates you can use as well as many pre-made widgets.

Erman E., Marketing Specialist Capterra logo for Whatagraph review

Capterra verified review by

Erman E., Marketing Specialist

Really easy to connect data sources within the tool. The library of report templates has been helpful. The customer support team has been responsive to all of our needs. Our team enjoys the simplicity of setting up the reports and how the data is presented.

Brent N., Director of Operations Capterra logo for Whatagraph review

Capterra verified review by

Brent N., Director of Operations

Easy to create really beautiful graphs and reports which can help other team members to understand the most important takeaways. I especially like the automated report function, so I don't have to check on the same thing repeatedly.

Orsolya S., Online Marketing Manager Capterra logo for Whatagraph review

Capterra verified review by

Orsolya S., Online Marketing Manager