Free White Label Marketing Report Template

Wow clients or stakeholders with a fully customizable white-label marketing report template.

Visualize key metrics, track performance, and get actionable insights for growth.

White Label Marketing Report Template - Marketing report with graphs and key metrics.

Explore More White Label Marketing Report Templates and Examples

Find sample white label marketing report templates created by marketers for marketers. See how marketers track performance, visualize key metrics, and share results with stakeholders.
SVG image

Search...

Create Custom White Label Marketing Reports in Seconds

With Whatagraph IQ, just tell us what you need, and we'll build a stunning white label marketing report for you in seconds. No templates or manual setup needed.

How To Use Whatagraph’s White Label Marketing Dashboard Template

What to Include in a White Label Marketing Report Template

Based on Whatagraph’s white label marketing report template, below are the sections and metrics we recommend including. The structure works for both marketing agencies and in-house teams that need professional, repeatable, and fully branded reports.

Each section is built to simplify performance reporting across channels, automate updates, and support clear, client-facing insights, without messy exports, disconnected dashboards, or time-consuming spreadsheets.

1. Marketing Summary

Purpose: Give a high-level overview of overall marketing performance. This is your executive summary—perfect for busy stakeholders who want key KPIs at a glance.

What to include:

  • Marketing goals vs. actual performance
  • Performance summary and recommendations
  • Total conversions and conversion rate
  • Impressions, clicks, and cost across all channels
  • Cross-channel ROI and spend distribution
  • Visual: Multi-channel trend chart
  • Visual: KPI comparison table

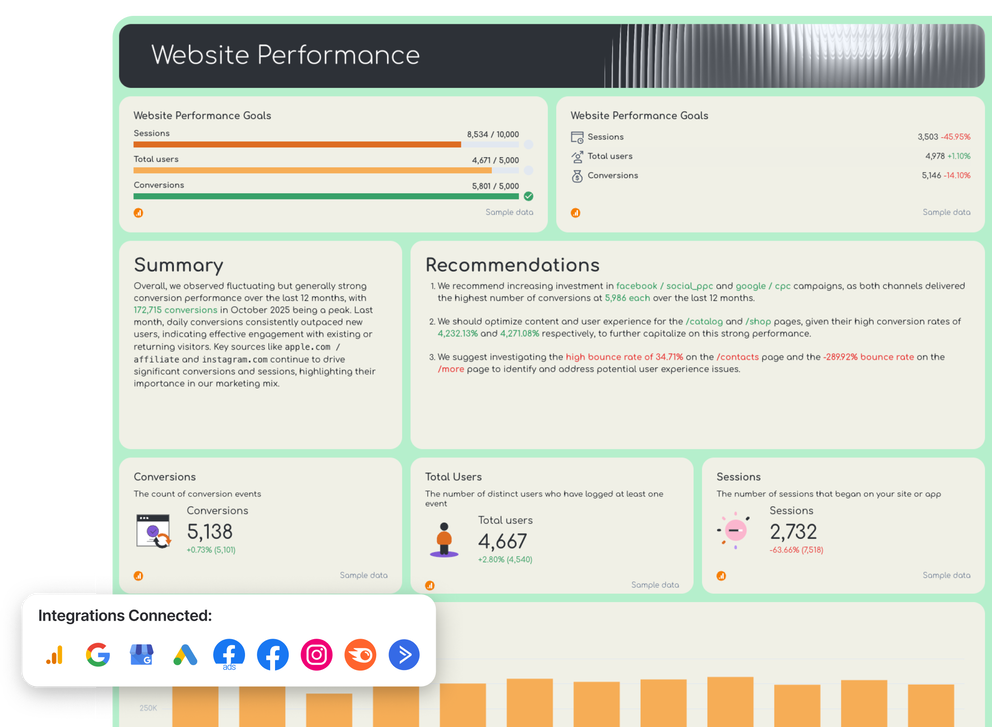
2. Website Performance

Purpose: Help clients or internal teams understand how traffic behaves once it hits the website.

What to include:

  • Sessions, users, and bounce rate (from Google Analytics)
  • Top pages by pageviews
  • Conversion path summary (goal completions or form fills)
  • Visual: Engagement by device or location
  • Visual: Trendline of traffic over time

Why it matters:

In-house teams can monitor content or product performance; agencies can highlight wins and areas to optimize without complex analytics dashboards.

3. SEO

Purpose: Track visibility and organic search performance over time, without sending clients to clunky Looker Studio dashboards.

What to include:

  • Organic sessions and impressions
  • Clicks and average CTR (from Google Search Console)
  • Keyword rankings and trend movement
  • Top landing pages from search
  • Visual: Keyword position change chart
  • Visual: CTR and impressions over time

Why it matters:

Good SEO reporting shows long-term growth. It also builds trust by explaining where rankings stand and why traffic is improving.

4. GEO

Purpose:

Track how much website traffic and conversions are coming from AI-powered search engines like ChatGPT, Perplexity, Bing Copilot, and others. This section helps surface how your content is being picked up and linked from generative AI platforms.

What to include:

  • Sessions from AI search engines (e.g. chat.openai.com, perplexity.ai)
  • Conversions influenced or initiated via AI sources
  • Top landing pages from AI-driven visits
  • Visual: Trend chart of AI traffic over time
  • Visual: Table listing out top performing content and how much each piece is bringing in traffic and conversions from AI sources

Why it matters:

As AI becomes a discovery channel, this is critical for content marketing teams and digital marketing agencies proving the ROI of top-of-funnel strategies. Including this in your white label dashboard shows clients or stakeholders you’re staying ahead of the curve.

5. Google My Business

Purpose: Measure local search visibility and interactions, perfect for franchises or businesses with physical locations.

What to include:

  • Total searches, views, and actions (e.g. direction requests)
  • Website clicks and phone calls from GMB
  • Profile views vs previous period
  • Visual: Bar or line graph of actions over time

Why it matters:

GMB reporting is often missing in legacy reporting platforms. Including it here adds tangible value for location-based clients.

Purpose:

Break down paid search performance in a clean, client-ready format — no excel exports or cluttered native UIs.

What to include:

  • Impressions, clicks, CPC, CTR, and cost
  • Conversions and conversion rate
  • Campaign-level performance table
  • Keyword-level data for top performers
  • Visual: Spend vs conversion trend
  • Visual: KPI summary chart

Why it matters:

Helps account managers and in-house teams prove how PPC campaigns are spending and how efficiently.

7. Facebook Ads

Purpose: Show how paid social campaigns contribute to results, with visuals clients can actually understand.

What to include:

  • Reach, impressions, clicks, spend
  • CTR, CPM, and cost per result
  • Campaign-level breakdown
  • Visual: Spend and result trends
  • Audience demographics for targeting insights

Why it matters:

A branded, readable Facebook Ads summary helps both agencies and internal marketers keep the narrative clear: here's what we spent, here’s what we got.

8. Organic Social Media

Purpose:

Track engagement and content reach across Facebook and Instagram, without needing multiple logins or tools.

What to include:

  • Follower growth by platform
  • Engagement rate and top-performing posts
  • Reach and impressions
  • Visual: Content performance by format
  • Visual: Post-level table with key metrics

Why it matters:

Clients want proof that your social media content drives value. This makes it simple to show engagement, not just post volume.

9. Email Marketing

Purpose:

Show the impact of email as a performance channel, especially for nurturing or ecommerce campaigns.

What to include:

  • Emails sent, open rate, click-through rate
  • Conversions from email campaigns
  • Visual: Trendline of sends vs opens
  • Top-performing subject lines or campaigns
  • Visual: Engagement by day/time (if available)

Why it matters:

Whether you're using HubSpot, CRM tools, or a custom API, email is still a revenue driver—and this report proves it.

Connect All Your Marketing Data in One Place

Bring all your marketing data into one place with no-code, stable connectors that you don't need to babysit. 

Why Marketers Love Reporting on Whatagraph

Whatagraph is easy to use, visually attractive, and much smoother compared to tools like Looker Studio.

Stef Oosterik

Stef Oosterik

Quality Manager @ Dtch. Digitals

StarStarStarStarStar

Whatagraph has become an essential partner for scaling our reporting, and my teams love it because it saves so much time. We’d recommend it to any team looking to automate data reporting and use AI for insights.

Danielle Roberts

Danielle Roberts

Director of Implementation & Support @ Rentable

StarStarStarStarStar

Whatagraph took us to the next level with our clients and within our team. Our relationships with clients have been amazing, and we’ve even been able to retain them longer.

Kim Strickland

Kim Strickland

Digital Marketing Specialist @ Peak Seven

StarStarStarStarStar

Whatagraph's AI is saving so much time and energy for our marketing specialists. We now have more time to focus on strategic things that help both our agency and our clients grow.

Lars Maat

Lars Maat

Co-Founder @ Maatwerk Online

StarStarStarStarStar

Frequently Asked Questions

Have more questions? We answered them here.

What is Whatagraph’s pricing?

Whatagraph offers flexible plans that scale with your reporting needs: 


Free plan


- Forever free


- Basic reporting with limited source credits


- Access to essential features and templates


Start plan (from ~$229/month, billed annually)


- 20 source credits


- Essential integrations


- Pre-made templates and data transformations


- Whatagraph IQ


- Live chat support


Boost plan (from ~$579/month, billed annually)


- 60 source credits


- Advanced integrations


- Custom data transformations


- White-label reports


- Dedicated Customer Success Manager


Max plan (custom pricing)


- 100+ source credits


- Premium integrations


- Advanced data aggregations


- Whatagraph IQ+


- Single Sign-On (SSO)


- Tailored onboarding and priority support


Plans can be upgraded in-app as your reporting needs grow.

What is a marketing report?

A marketing report is a structured summary of your campaigns, performance metrics, and KPIs across different channels. It helps teams and stakeholders understand what’s working, what’s not, and where to optimize efforts — whether you’re running PPC, SEO, email, or social media campaigns. 


With Whatagraph, you can build cross-channel marketing reports with AI in seconds, white-label them, and share them with stakeholders, saving you over 60 hours a month on reporting.

What is a white label dashboard?

A white label dashboard is a customizable, client-facing report view that hides the underlying reporting tool. It carries your branding — not the vendor’s — with your logo, fonts, colors, and even a custom domain. In Whatagraph, you can create fully branded dashboards and reports that look and feel like they’re built in-house, giving your agency or team a professional edge.

How do you generate a client report using a white label reporting tool?

With Whatagraph, creating white-labeled client reports is fast and scalable:


1. Connect your data sources — Google Ads, Meta, LinkedIn, Google Analytics, HubSpot, and more via built-in integrations.


2. Use a marketing report template or ask AI to generate a new one automatically based on the connected platforms.


3. White-label the report using AI: upload a brandbook or screenshot of a client’s website, or enter a prompt. Whatagraph will detect fonts, colors, and apply your own branding across the report.


4. Automate the report by scheduling PDF emails to go out at a specific time and cadence, or generate a live link you can send to clients or internal teams.


No more screenshots, spreadsheets, or jumping between tools — just polished, scalable, and on-brand client reports that take minutes, not hours.

What are the best white label reporting tools?

Here are 12:


1. Whatagraph — white label marketing monitoring and reporting platform
 

2. Metrics Watch — white label marketing analytics tool
 

3. Active Campaign — white label email marketing tool
 

4. SE Ranking — white label SEO software
 

5. Mention — white label media monitoring tool
 

6. SocialPilot — white label social media management tool
 

7. Semrush — white label SEO platform
 

8. HubSpot — white label marketing automation platform
 

9. Vendasta — white label ecommerce platform
 

10. Landingi — white label page builder
 

11. OptinMonster — white label lead generation tool
 

12. PromoRepublic — white label social media manager


We reviewed each one in this 12 best white label reporting tools article. 

Where can I find a white label marketing report template for my agency?

Right here — Whatagraph’s white label marketing report template is built for agencies managing multi-channel campaigns. It’s fully customizable with your logo, fonts, and colors, and includes sections for paid ads, SEO, email, social, and more. Just plug in your client’s data sources, and the report is ready to send—branded as your own.
 

What features should I look for in a white label marketing report template?

Look for a template that includes:


- Full branding control (logos, fonts, colors, custom domain)


- Multi-channel coverage (Google Ads, SEO, Facebook, LinkedIn, email, etc.)


- Reusable structure with editable widgets and KPIs


- AI-powered customization for styling and layout


- Automation to send reports on a schedule or via live links


- Built-in integrations to all your major data sources


- Room for summaries, insights, and annotations — not just charts


Whatagraph’s template checks all these boxes, so you can scale reporting without sacrificing quality or control.