Free AI Report Template

See exactly how you’re showing up in Generative AI platforms like ChatGPT, Perplexity, Gemini, and more.

Visualize key metrics, break down top performing pages, and compare GEO vs. SEO performance all in one AI report template.

AI Report Template - Dashboard with charts, graphs, and performance metrics in yellow and blue.

How to Use Whatagraph’s AI Reporting Template

Try Our Custom AI Report Generator

With Whatagraph IQ, just tell us what you need, and we'll build stunning reports for you with AI. No templates or manual setup needed.

What Features Should an AI Report Template Include?

1. Performance Summary

AI Report Template - Dashboard with performance metrics for AI sources, including views, sessions, and users.

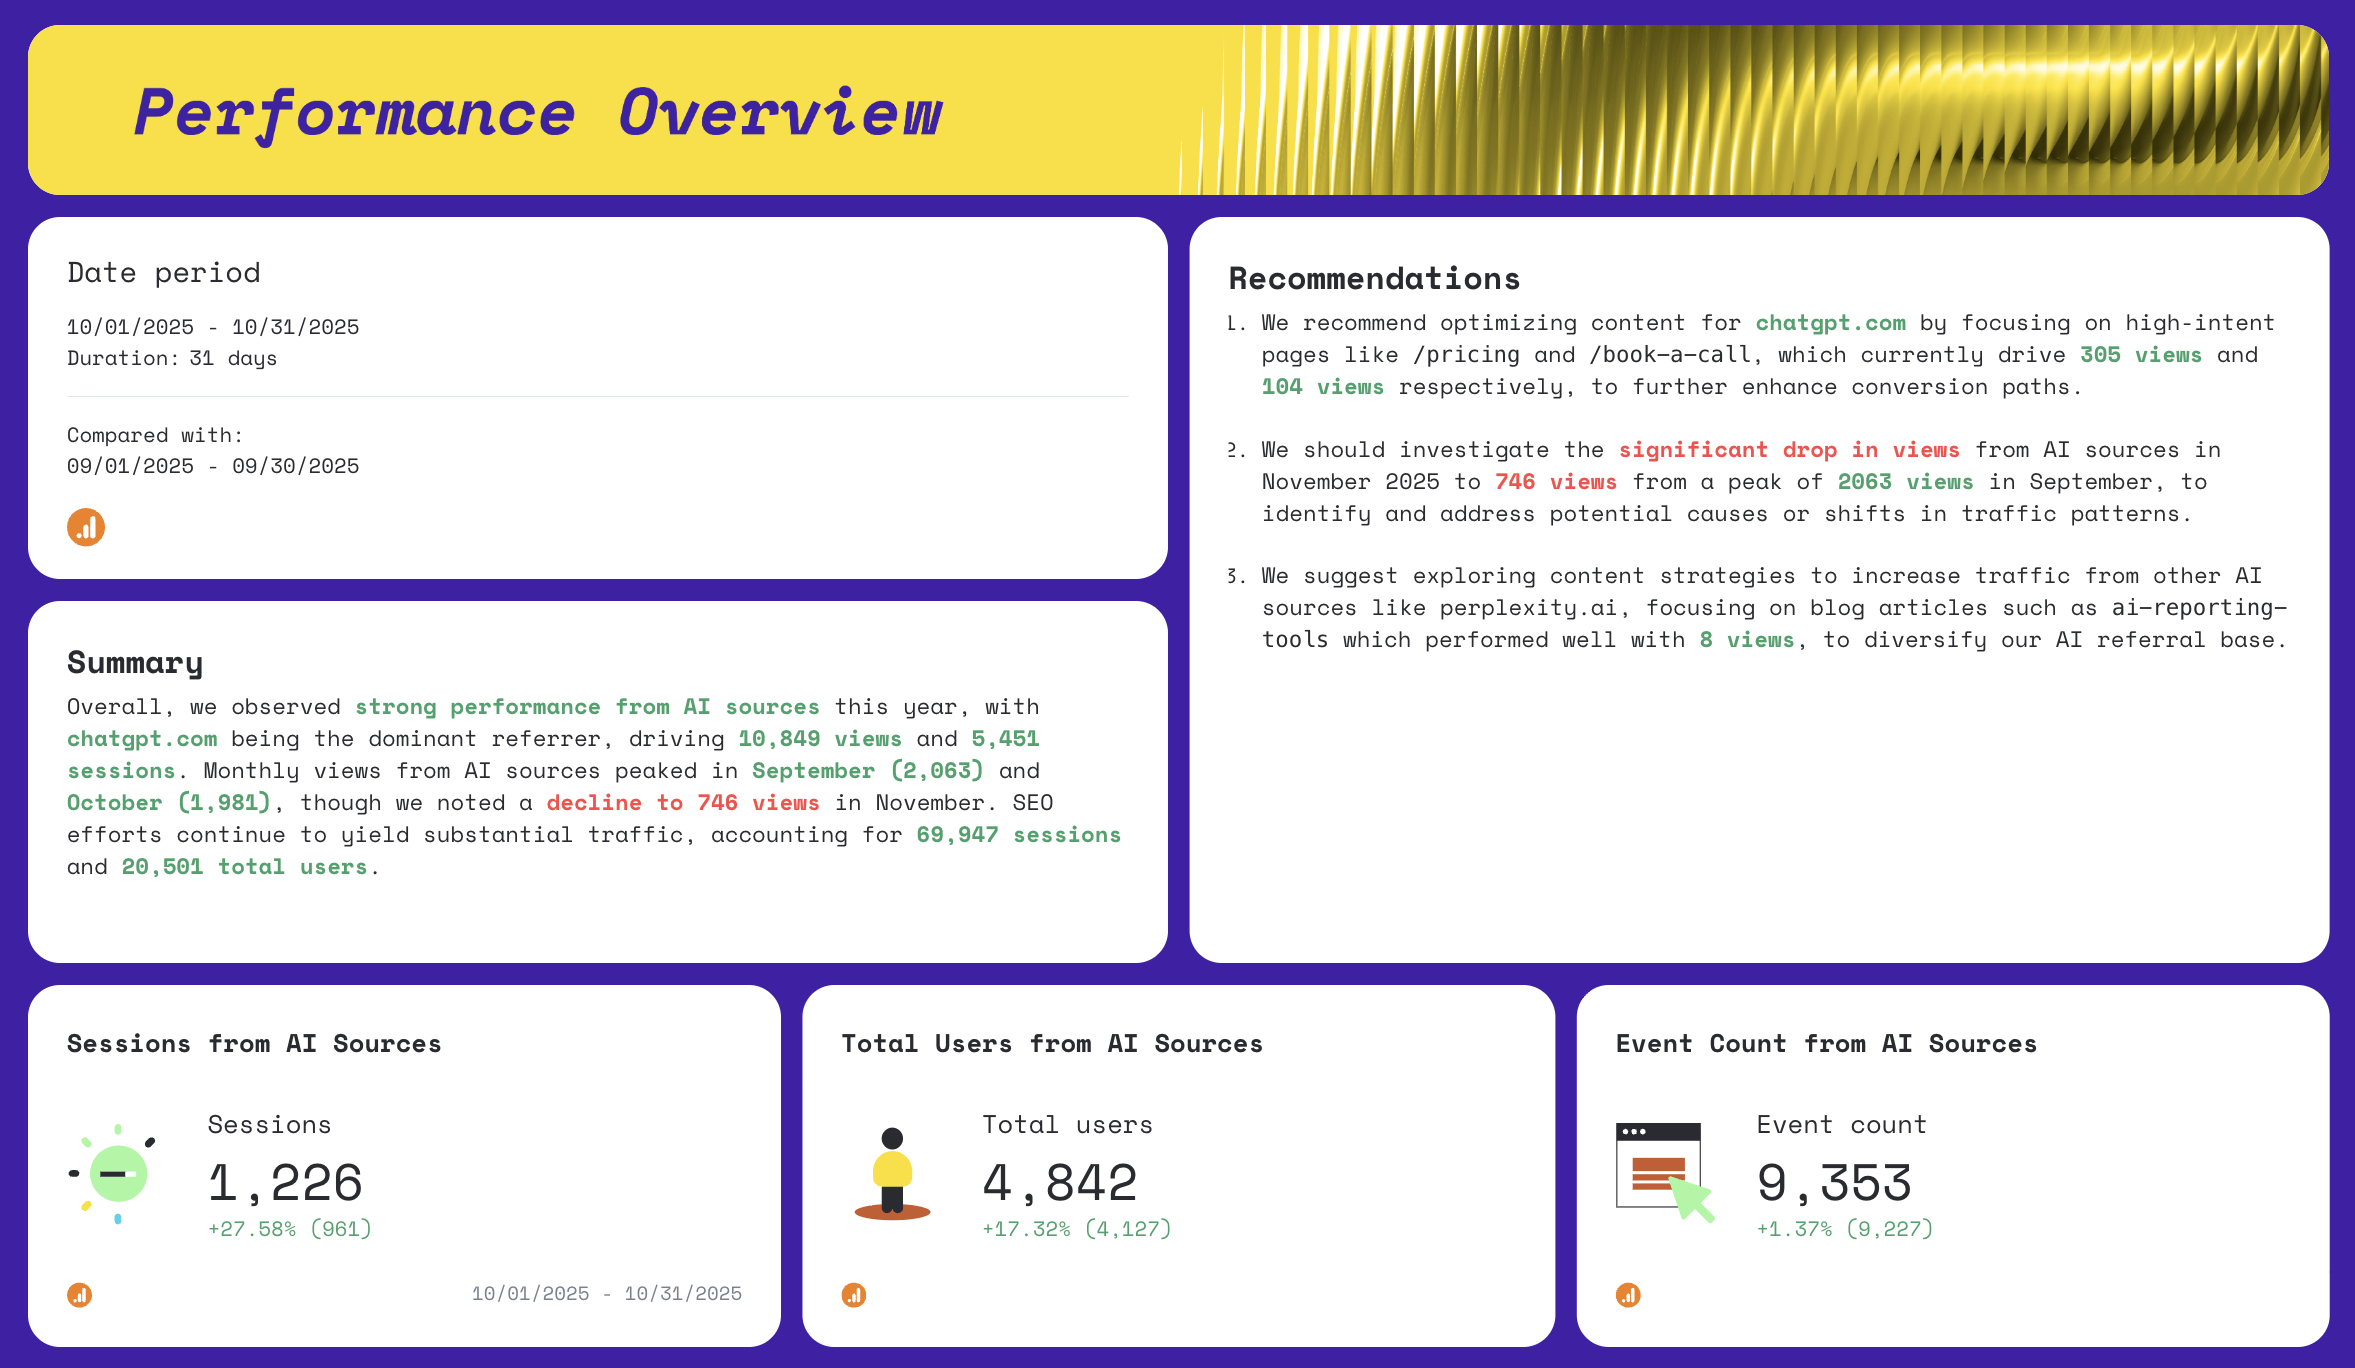
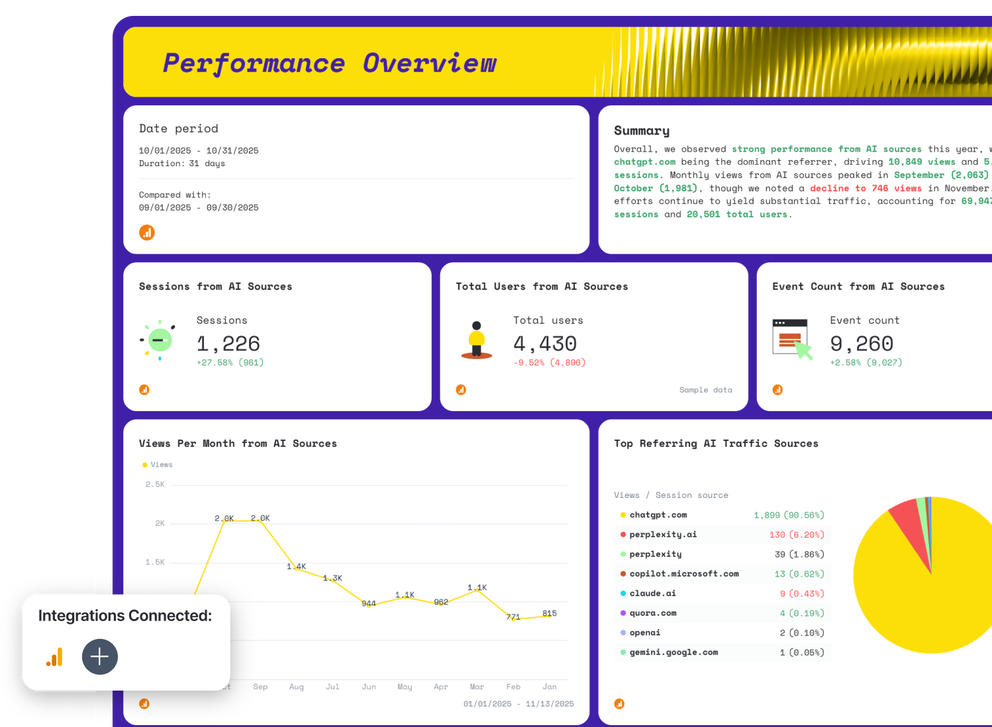
Start your AI report with a clear, data-backed overview of how traffic from AI sources performed during your selected date period.

Include:

  • A goal widget highlighting KPI progress such as sessions, total users, and event count from AI referrals
  • A performance summary list showing these metrics for the reporting range (e.g., “last 30 days”)
  • A text widget for insights, recommendations, summaries, and next steps
  • Single-value widgets showing sessions, total users, and event count from AI sources

With Whatagraph IQ Summary plugged directly into your AI project report template, you don’t need to write anything manually. IQ can generate complete summaries in 18 languages using your actual AI traffic data—no hallucinations, no inaccuracies. Just prompt it with something like: “Summarize this month’s AI referral performance and suggest next steps to improve traffic quality.”

Everything is editable, private, and happens inside Whatagraph, so you never risk sharing sensitive data with outside AI tools.

AI Report Template - Dashboard with line graph, bar chart, and pie chart showing performance metrics.

Include:

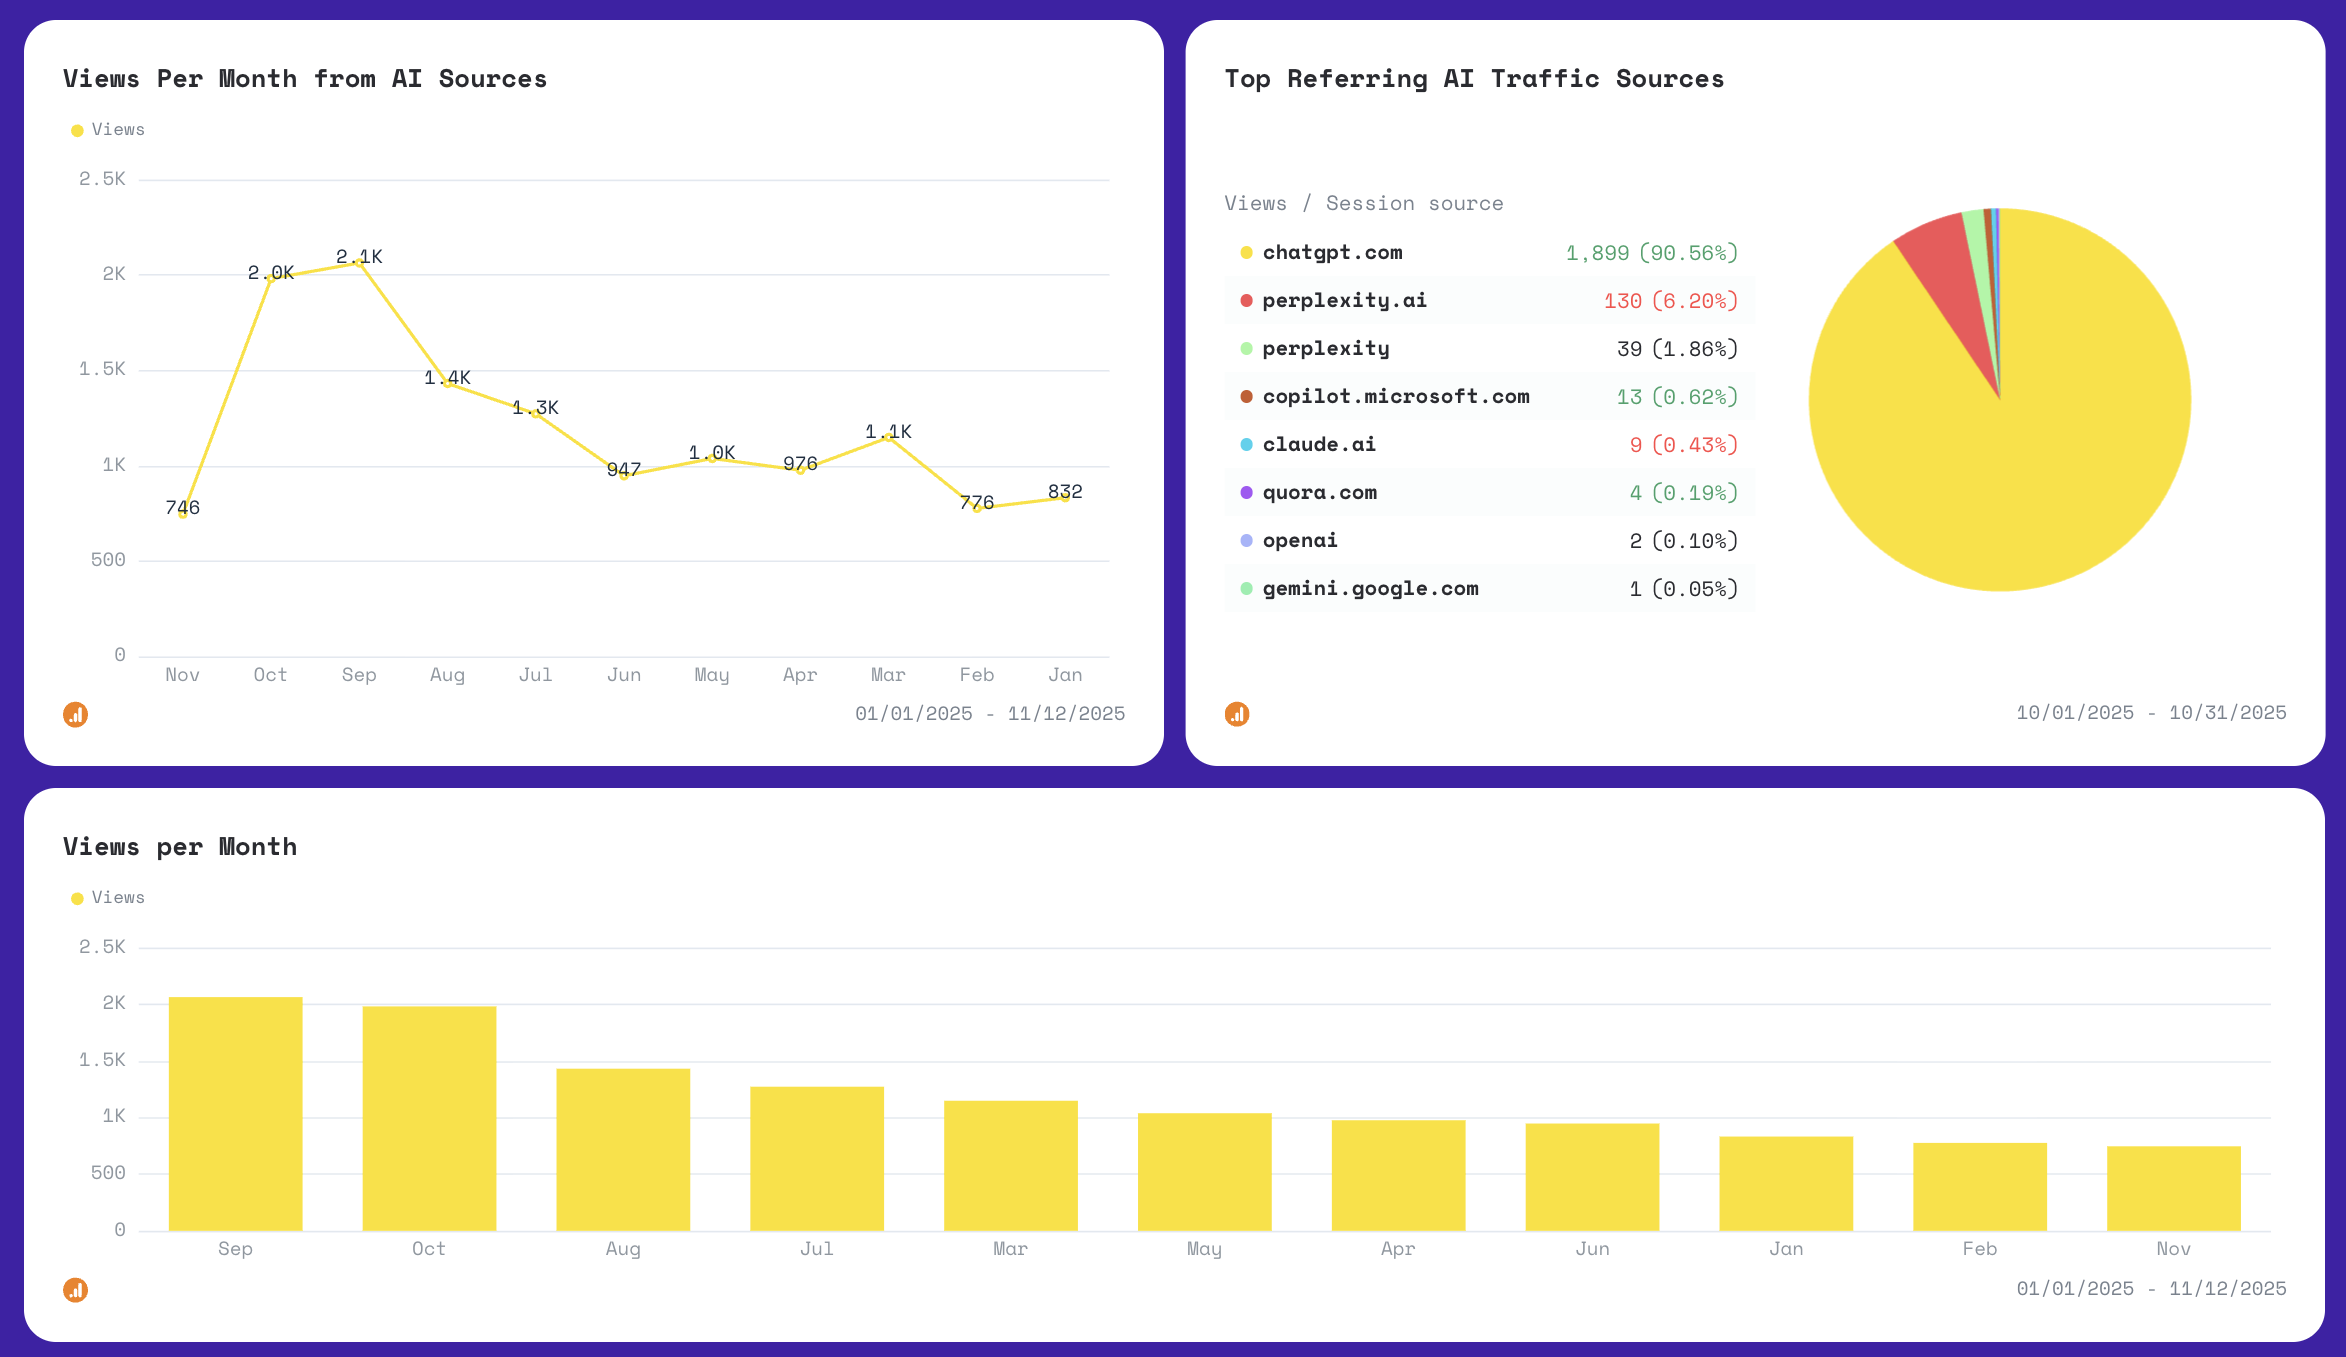
  • A line graph showing Views Per Month from AI Sources
  • A bar graph showing total monthly AI-driven views

These charts help you spot seasonal shifts, spikes from platforms like ChatGPT or Perplexity, and any drop-offs that need attention. Trend views are especially useful for teams monitoring experiment timelines, content launches, or campaign impacts.

Break down your AI referral traffic by platform to understand exactly where your audience is coming from.

Include widgets or tables covering:

  • Views
  • Sessions
  • Total users
  • New users
  • Event count

List out sources such as ChatGPT, Perplexity, Copilot, Claude, Gemini, Quora, and more.

Use a pie chart to visualize the traffic distribution, this instantly shows which AI engines are dominating and which long-tail sources are worth exploring further.

3. Session Breakdown Over Time

AI Report Template - Three tables comparing AI source session data, with column charts and percentage changes.

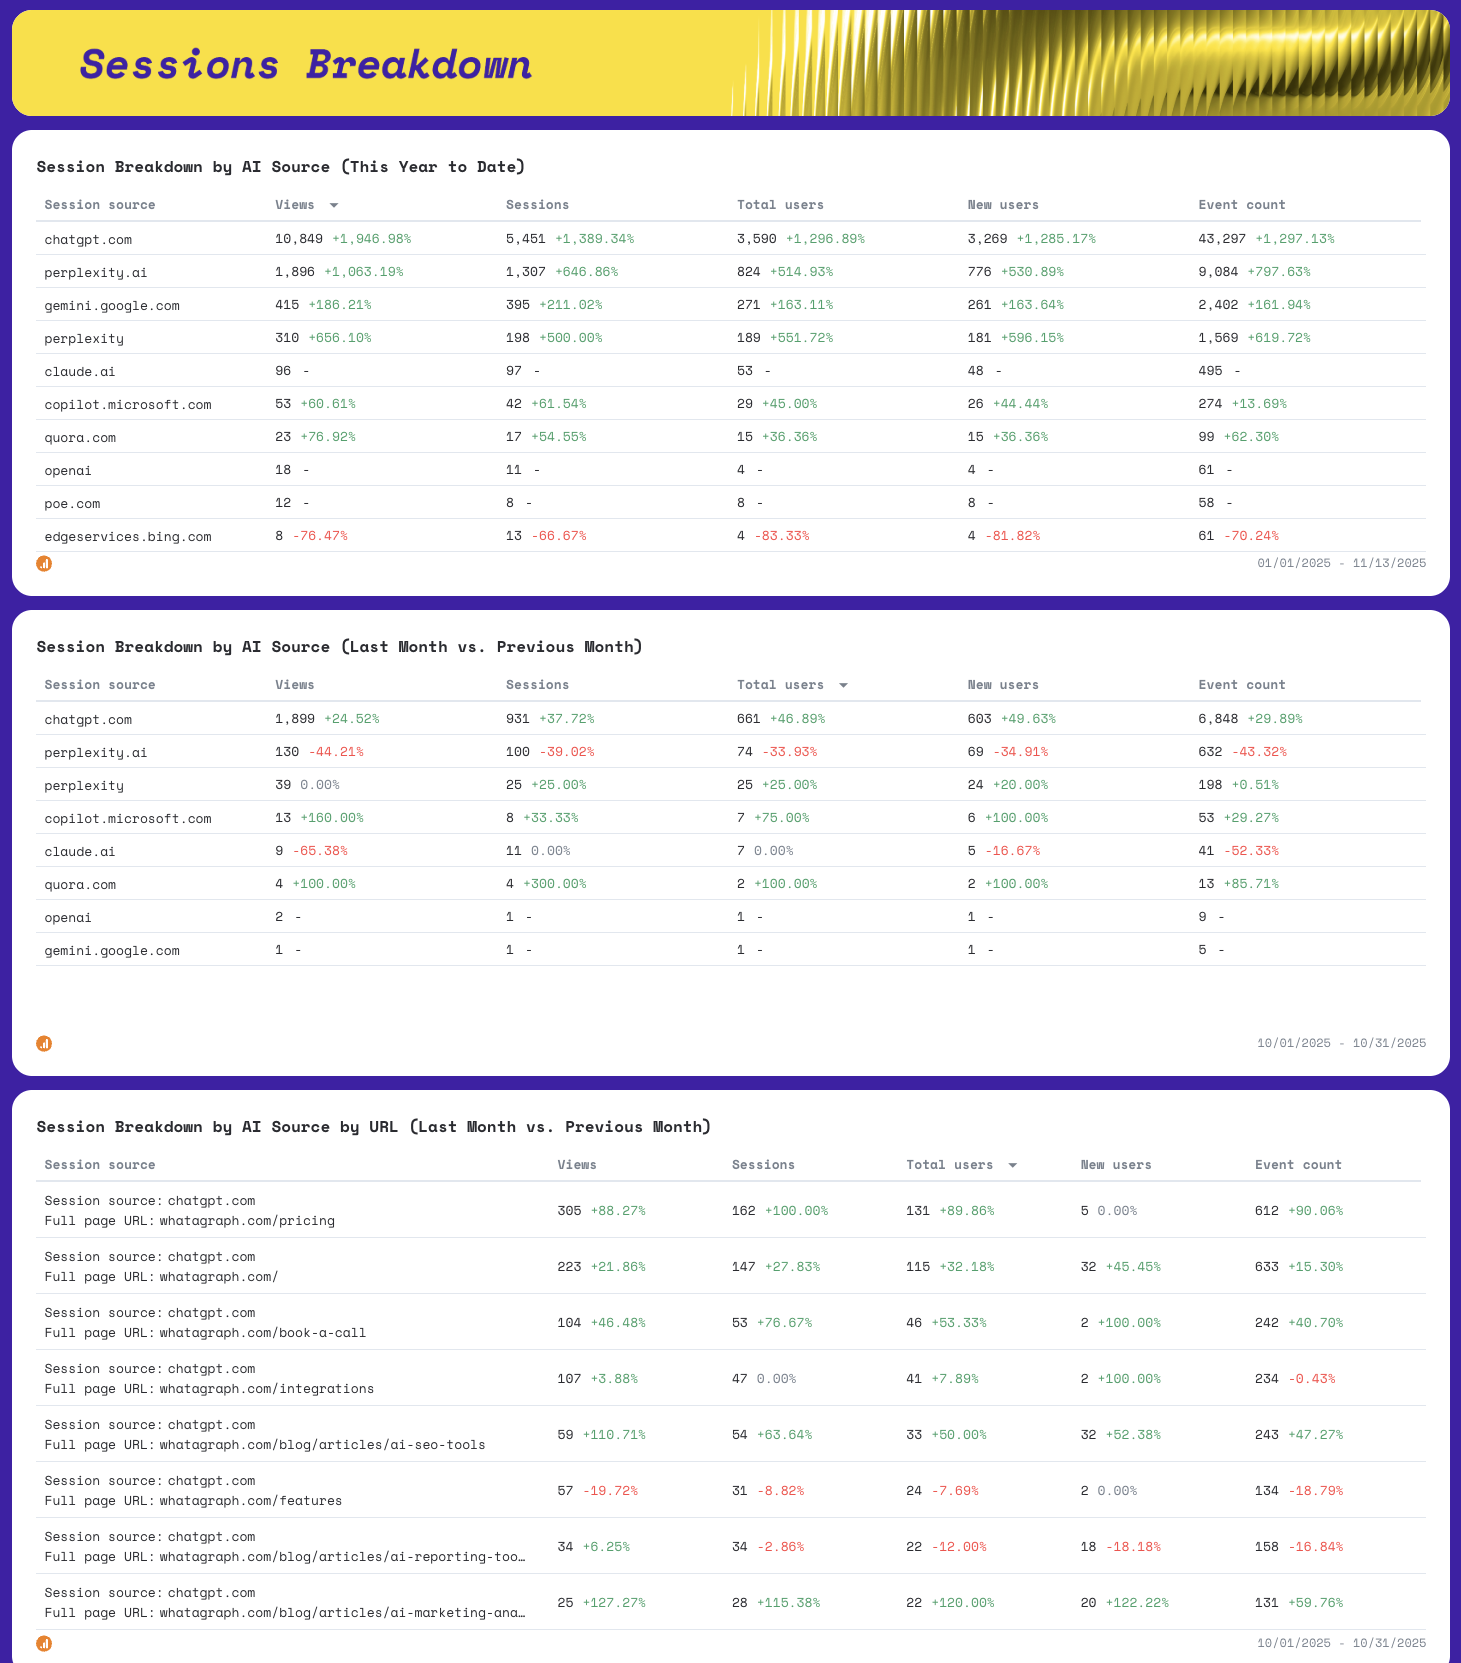
Go deeper with two comparison tables:

  • Session Breakdown by AI Source (This Year to Date)
  • Session Breakdown by AI Source: Last Month vs. Previous Month

These breakdowns help you understand long-term shifts as well as short-term changes in performance. Whether you’re validating a new SEO test or evaluating visibility in generative AI search engines, this view makes patterns impossible to ignore.

You can also add a Session Breakdown by URL, which shows which landing pages benefit the most from AI-driven traffic. This is extremely useful for optimizing formats, content depth, UX, or internal linking based on actual user behavior.

4. GEO vs. SEO Comparison

GEO Vs SEO - Comparison of GEO and SEO analytics with metrics and charts.

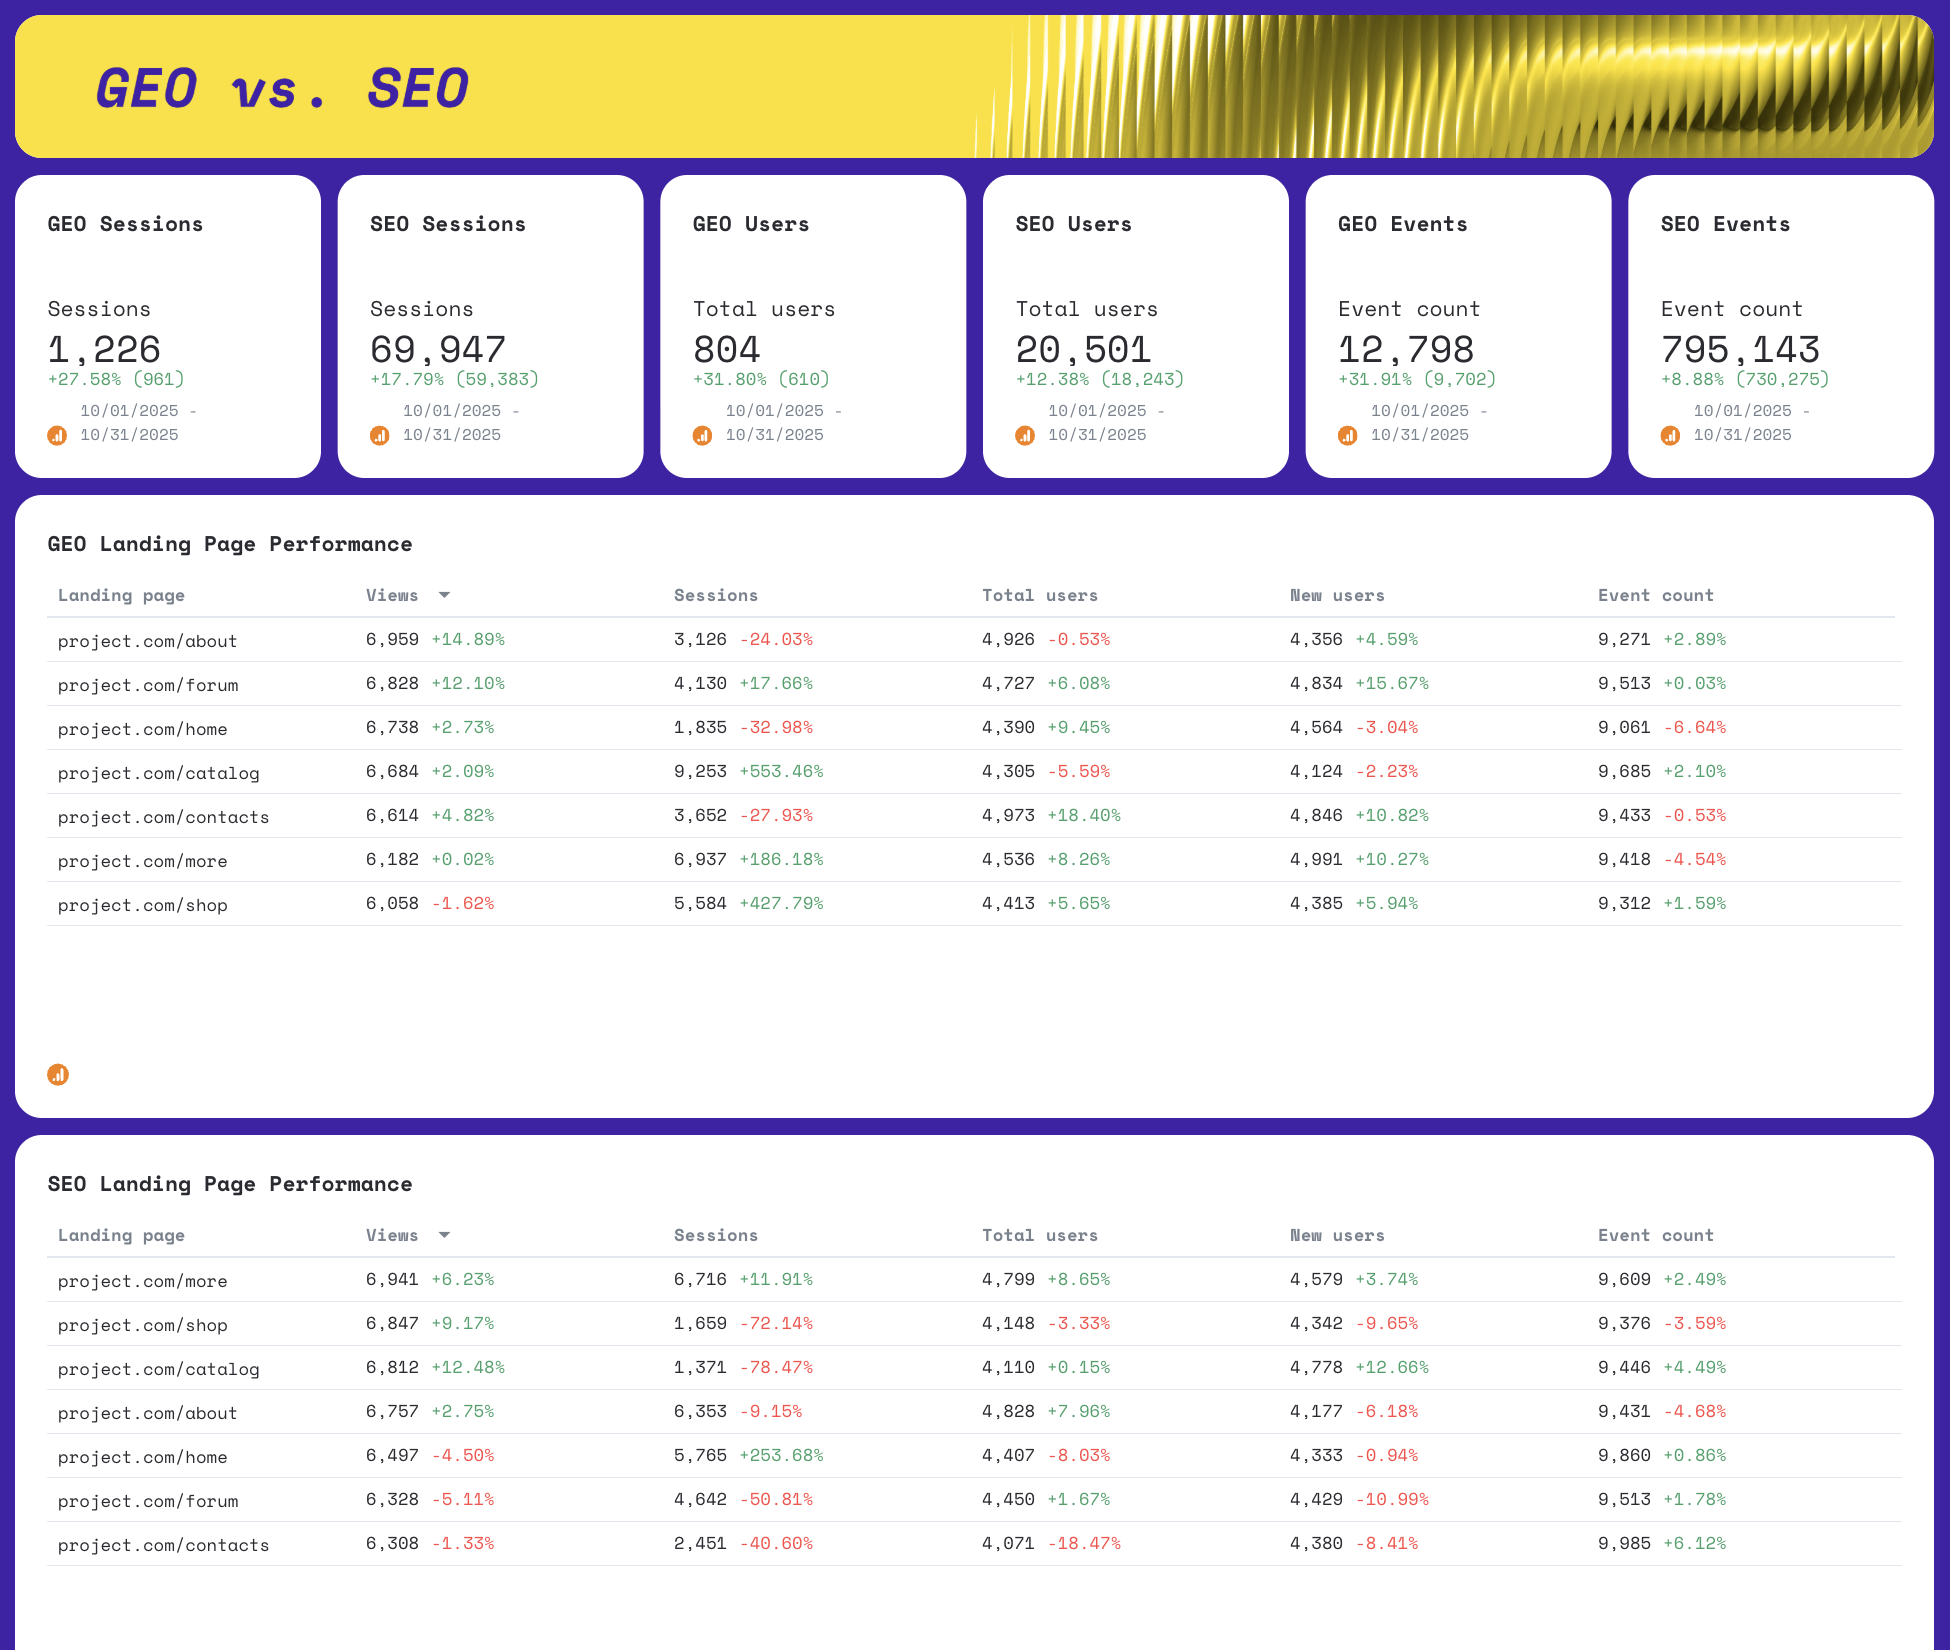
Wrap up your AI report template with a side-by-side view of AI traffic (GEO) versus search engine traffic (SEO).

Include:

  • GEO sessions, users, and event count
  • SEO sessions, users, and events
  • A landing page table for top-performing AI referral pages
  • A landing page table for top-performing Google SEO pages

This comparison helps you understand how your content performs across artificial intelligence discovery versus traditional search channels. It’s one of the most valuable sections for marketers who want to optimize for both generative AI visibility and organic search side-by-side.

Connect All Your Search, Paid Ads, and Social Data in One Place

Bring all your marketing data into one place with no-code, stable connectors that you don't need to babysit. 

Why Marketers Love Reporting on Whatagraph

Whatagraph is easy to use, visually attractive, and much smoother compared to tools like Looker Studio.

Stef Oosterik

Stef Oosterik

Quality Manager @ Dtch. Digitals

StarStarStarStarStar

Whatagraph has become an essential partner for scaling our reporting, and my teams love it because it saves so much time. We’d recommend it to any team looking to automate data reporting and use AI for insights.

Danielle Roberts

Danielle Roberts

Director of Implementation & Support @ Rentable

StarStarStarStarStar

Whatagraph took us to the next level with our clients and within our team. Our relationships with clients have been amazing, and we’ve even been able to retain them longer.

Kim Strickland

Kim Strickland

Digital Marketing Specialist @ Peak Seven

StarStarStarStarStar

Whatagraph's AI is saving so much time and energy for our marketing specialists. We now have more time to focus on strategic things that help both our agency and our clients grow.

Lars Maat

Lars Maat

Co-Founder @ Maatwerk Online

StarStarStarStarStar

Frequently Asked Questions

Have more questions? We answered them here.

Is there an AI that can write reports?

Yes, with AI-powered reporting tools like Whatagraph IQ, you can just ask our AI to create a report from scratch based on your connected accounts like Google Analytics. 


We'll automatically pull that data and visualize key metrics neatly in widgets, charts, and graphs – without you having to build anything from scratch.


If you need to edit or change these widgets, you can again ask our AI to do it for you with just simple prompts and it will be done in seconds. 


Whatagraph IQ Chat will also write performance summaries in different content formats like “Summary”, “Recommendations”, “Wins”, “Issues”, e.t.c., and in 18 different languages – based on the data on your report. This means no hallucinations and no data breaches as your data stays safe in Whatagraph instead of being transferred over to a third-party platform like ChatGPT. 


Time to style your reports? You no longer need to do it manually. Just upload a screenshot of your website or brandbook – or type in a prompt like “Make it look like a Batman movie” and Whatagraph will automatically apply the colors and fonts to your report. 


With Whatagraph IQ+, you can even ask AI to create custom dimensions for you just by simply writing out a prompt. 


All this means you don't have to do the heavy lifting anymore when it comes to creating reports. Whatagraph's AI will take care of everything for you.

How to generate an AI report?

With Whatagraph, you can create an AI report in two easy ways:


Option 1: Use a ready-made template


  1. Start free, create an account, and set your password.
  2. Connect your data source.
  3. Pick a report template from our template library based on your specific needs and your report is ready instantly.


Option 2: Use Whatagraph IQ


  1. Start free, create an account, and set your password.
  2. Connect your data source.
  3. Choose “Create a report with IQ.”
  4. Type a prompt like “Create an AI referral traffic report”, and Whatagraph IQ will build the full report using AI—widgets, charts, graphs, and all—within seconds based on your connected data.


Both options let you generate accurate, professional reports without the heavy lifting.

Can ChatGPT generate reports?

ChatGPT can write content for your reports, but it can’t automatically pull your performance metrics or visualize graphs on its own. 


If you want a full AI-based report with real-time data, widgets, charts, and automated summaries, platforms like Whatagraph give you a much more complete solution.

What is an AI marketing report generator?

An AI marketing report generator is a tool that uses generative AI to analyze your marketing data and turn it into comprehensive reports that visualize key metrics and trends, and gives you actionable insights. 


It’s ideal for marketers who want fast, consistent reporting without manually writing explanations, tracking campaign performance, or building custom report templates from scratch.

Why use an AI report generator?

An AI report generator takes care of the heavy lifting—summaries, insights, formatting, and explanations—so you can save time and focus on decision-making. It automates repetitive writing tasks, reduces human error, and turns raw metrics into actionable insights your team members and stakeholders can understand instantly.

How do I customize an AI report template for my needs?

It’s super easy to customize an AI based report template on Whatagraph.


Say for example you want to edit a widget, all you need to do is type in a prompt of what you would like to edit, and our AI will do it for you automatically. 


Or if you’d like to style your report with custom fonts or colors, you can either:

  1. Type in a prompt
  2. Upload a screenshot of your brandbook / website e.t.c
  3. Or adjust fonts and colors manually


For the first two options, Whatagraph’s AI will automatically apply the fonts and colors in your screenshot or prompt to your entire report. 


Whatagraph’s reports also come with a ton of customization options like:

  • Adding header and footers to reports
  • Changing titles and descriptions of widgets
  • Adding new rows anywhere in the report
  • Adding icons to widgets and changing the colors of icons

What are the best AI tools for creating report templates?

Some of the best AI tools for creating report templates include:


  1. Whatagraph
  2. Klipfolio
  3. NinjaCat
  4. Venngage
  5. Easy-Peasy.AI
  6. Piktochart
  7. Tableau
  8. Power BI
  9. Domo


We reviewed them all extensively in this AI reporting tools article, including key features, pros and cons, and pricing.

What are the benefits of using an AI report template?

An AI report template is the easiest way to automate report creation and get actionable insights, fast, without starting from scratch every time. You get consistent formatting, user-friendly visualization, real-time data, editable summaries, and one place to track metrics across different platforms—making it ideal for startups, teams, or anyone producing business reports regularly.