Visualize any data in Whatagraph using Custom API, Google Sheets, or BigQuery
When your data source is not yet in the list of native integrations. Multiple ways to connect it to Whatagraph, visualize and share the data.


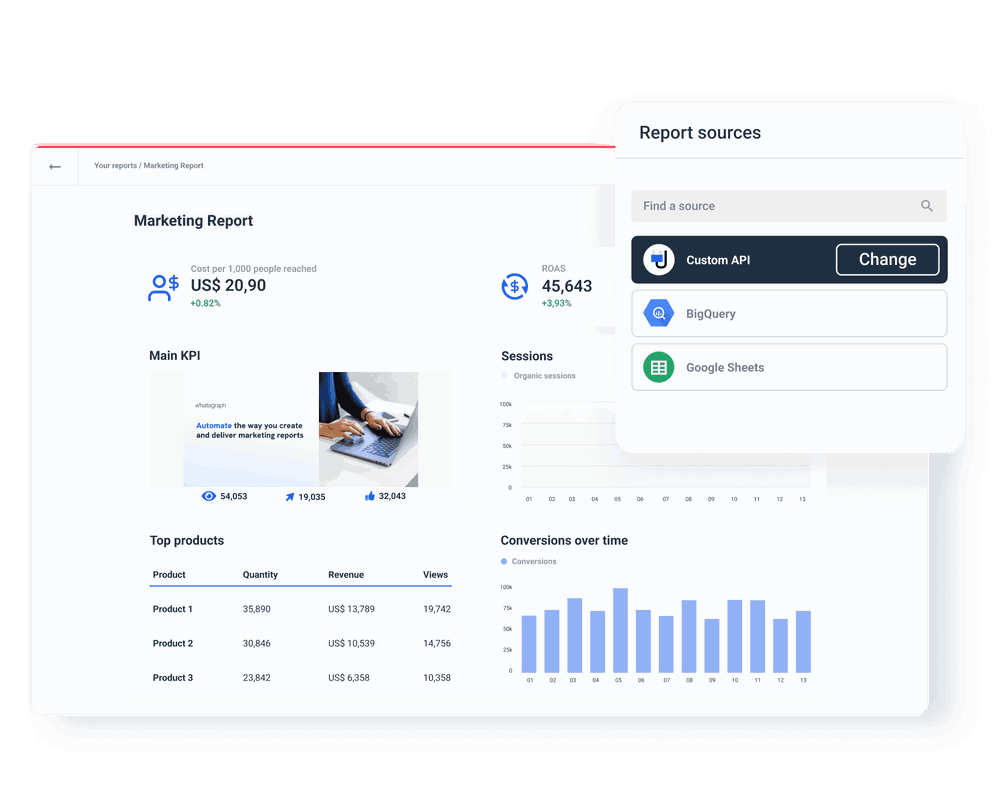
Connect any data source via the Custom API, Google Sheets, or a data warehouse
Easily bring in data from rare, niche, or any other source on par with native integrations
For marketers who work with custom metrics specific to a client or a niche tool on top of typical marketing sources.
Whatagraph provides an option to connect that source directly via the Custom API. Or pull data from intermediaries like Google Sheets or Google BigQuery.
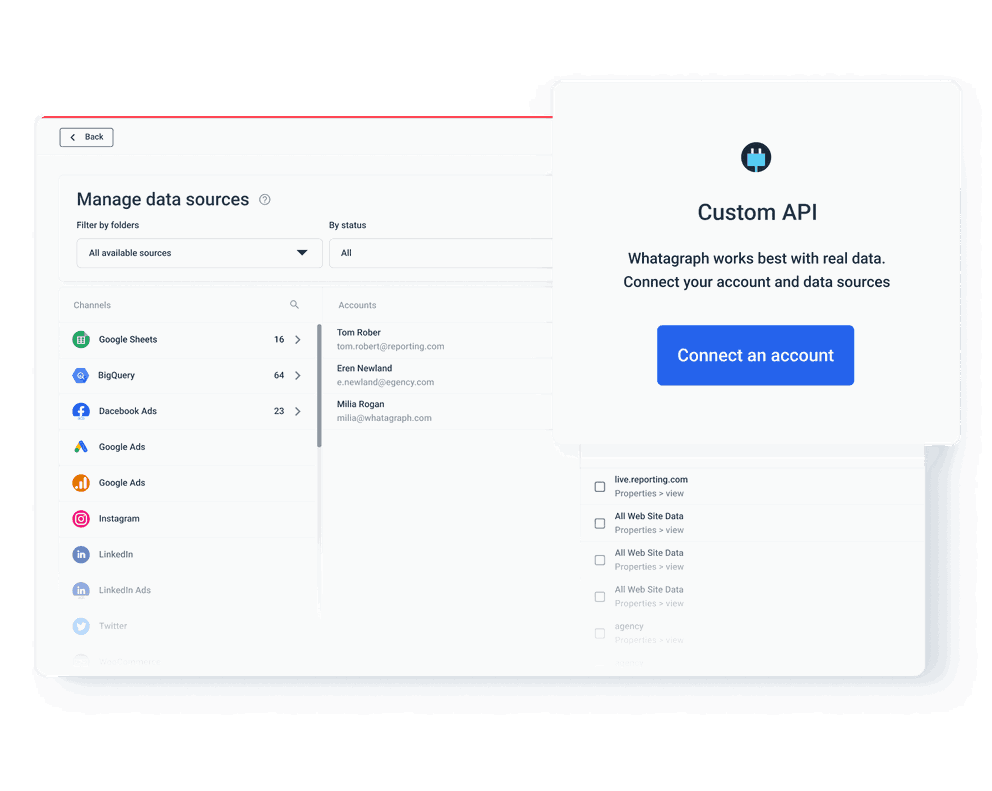


Direct connection with the Custom API
Public API provides the same reporting and monitoring functionality as native integrations. You'll need a developer to establish a direct connection with your source of choice if it has a public or private API too.
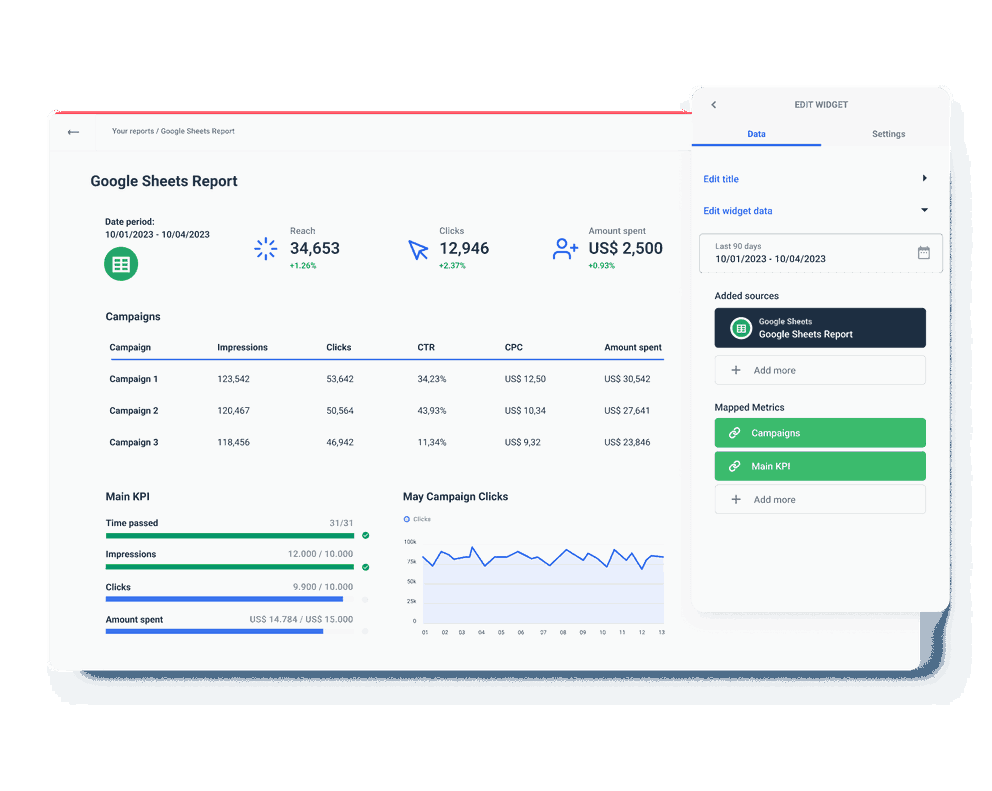
Google Sheets integration
Visualize data that is structured in a spreadsheet. Use Whatagraph to pull data that you organized and customized on the Google Sheets' side into reports and widgets for visualization.
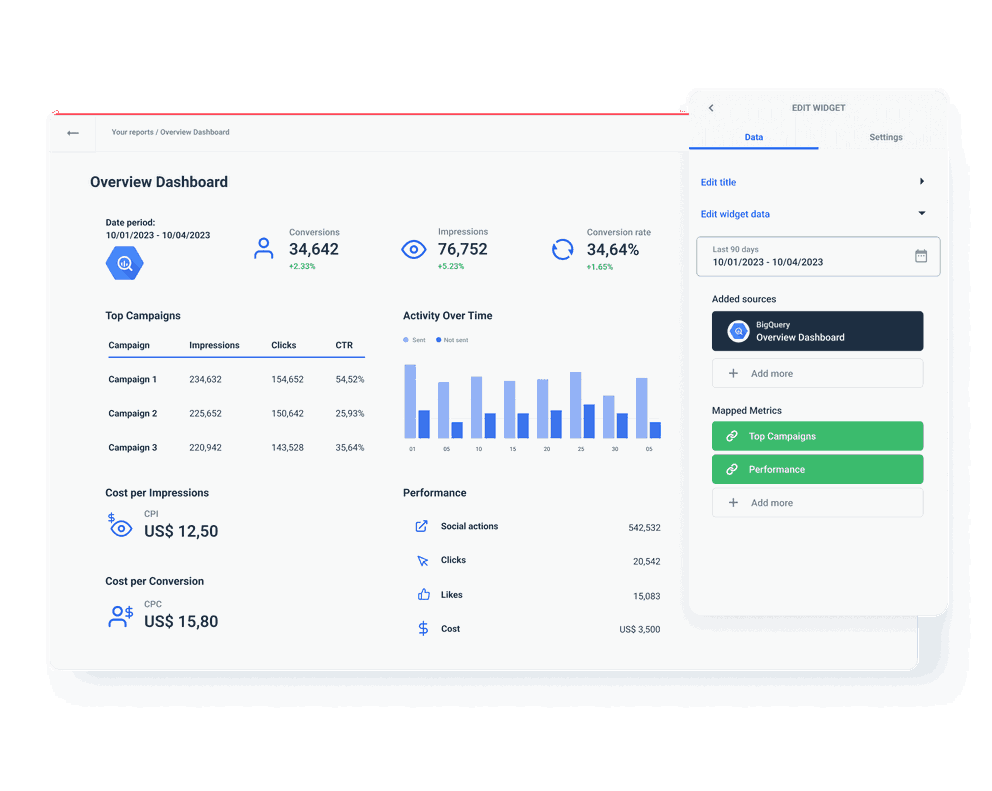
Google BigQuery integration
Cloud data warehouses like BigQuery allow users to upload and store huge datasets and work with it much quicker. Pull and visualize data from Google BigQuery similar to Google Sheets.
You can also use Whatagraph to transfer your marketing data to Google BigQuery
What others think about Whatagraph
I made a switch from GDS and Sheets for reporting to Whatagraph, and I am saving literal hours each week on performance report creation. Our small firm actually managed to onboard 2 new clients as a result of all the time we saved on managing data and reporting. The customer service is also really helpful and easy to reach.

Capterra verified review by
Mindaugas S., Marketing Consultant
Having active customer support to help fix any issues was a big contributor, but we also really liked the ability to save templates and connect sources to multiple charts/widgets at once without having to edit them individually. And having the grid layout is much easier to stay consistent with than the free form setup that Data Studio has.

Capterra verified review by
Nico T., Media Planner
The system has standard templates that are easy and fast to use. Also you can build your own report with lightning speed. It is very easy to use, has a lot of integration, and let get started very fast.

Capterra verified review by
Rasmus Bernt K., External Senior Management Consultant
We love Whatagraph - we would definitely recommend and our account manager is great! I love how easy this tool is to use, everyone on the team finds it much more user-friendly than other dashboards. Integration was easy, we sent some example reports to the team who duplicated these for us. We literally had to log in and send it to our clients!

Capterra verified review by
Stephanie S., Digital Director
We are showing our clients the work that we're doing for them and this is incredibly important for our clients ROI. They want to see results and having a tool like Whatagraph that can show data from virtually every source we use is hugely important.

Capterra verified review by
John S., SEO Strategist
The tool is easy to use; you do not need to have development resources. Even my junior project managers are capable of making campaign reports in minutes. There are a lot of pre-made templates you can use as well as many pre-made widgets.

Capterra verified review by
Erman E., Marketing Specialist
Really easy to connect data sources within the tool. The library of report templates has been helpful. The customer support team has been responsive to all of our needs. Our team enjoys the simplicity of setting up the reports and how the data is presented.

Capterra verified review by
Brent N., Director of Operations
Easy to create really beautiful graphs and reports which can help other team members to understand the most important takeaways. I especially like the automated report function, so I don't have to check on the same thing repeatedly.

Capterra verified review by
Orsolya S., Online Marketing Manager
Read more reviews on:


Built for marketing professionals like you