Google Analytics 4 (GA4) Integration
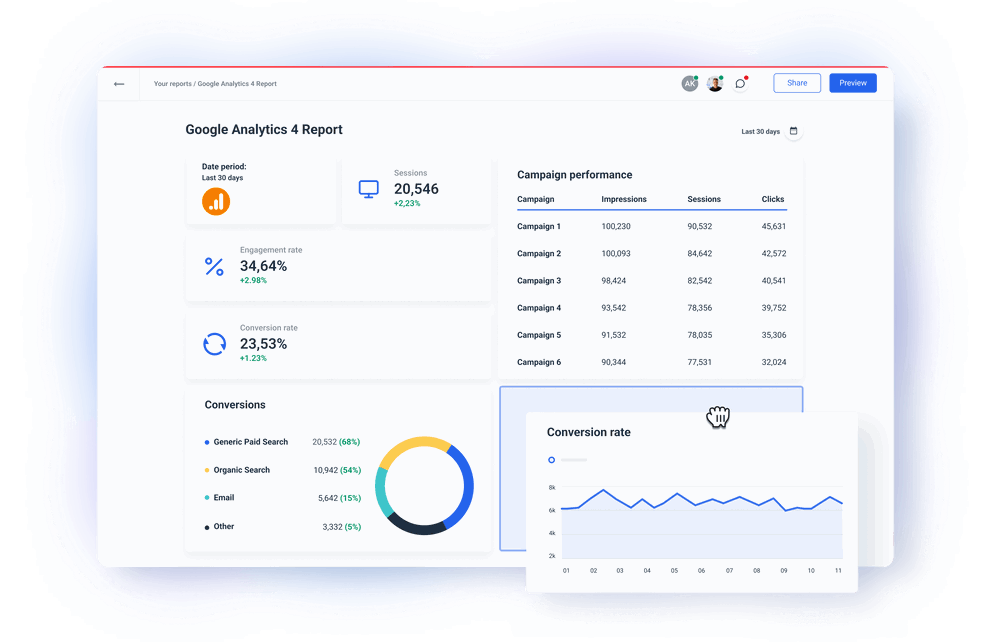
Connect your Google Analytics 4 data to Whatagraph to analyze and share the performance of your Google Analytics 4 campaigns. A fully managed Google Analytics 4 integration pulls data directly from your GA4 account to stunning custom dashboards. Effortlessly analyze web page views, average time on site, and other user behavior data points. Organize Google Analytics 4 metrics before visualization to present only the most impactful data points. Share insights from your marketing data automatically as scheduled emails or live links.
Manage all your Google Analytics 4 metrics via a direct connection to Google Analytics 4 API

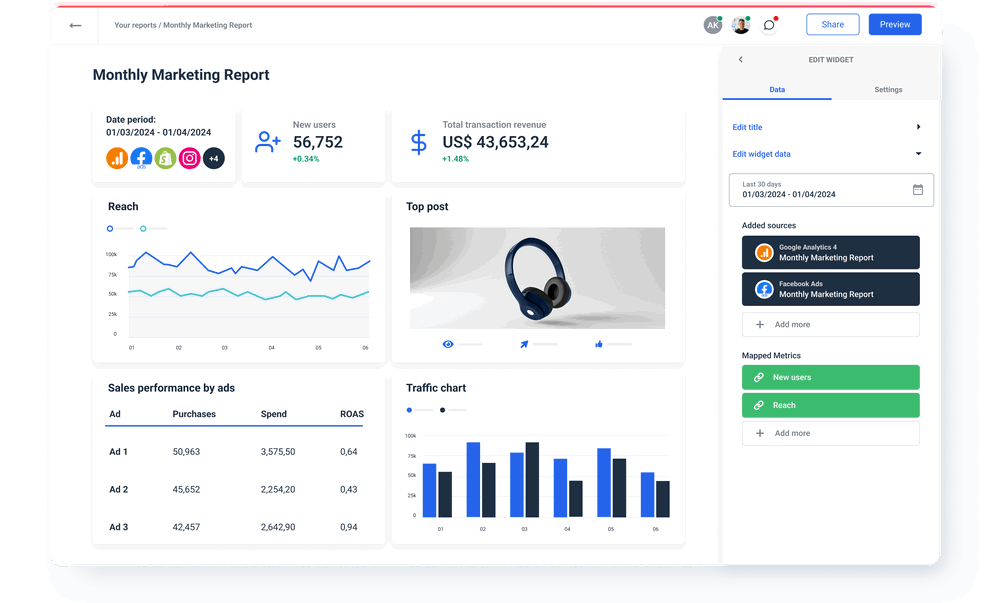
Blend your GA4 data with insights data from other marketing channels
GA4 metrics available instantly in Whatagraph
All
GA4 User
24GA4 Engagement
9GA4 Ecommerce
48GA4 Conversions
2GA4 Ads
9GA4 Search
4Search...

Sessions
Sessions per user
Returning users (%)
Returning users
New users (%)
Engaged sessions
Engagement rate
New users
Total users
Active users
User engagement
7-day active users
28-day active users
1-day active users
Engaged sessions per user
Average session duration
Bounce rate
Crash-affected users
Crash-free users rate
DAU / MAU
DAU / WAU
User conversion rate
WAU / MAU
Average engagement time
Event count
Event count per user
Event value
Events per session
Scrolled users
Views per user
Views
Views per session
Session conversion rate
Transactions
Total revenue
ARPPU
ARPU
Cart-to-view rate
Checkouts
Ecommerce purchases
First time purchasers
Item list click through rate
Item list clicks (deprecated)
Item list views (deprecated)
Item promotion click through rate
Item promotion clicks (deprecated)
Item promotion views (deprecated)
Item purchase quantity (deprecated)
Item revenue
Item views (deprecated)
Purchase revenue
Purchase-to-view rate
Average purchase revenue
Add-to-carts
Refund amount
Total purchasers
Item refund amount
Transaction rate
Average purchase revenue per user
First-time purchaser conversion
First-time purchasers per new user
Item list clicks
Item list views
Item views
Items added to cart
Items checked out
Items clicked in list
Items clicked in promotion
Item purchase quantity
Items viewed
Items viewed in list
Items viewed in promotion
Item promotion clicks
Item promotion views
Purchaser conversion
Return on ad spend
Shipping amount
Tax amount
Transactions per purchaser
Gross item revenue
Gross purchase revenue
Conversion rate
Conversions
Ads clicks
Ads cost
Ads cost per click
Cost per conversion
Ads impressions
Ad unit exposure
Total ad revenue
Publisher ad impressions
Publisher ad clicks
Organic google search average position
Organic google search click through rate
Organic google search clicks
Organic google search impressions
Check out related integrations:


Explore marketing automation and custom report features


Frequently Asked Questions
Do I need Looker Studio to visualize Google Analytics 4 data?
No, you don’t need Looker Studio (Google Data Studio) or any other tool to visualize your Google Analytics 4 data. Whatagraph is an all-in-one marketing data platform to connect, organize, visualize, and share all your data. This makes Whatagraph a better choice than other data platforms that provide only the data collection functionality, requiring users to use a separate visualization tool.
How to connect Google Analytics 4 data to Whatagraph?
Whatagraph has a pre-built GA4 connector, so you don’t have to purchase and configure third-party data connectors. Adding a new Google Analytics 4 source is simple:
1. Go to the Data Sources menu and locate Google Analytics 4 among the channels.
2. Click Connect an account.
3. From there, you’ll be redirected to log in to your Google Analytics 4 account.
4. Once forwarded to Google, choose to trust Whatagraph to access your account.
5. The new Google Analytics 4 source will appear.
You have successfully created a connection to your GA4 API. Create a custom report or dashboard and add your Google Analytics 4 account as a source.
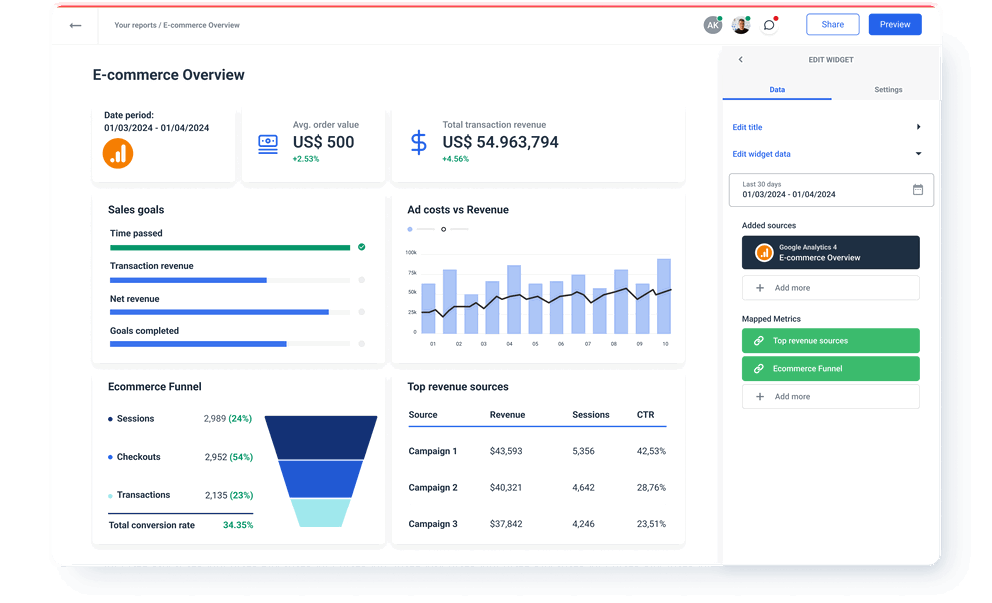
When you connect GA4 data to Whatagraph, you can organize datasets to get more granular insights by device, campaign ID, date, etc. You can visualize data in various widgets and share the insights via automated email attachments or live links for near real-time access.
Can I export data from Google Analytics 4 reports?
Yes, you can export data from reports and individual widgets as Excel spreadsheets or CSV files. This way, you can easily move it to Tableau, Power BI, or other data destinations for further analysis.
What other marketing data sources can I connect with Whatagraph?
You can connect a range of popular marketing platforms like Universal Analytics, social media like Facebook Page and LinkedIn, PPC like Google Ads, Microsoft Advertising, Pinterest Ads, CRMs like Salesforce and HubSpot, as well as SEO, email marketing, and e-commerce platforms.
What is the difference between third-party GA4 connectors and fully managed GA4 integrations?
A data connector is a piece of software, typically built by a third party, to connect two different platforms.
On the other hand, Whatagraph’s integration directly connects to Google Analytics 4 API with no third-party software in the middle. As a result, the data flow is more stable and secure, and the connection performance doesn’t depend on the policies of third-party vendors.


What others think about Whatagraph
I made a switch from GDS and Sheets for reporting to Whatagraph, and I am saving literal hours each week on performance report creation. Our small firm actually managed to onboard 2 new clients as a result of all the time we saved on managing data and reporting. The customer service is also really helpful and easy to reach.

Capterra verified review by
Mindaugas S., Marketing Consultant
Having active customer support to help fix any issues was a big contributor, but we also really liked the ability to save templates and connect sources to multiple charts/widgets at once without having to edit them individually. And having the grid layout is much easier to stay consistent with than the free form setup that Data Studio has.

Capterra verified review by
Nico T., Media Planner
The system has standard templates that are easy and fast to use. Also you can build your own report with lightning speed. It is very easy to use, has a lot of integration, and let get started very fast.

Capterra verified review by
Rasmus Bernt K., External Senior Management Consultant
We love Whatagraph - we would definitely recommend and our account manager is great! I love how easy this tool is to use, everyone on the team finds it much more user-friendly than other dashboards. Integration was easy, we sent some example reports to the team who duplicated these for us. We literally had to log in and send it to our clients!

Capterra verified review by
Stephanie S., Digital Director
We are showing our clients the work that we're doing for them and this is incredibly important for our clients ROI. They want to see results and having a tool like Whatagraph that can show data from virtually every source we use is hugely important.

Capterra verified review by
John S., SEO Strategist
The tool is easy to use; you do not need to have development resources. Even my junior project managers are capable of making campaign reports in minutes. There are a lot of pre-made templates you can use as well as many pre-made widgets.

Capterra verified review by
Erman E., Marketing Specialist
Really easy to connect data sources within the tool. The library of report templates has been helpful. The customer support team has been responsive to all of our needs. Our team enjoys the simplicity of setting up the reports and how the data is presented.

Capterra verified review by
Brent N., Director of Operations
Easy to create really beautiful graphs and reports which can help other team members to understand the most important takeaways. I especially like the automated report function, so I don't have to check on the same thing repeatedly.

Capterra verified review by
Orsolya S., Online Marketing Manager