The Ultimate Website Dashboard for Web Analytics
A quick and easy way to show the most important data about your website in one place. Stop juggling 20 different dashboards - Present your crucial website metrics in Whatagraph’s website dashboard.


What is a website dashboard?
A website dashboard is a user-friendly visual tool that displays an overview of your key website metrics. It usually includes traffic, performance, and user behavior data. This dashboard helps you monitor and manage your site’s activity, making data-driven decisions easier and faster.
Use our web dashboard to track your clients' online performance
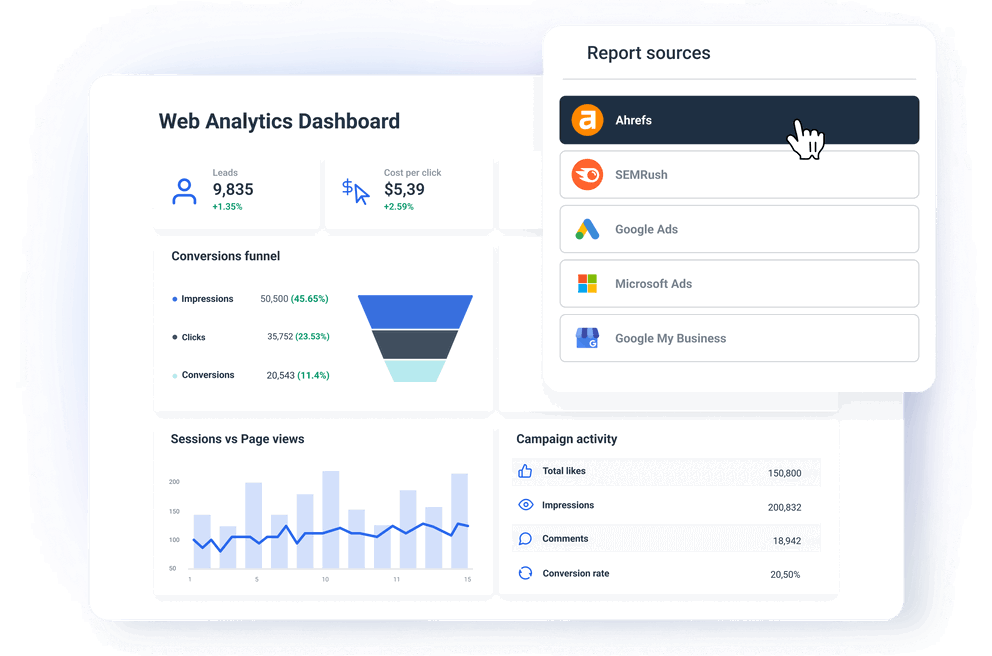
Connect all your digital marketing tools to one web analytics dashboard
A website dashboard can be much more than the basic data you find in Google Analytics. You can connect your SEO tools, PPC, Google My Business account, and more to get a complete overview of your marketing initiatives. And all of this in one digital dashboard instead of multiple dashboards and web apps.
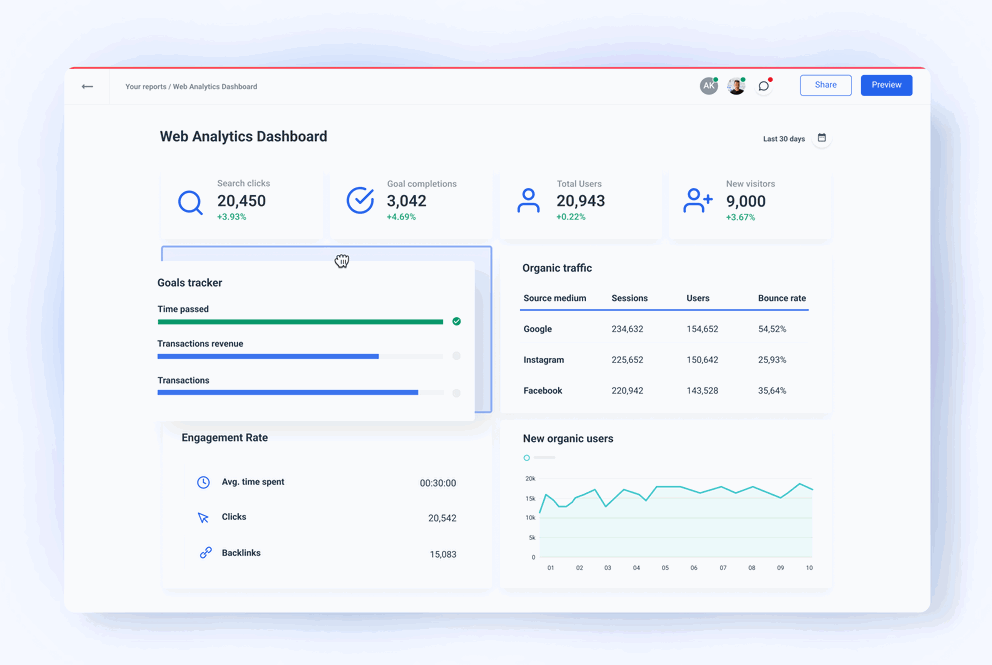
Create a custom website dashboard to track all web analytics metrics & KPIs
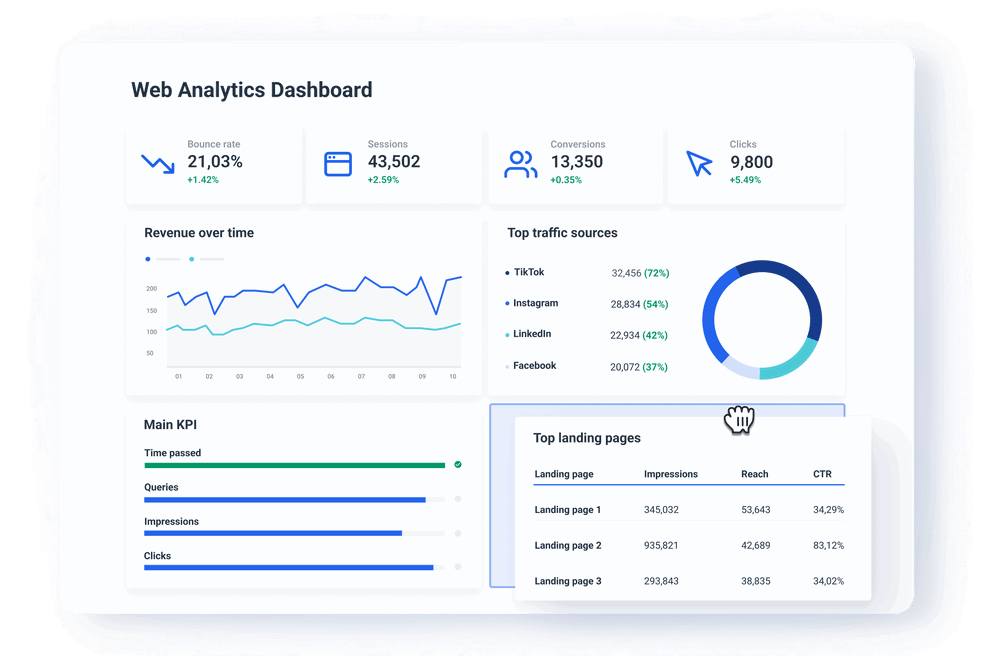
Create your own website dashboard from a template or from scratch. Drag and drop interactive widgets to include metrics such as top traffic sources, top landing pages, bounce rate, sessions, conversions, and more. Customize every data visualization, change metrics, dimensions, or report type, and save it as a widget template. Thanks to Whatagraph’s intuitive user interface, you can quickly build a web page dashboard and find out if your website is underperforming or thriving.
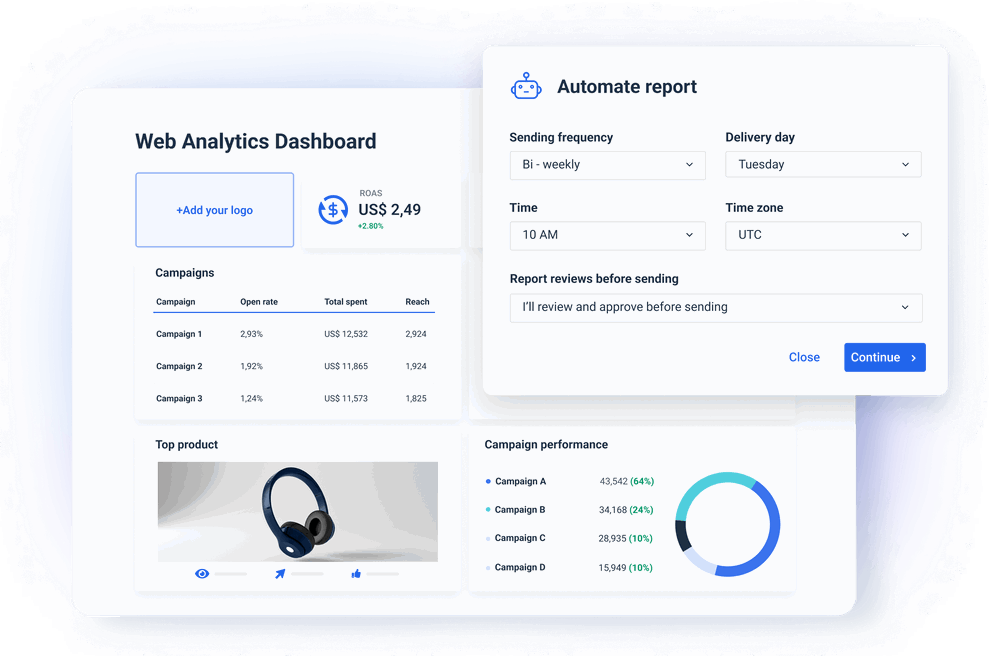
Automate dashboard sharing, apply custom design, and more
Whatagraph’s website dashboard is always accurate because the data is shown in near real-time. Since Whatagraph is connected to your website’s analytics tools 24/7, the data you get is always fresh and up to date. Share every web-based dashboard with a live link so your clients can check the data whenever they want. Add custom branding to every website dashboard you create and host them on a custom domain.
All website dashboard features your agency needs


Frequently Asked Questions
What are the benefits of using a website analytics dashboard?
The benefits of using a website analytics dashboard include:
1. Vast amount of website data you can gather and analyze
2. All your website traffic and digital marketing data in one place
3. Easy way to share insights and present the key data points
All these advantages mean that you can react promptly to every web design or content issue and ensure that your website user experience is optimized for driving sales and conversions.
Does Whatagraph support custom website dashboard design?
Yes, Whatagraph supports custom web dashboard design. You can customize each dashboard by choosing a custom theme. Pick your company’s exact hex color codes for different charts and fields. Replace Whatagraph’s logo with your own, and share the dashboard on a custom domain that looks like an extension of your own.
What are the best website dashboard examples?
Whatagraph allows you to create various website dashboard pages for different use cases and share them all as one dashboard.
For example, you can create a website analytics dashboard with data from your Google Analytics 4 and Google My Business accounts to monitor how your target audience engages with your website.
Another dashboard page can be an overview of your paid advertising or e-commerce initiatives, where you’d consolidate data from your PPC and Salesforce accounts.
There’s no need to build a separate SEO dashboard — create a third tab with keyword, ranking, and link-building data to monitor how your website is optimized for relevant search terms.
Can you export data from digital dashboards?
You can export data from every Whatagraph digital dashboard page as Excel or CSV files.
Why use Whatagraph over other website dashboard software?
Whatagraph has many benefits over competing website dashboard software. Here’s why you should consider Whatagraph:
1. One platform: All-in-one marketing data platform to connect, organize, visualize, and share all your data. Complete the entire marketing data journey in one easy-to-use platform. No third-party apps or plugins.
2. Intuitive dashboard UI: Create each dashboard using widgets as building blocks. Drag and drop graphs, tables, text boxes, headings, and other elements. Easily add more data sources to your dashboard.
3. Dashboard templates: Pick a pre-made dashboard and add your sources. Done & done.
4. Organize your data: Create a blend of multiple sources before visualization. Create rules to unify, aggregate, or blend data on a source or widget level.
5. Stunning visualizations: Engaging visuals that present the key data points in a way readers understand.
6. Live links: Share each website dashboard via a password-protected link for on-demand access. Users can hover over each widget to reveal more data or change the date range to observe the trends.
7. Unlimited dashboards: There’s no limit to how many web traffic dashboards you create on any pricing plan.
What platforms can you connect to a Whatagraph website dashboard?
You can connect over 45 popular marketing platforms via fully managed integrations. These include web analytics, social media, email marketing, e-commerce apps, and CRMs.
You can also connect data from any source that isn’t supported yet — for example, a CMS like WordPress, any SaaS web app, mobile apps, etc.
In those cases, you can build a Custom API or export the data to Google Sheets or BigQuery and add them as a source.
What does website data tell you?
Website data gives you comprehensive information and metrics on your website, the number of visitors and clicks, duration of visits, how visitors reach your website, their search intent, bounce rate, conversion rate, and the trends that come from these metrics.
What are the best website dashboard KPIs?
The exact KPIs you’re going to track with your website traffic dashboard depend on your business and your goals. However, these are the ones you should start from:
- Traffic sources: Use a table widget to display the number of sessions, bounce rate, goal completions, and conversion rate of your top-performing sources.
- Landing pages: This widget shows you the top landing pages based on the number of sessions.
- Devices: Use a pie chart to visualize the number and percentage of sessions according to type of device (iOS, Android, Windows, etc.)
- Browsers: Pick a multi-column KPI widget to show the number of sessions and bounce rate for each type of web browser your visitors use.
What are the top website dashboard metrics?
Just as with KPIs, you can pick any metrics available from your connected platforms API, but these are the ones to start with:
- Conversion rate: The percentage of users who have taken a desired action.
- Goal completions: Whatagraph has a handy goal widget that lets you measure the goal completions for specific metrics.
- Bounce rate: The percentage of visitors who land on your page and leave without visiting another page or performing another desired action.
- Sessions: The number of sessions or interactions in a given amount of time.
More Dashboards for In-House Marketers & Agencies
View All TemplatesNo credit card required


It’s good to be loved! Our clients are not shy about expressing it.
I made a switch from GDS and Sheets for reporting to Whatagraph, and I am saving literal hours each week on performance report creation. Our small firm actually managed to onboard 2 new clients as a result of all the time we saved on managing data and reporting. The customer service is also really helpful and easy to reach.

Capterra verified review by
Mindaugas S., Marketing Consultant
Having active customer support to help fix any issues was a big contributor, but we also really liked the ability to save templates and connect sources to multiple charts/widgets at once without having to edit them individually. And having the grid layout is much easier to stay consistent with than the free form setup that Data Studio has.

Capterra verified review by
Nico T., Media Planner
The system has standard templates that are easy and fast to use. Also you can build your own report with lightning speed. It is very easy to use, has a lot of integration, and let get started very fast.

Capterra verified review by
Rasmus Bernt K., External Senior Management Consultant
We love Whatagraph - we would definitely recommend and our account manager is great! I love how easy this tool is to use, everyone on the team finds it much more user-friendly than other dashboards. Integration was easy, we sent some example reports to the team who duplicated these for us. We literally had to log in and send it to our clients!

Capterra verified review by
Stephanie S., Digital Director
We are showing our clients the work that we're doing for them and this is incredibly important for our clients ROI. They want to see results and having a tool like Whatagraph that can show data from virtually every source we use is hugely important.

Capterra verified review by
John S., SEO Strategist
The tool is easy to use; you do not need to have development resources. Even my junior project managers are capable of making campaign reports in minutes. There are a lot of pre-made templates you can use as well as many pre-made widgets.

Capterra verified review by
Erman E., Marketing Specialist
Really easy to connect data sources within the tool. The library of report templates has been helpful. The customer support team has been responsive to all of our needs. Our team enjoys the simplicity of setting up the reports and how the data is presented.

Capterra verified review by
Brent N., Director of Operations
Easy to create really beautiful graphs and reports which can help other team members to understand the most important takeaways. I especially like the automated report function, so I don't have to check on the same thing repeatedly.

Capterra verified review by
Orsolya S., Online Marketing Manager