


What is a YouTube reporting tool?
A YouTube channel analytics tool helps you collect, track, and present your clients' YouTube channel performance data - all without logging into YouTube Studio for every account.
Instead of jumping between individual channels, exporting CSVs, and manually building slides before every client meeting, you get one clean report that tells the full story.
For agencies managing YouTube alongside paid social, SEO, and other channels, that matters more than ever. YouTube is the world's largest social media advertising platform, with a potential ad reach of over 2.53 billion users - roughly 11% larger than Facebook's. Your clients are investing serious budget there, and they expect reporting that matches that investment.
But most agencies are still piecing it together manually. YouTube Studio only shows one channel at a time, sharing reports means handing over backend access, and cross-channel context doesn't exist natively. The result: account managers spending hours every month on reporting that should take minutes.
A proper YouTube video analytics tool changes that. Here's what it actually does for you:
- Connects directly to your clients' YouTube channels and pulls data automatically
- Standardizes YouTube channel metrics so they sit cleanly alongside data from other platforms
- Visualizes YouTube video performance in a way clients actually understand - not raw numbers in a spreadsheet
- Let's you brand and customize reports with each client's logo, colors, and the KPIs that matter to them
With Whatagraph IQ, you go even further. Rather than building reports widget by widget, your team can:
- Ask AI to generate a full YouTube analytics report instantly, with the right tabs, charts, and layouts already in place
- Use IQ Themes to apply each client's branding automatically - fonts, colors, and all
- Get plain-language performance summaries written by AI, ready to send or tweak
- Ask IQ Chat direct questions about channel performance and get answers in seconds
Whatagraph has also launched an MCP that lets you connect your data to Claude or ChatGPT and analyze your data there.
And the time savings are real. Peak Seven, a Florida-based advertising agency managing over 100 ad campaigns across 25 clients, made that shift after years of wrestling with Looker Studio - a setup that was slow, unreliable, and constantly breaking.
After switching to Whatagraph, Peak Seven cut reporting time from 4 hours per report down to 1.5 hours - saving 63 hours a month and $9,450 in monthly client reporting costs.
Whatagraph has helped everyone on our team get on the same page about clients, what’s important, and how to talk to them. Our relationships with clients have been amazing, and we’ve even been able to retain them longer. - Kim Strickland, Digital Marketing Specialist at Peak Seven
What to include in a YouTube report?
A strong YouTube analytics report gives clients a clear view of how their channel and video content are performing - from views and watch time to subscriber growth and audience demographics.
Here's how to structure it using our YouTube report template, broken down section by section.
1. Performance Summary
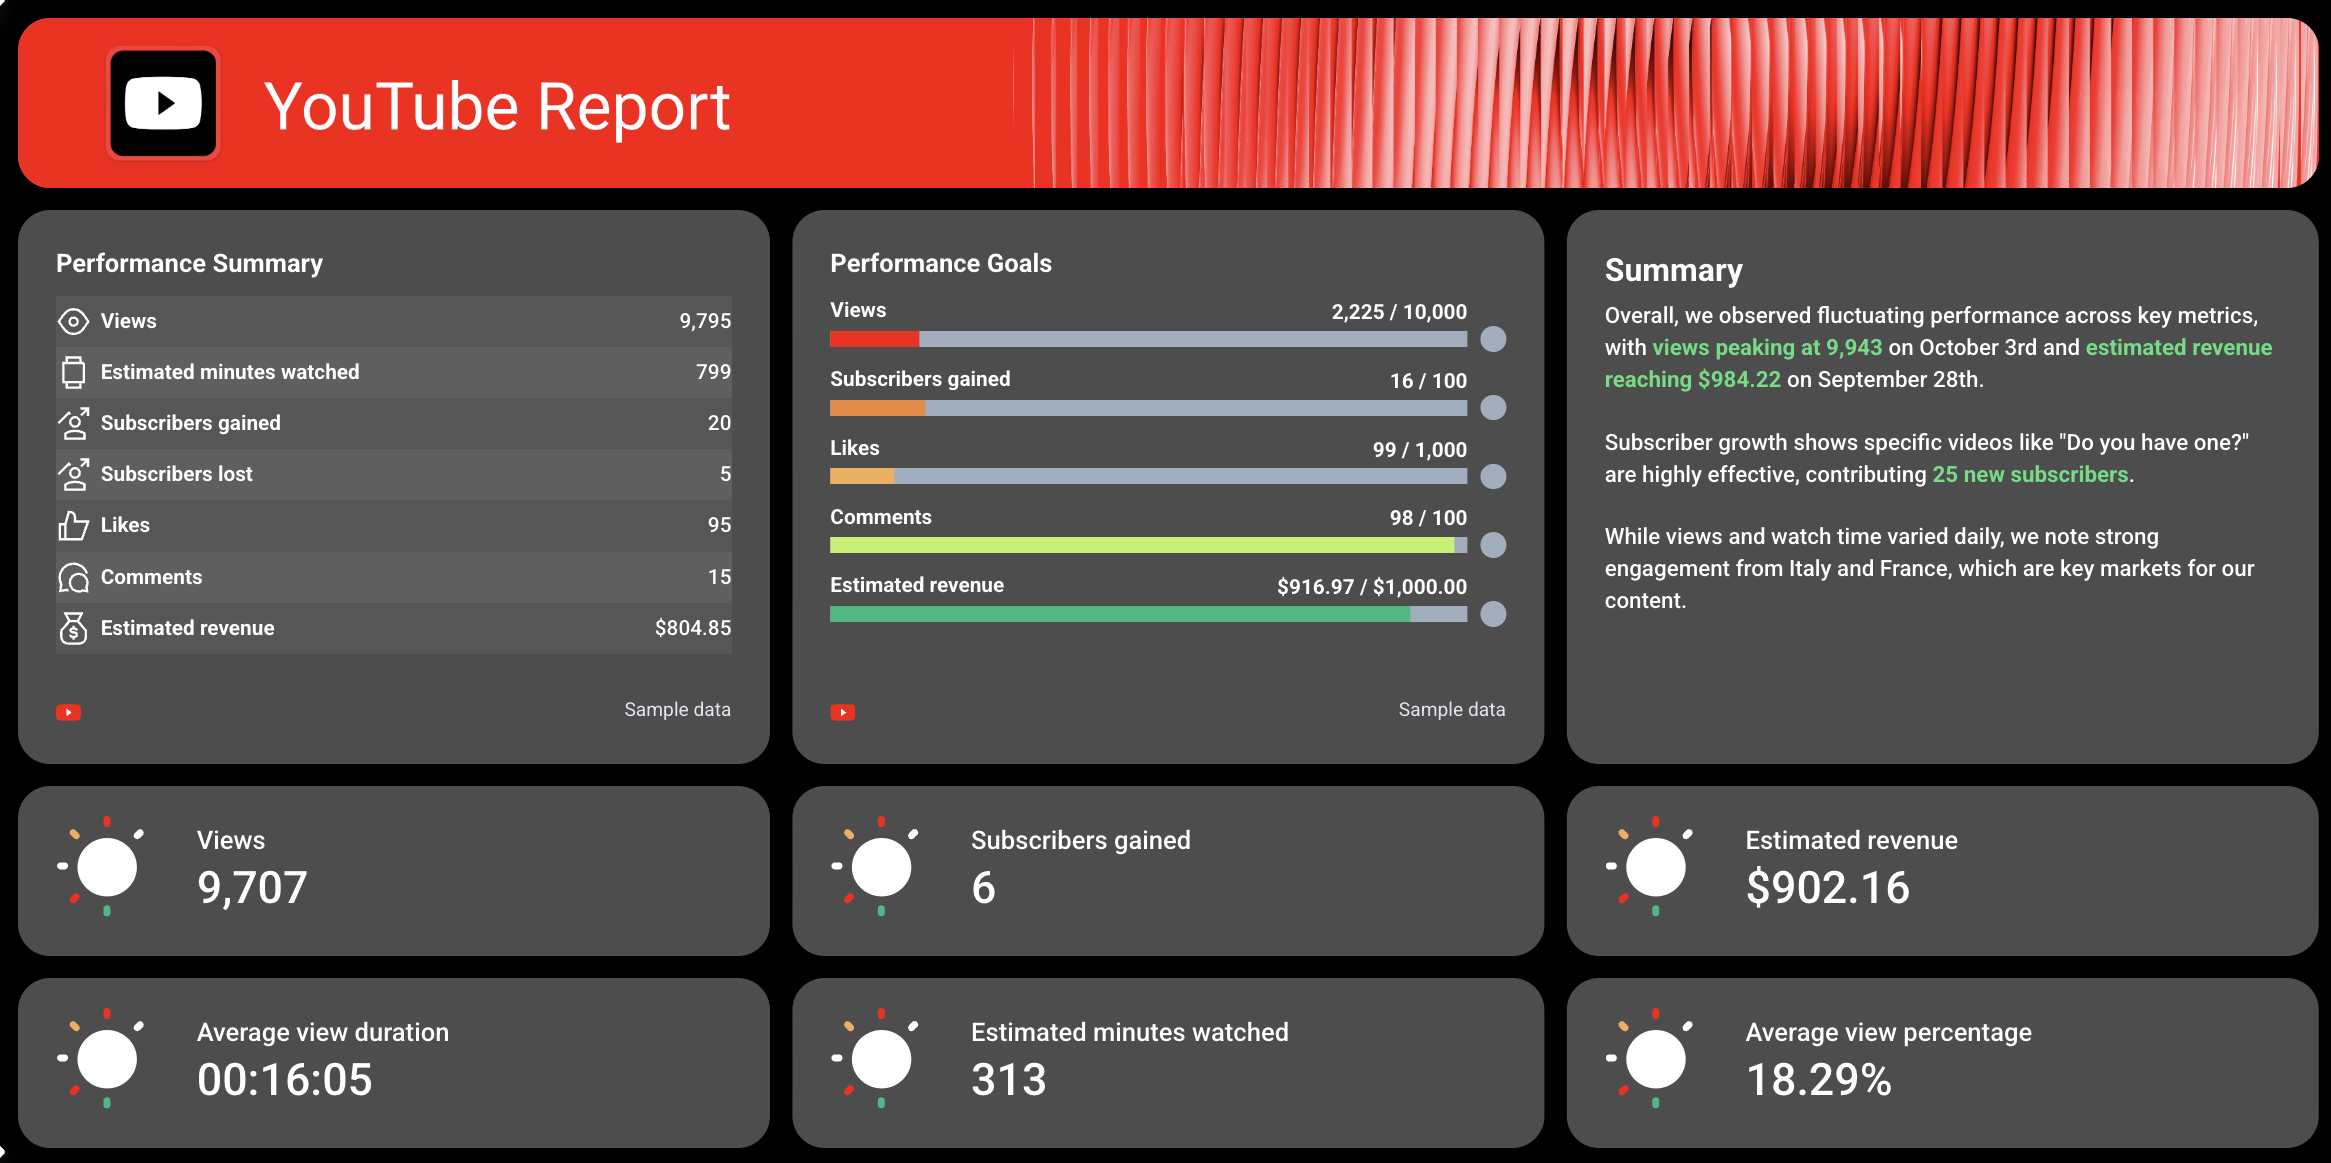
Open the report with a plain-language overview of how the YouTube channel performed during the reporting period.
Include:
1. A list covering core channel metrics for the period - views, estimated minutes watched, subscribers gained, subscribers lost, likes, comments, and estimated revenue.
2. “Performance goal” widgets tracking progress against key targets - views, watch time, subscribers gained, likes, comments, and estimated revenue
3. Individual scorecards listing other YouTube KPIs that matter to clients: subscribers gained, estimated revenue, average view duration, minutes watched
4. Back this up with a written recommendations section, highlighting key insights, recommendations, and next steps
Raw numbers without context are just noise. The summary section is where your agency's expertise becomes visible. As Martin Sandgaard, Co-Founder of AdsToGo, puts it:
Reporting with human input is 1000x more valuable than an auto-scheduled report. Context and action plans matter more than the numbers, and most clients don't open or understand reports without that context.
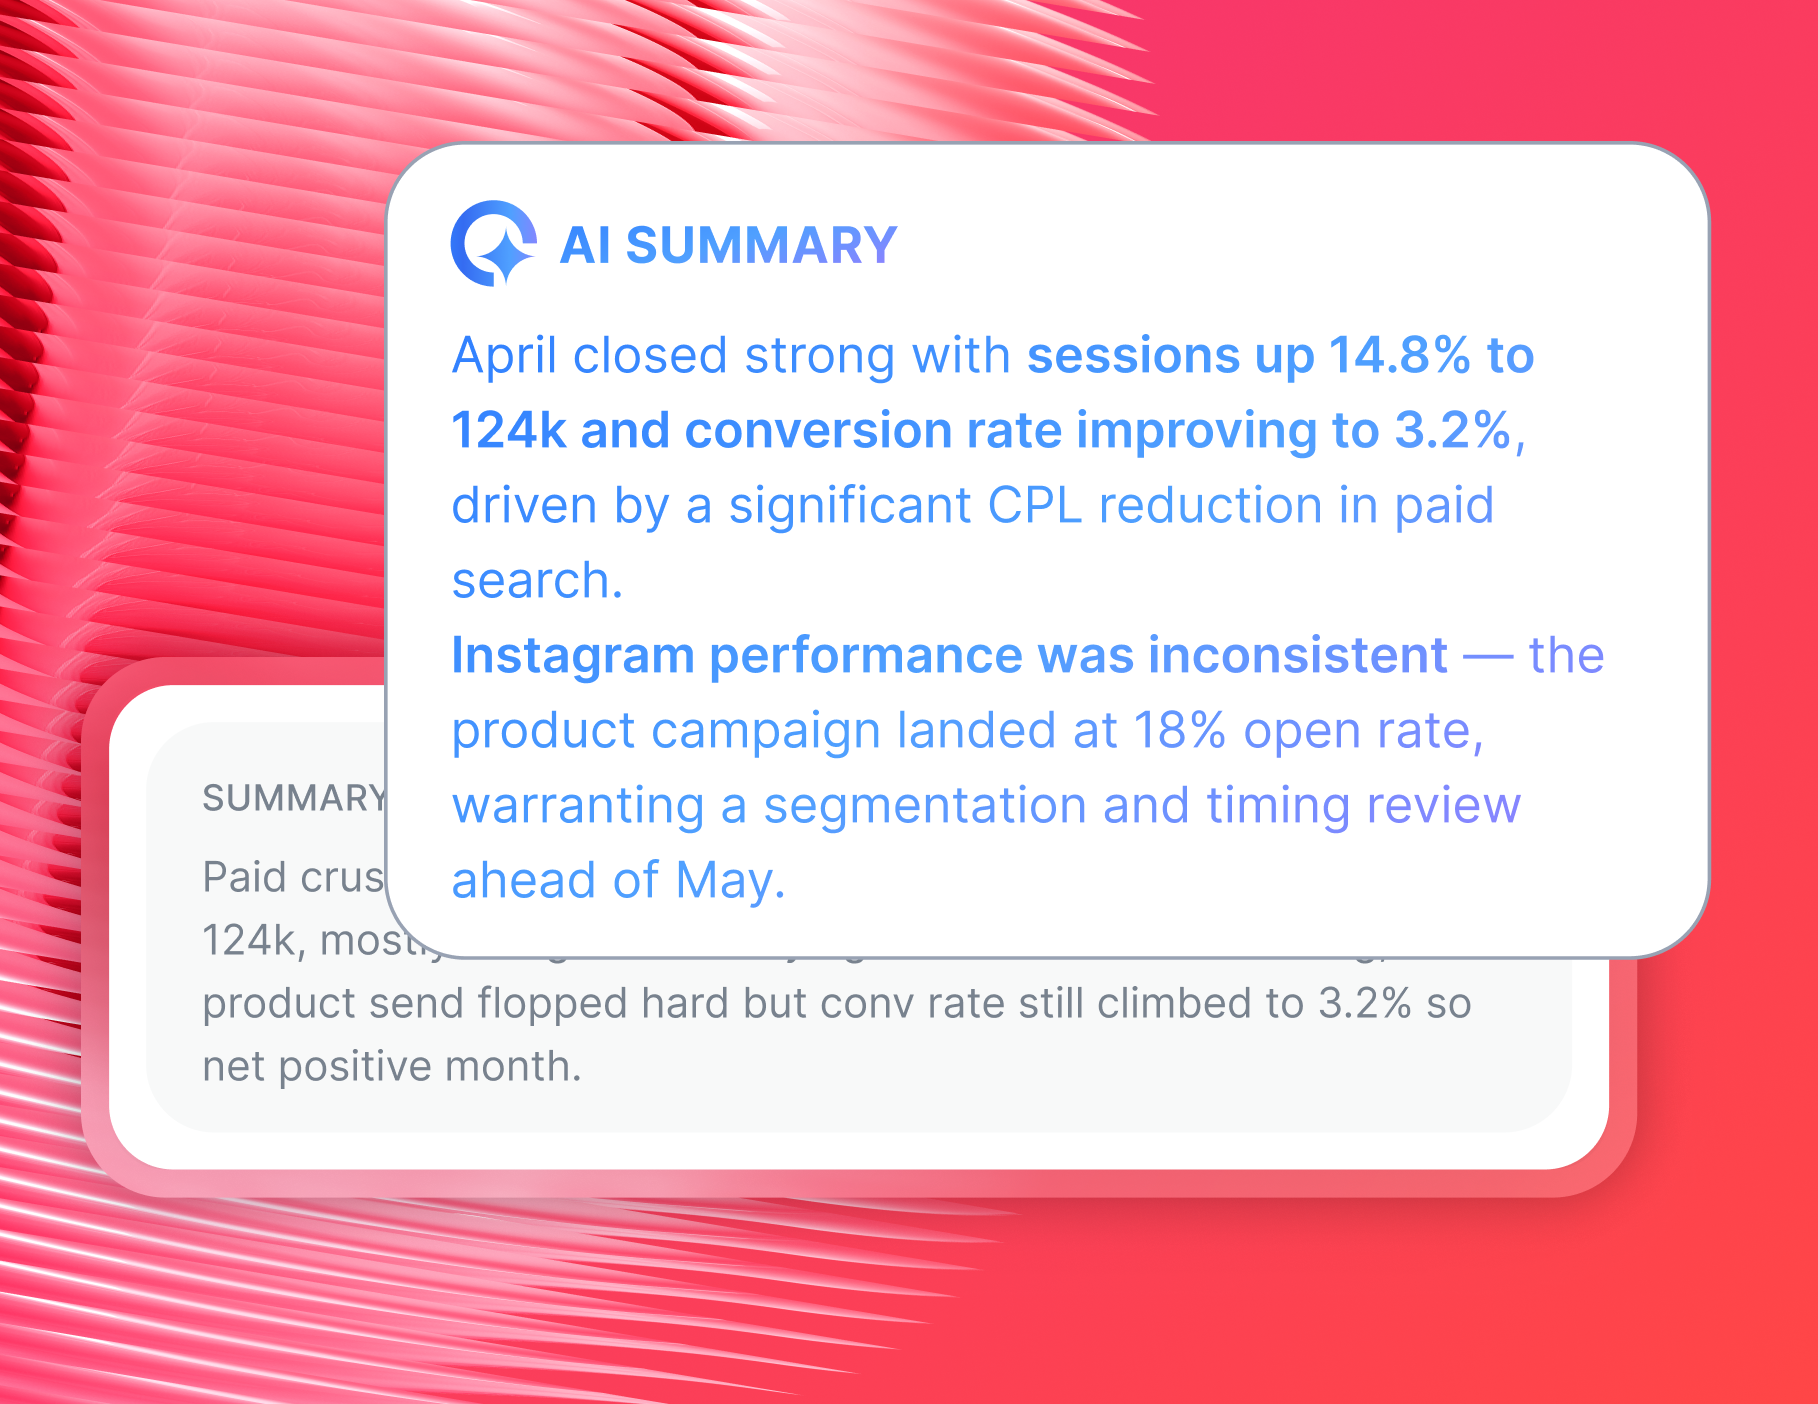
This is also where Whatagraph IQ earns its place. Rather than writing performance summaries from scratch after every reporting cycle, you can ask IQ to generate them based on the actual data already in your report.
Write a custom prompt, such as:
- "Summarize YouTube channel performance for a client meeting."
- "Show me which YouTube videos are driving the most engagement."
- "Write a client-facing summary of our YouTube channel results."
IQ produces a client-ready recap in seconds - in any of 18 languages.
And because IQ reads directly from your report data, there are no inaccuracies. Edit the output as much as you need to match your agency's tone, then send it straight to your client.
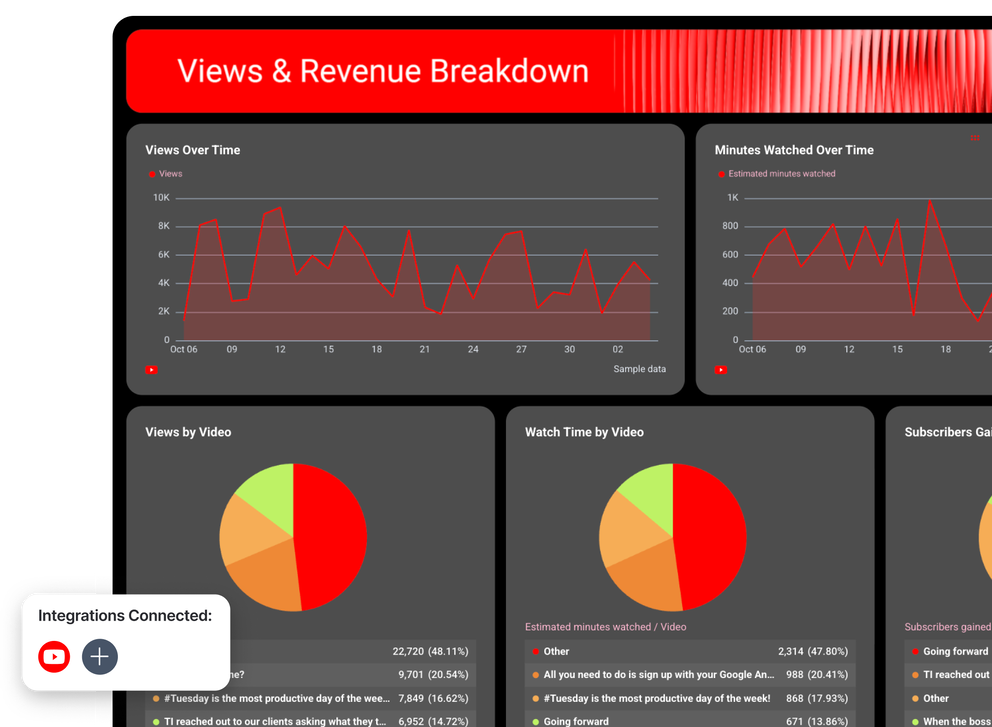
2. Views & Revenue Breakdown
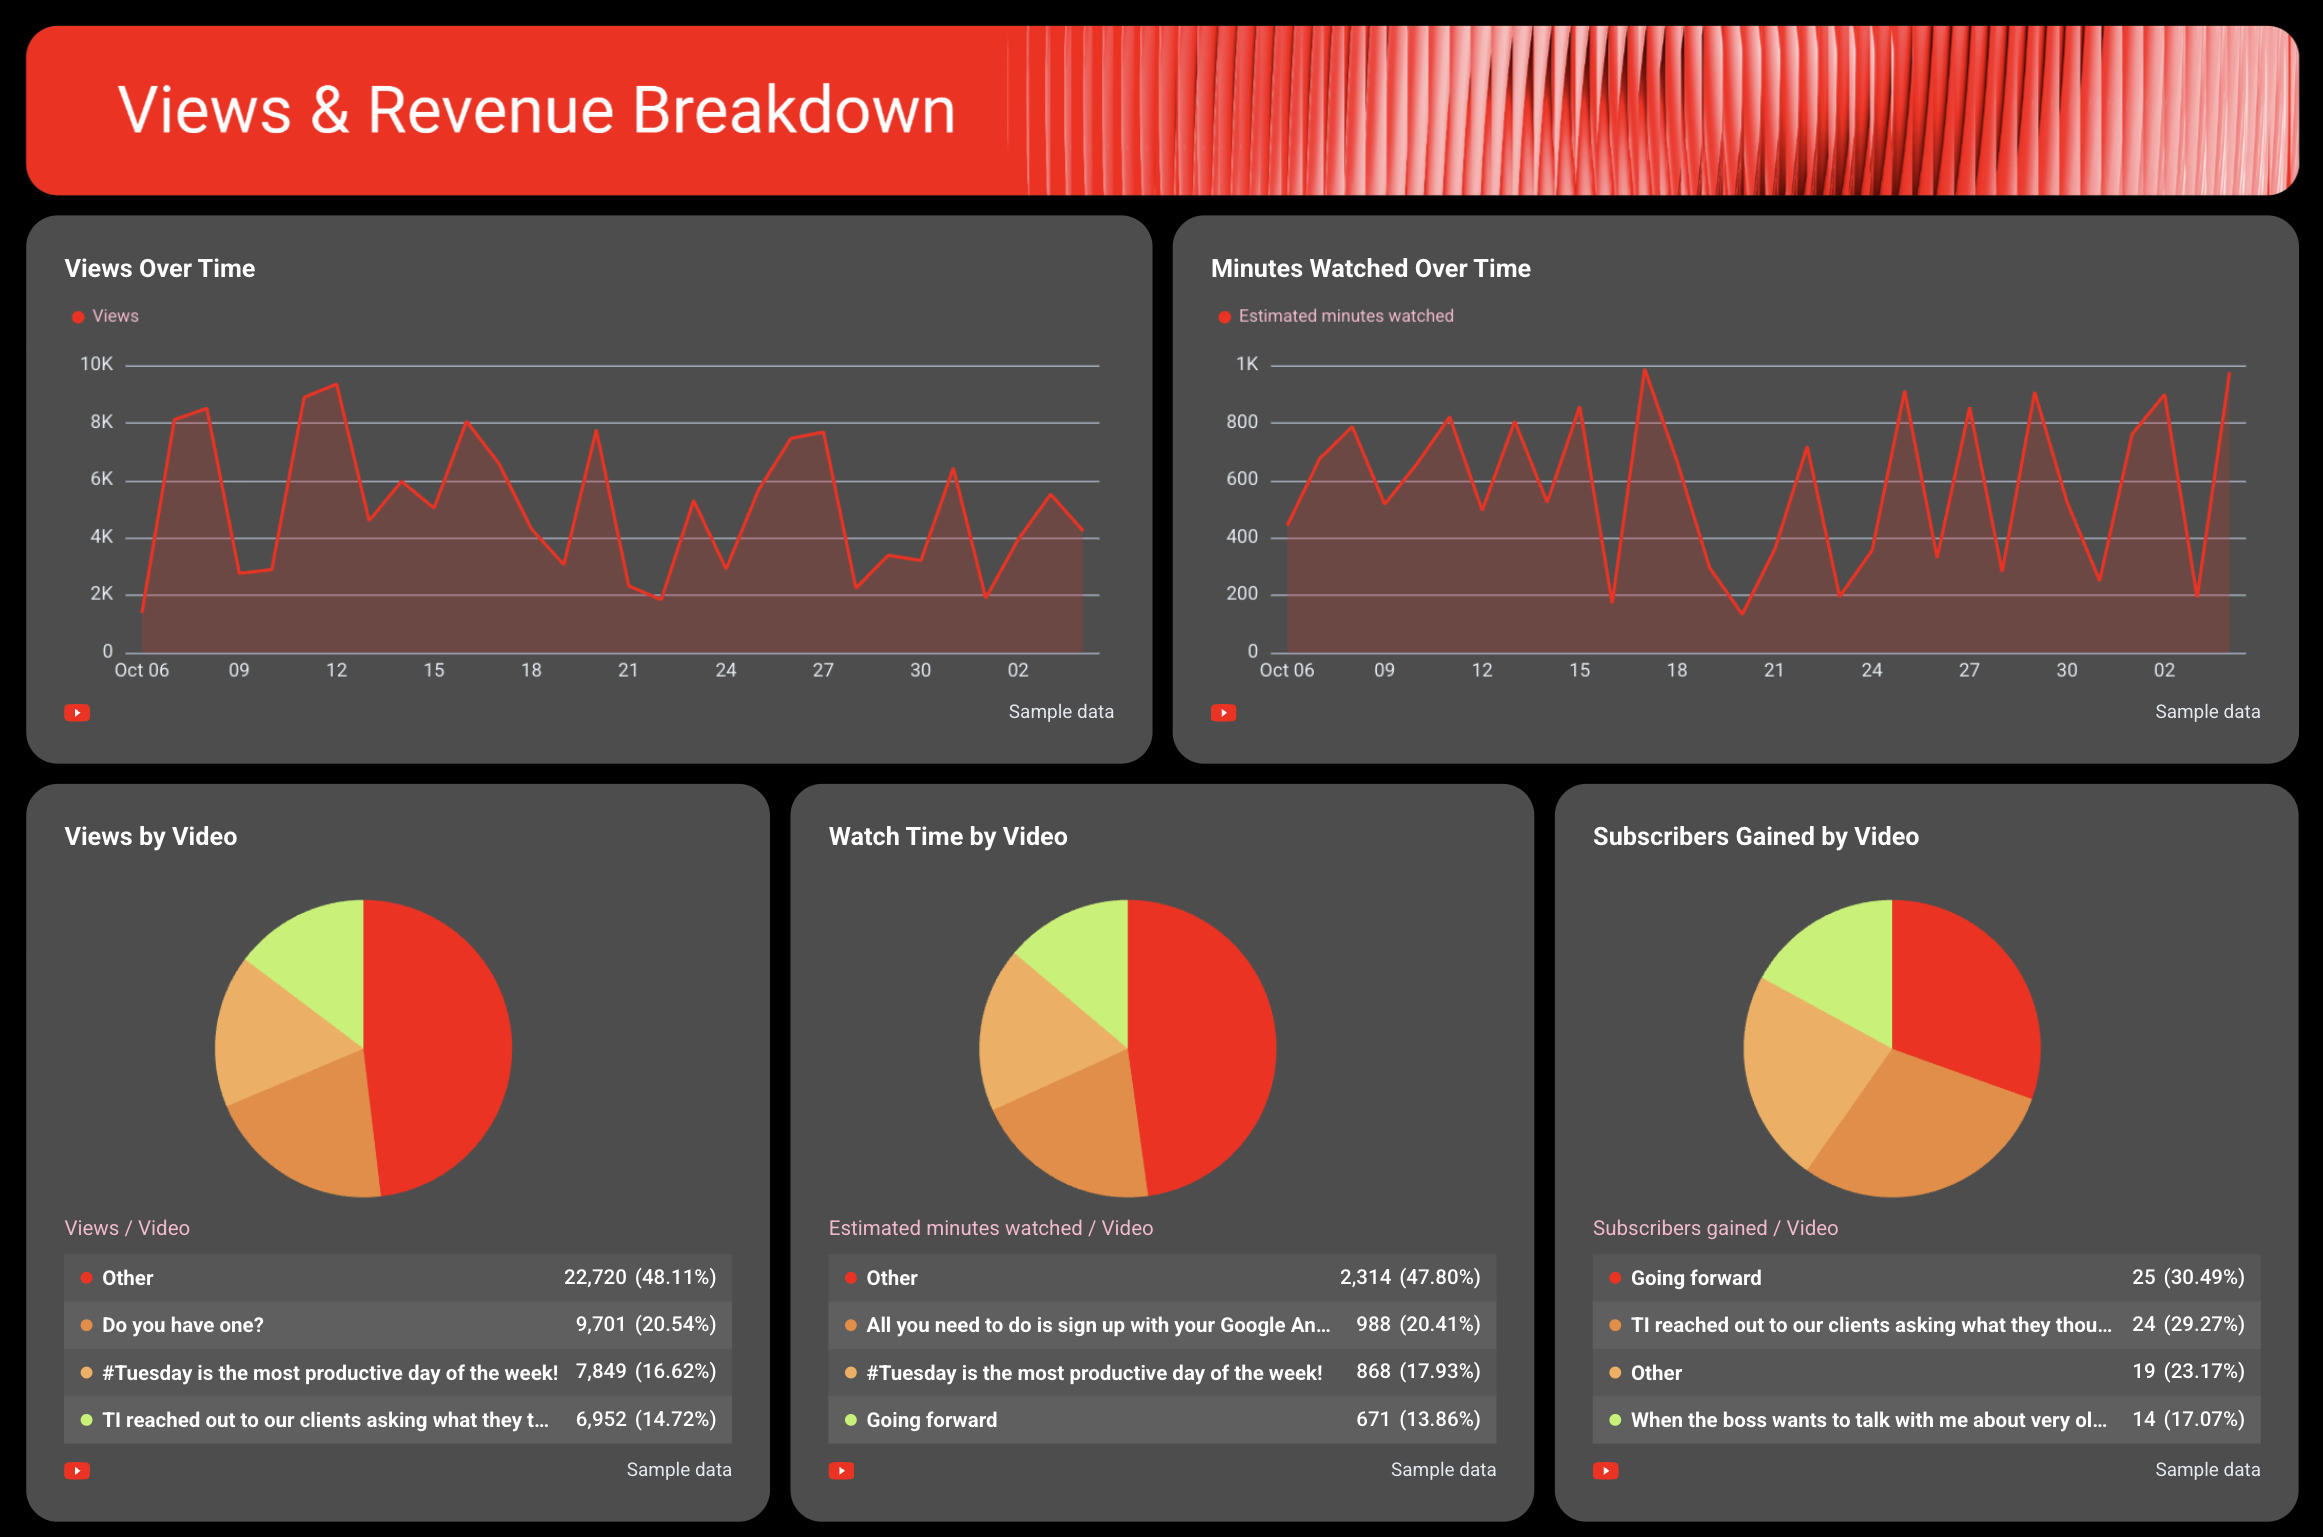
This section gives clients a visual, time-based read of how the channel performed across the full reporting period - not just a snapshot of totals, but the actual day-by-day story.
In this section, display:
1. Views over time - showing how daily view counts fluctuated across the month
2. Minutes watched over time - tracking estimated watch minutes day by day
3. Pie charts - breaking down which videos drove the most views, watch time, and subscribers gained during the period.
End this section with comparison charts, comparing two metrics side by side across 30 days:
- Subscribers gained vs. lost, to follow net audience growth
- Video views vs. average view duration percentage, revealing if videos are actually holding attention
- Likes vs. dislikes over time, so clients can see how audiences are actually reacting to the content
- Views vs. estimated revenue over time, showing if viewership spikes are translating into actual revenue
3. Video Performance Breakdown
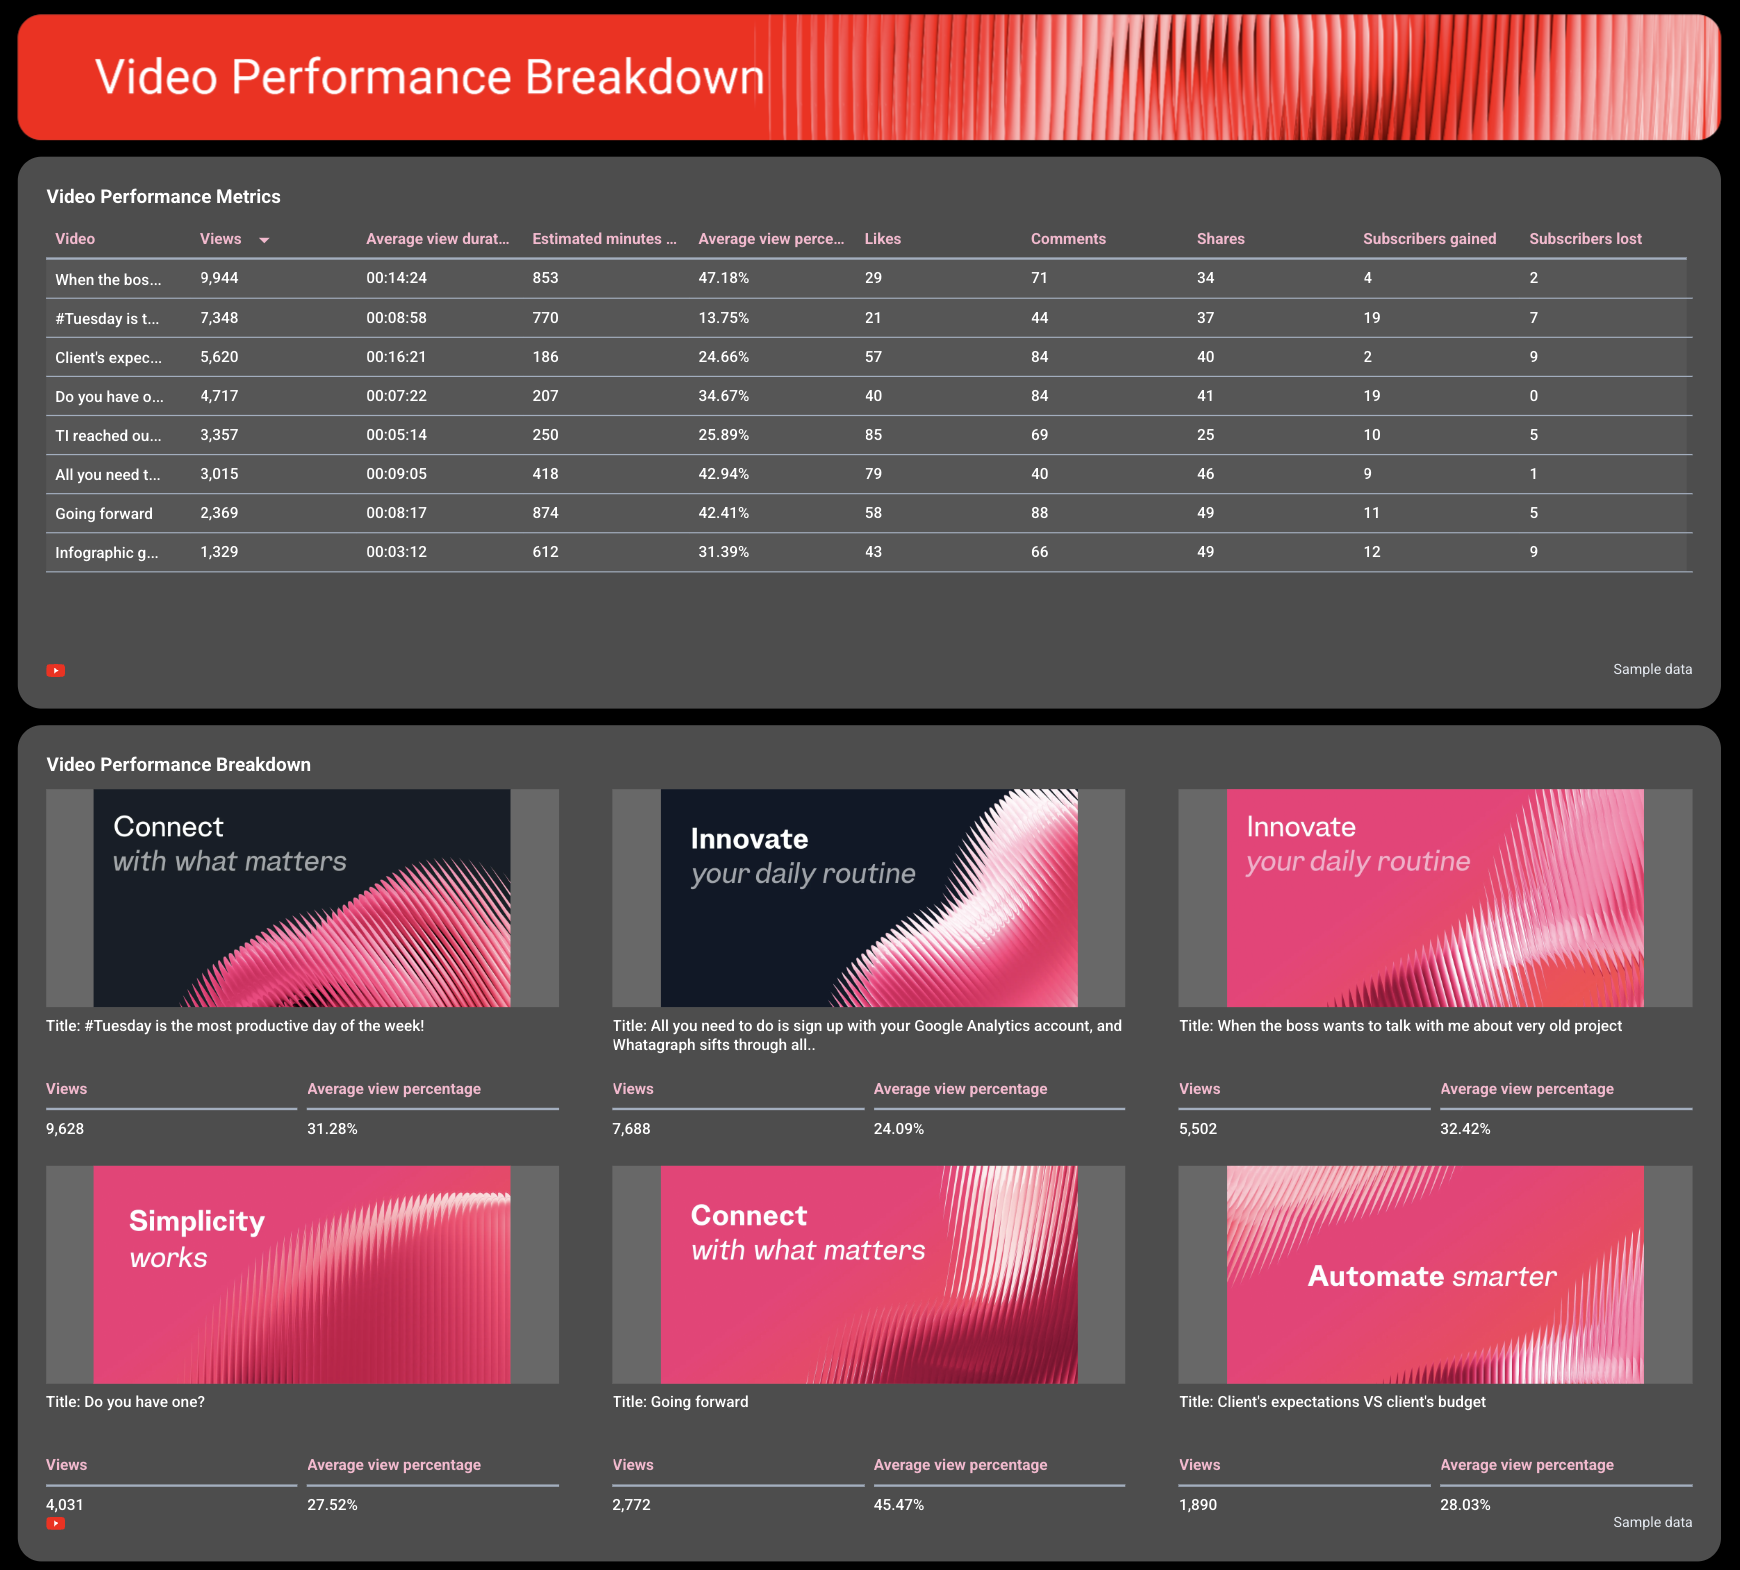
This is where clients see which individual videos are pulling their weight and which ones need adjusting.
Include a video performance table showing key metrics side by side:
- Views per video
- Average view duration
- Estimated minutes watched
- Average view duration percentage
- Likes, comments, shares
- Subscriber gained and lost
This gives a clean comparison across all published videos without needing to log into YouTube Studio for every channel.
But video-level data only tells part of the story. As Maryna Barysheva, CEO of LKI Consulting, notes:
Creative performance is often the biggest driver of results, but most reports focus heavily on campaign-level metrics instead of analyzing which messaging or creatives are actually working.
That's exactly why this section goes beyond a table. The best-performing videos have their own scorecards - showing the thumbnail, title, views, and average view percentage.
This visual layer makes it immediately obvious which formats and topics resonate, and which fall flat.
4. Engagement Breakdown
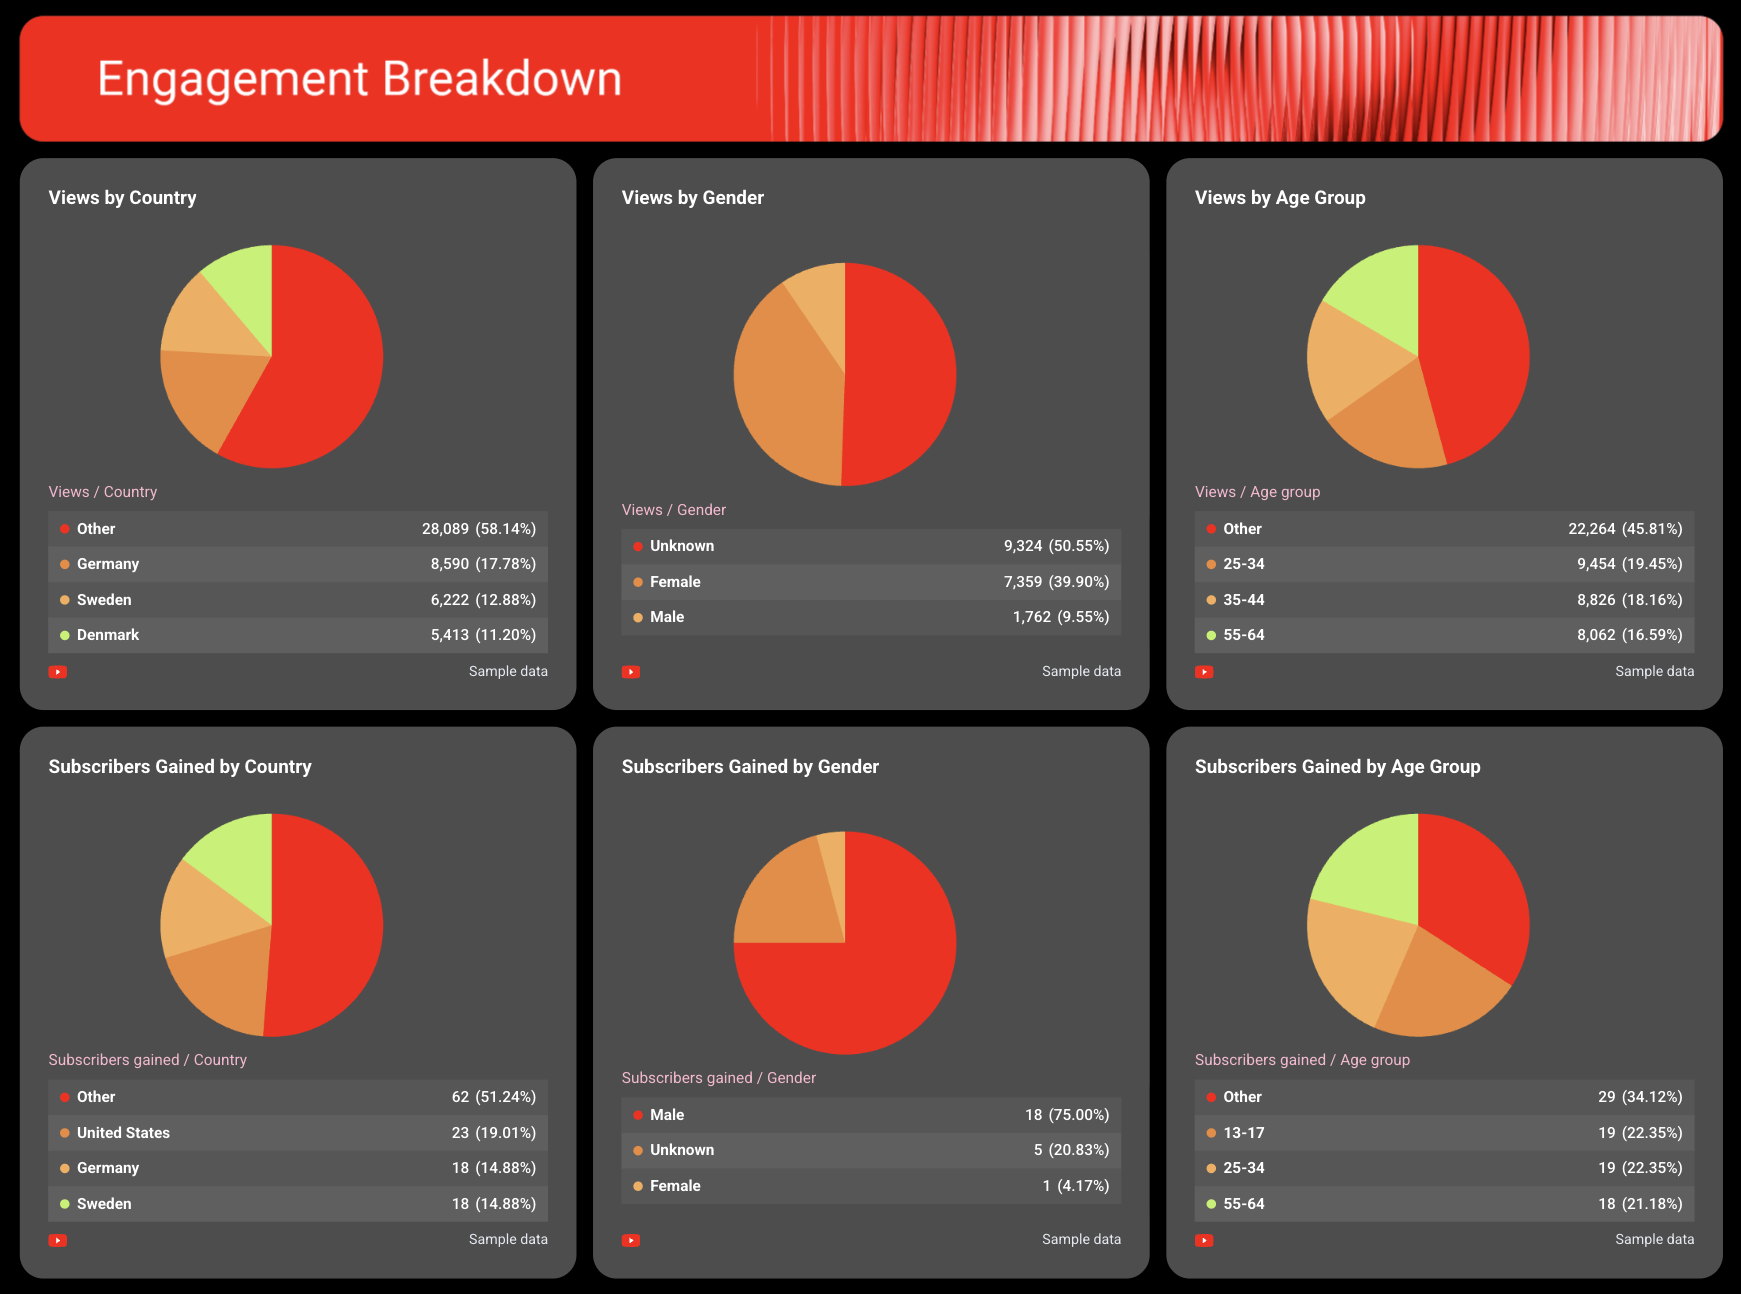
Close the report with an audience-level view that connects channel performance back to the people behind the numbers.
Include pie charts and demographic breakdown tables covering:
- Views by country
- Views by gender
- Views by age group
- Subscribers gained by country
- Subscribers gained by gender
- Subscribers gained by age group
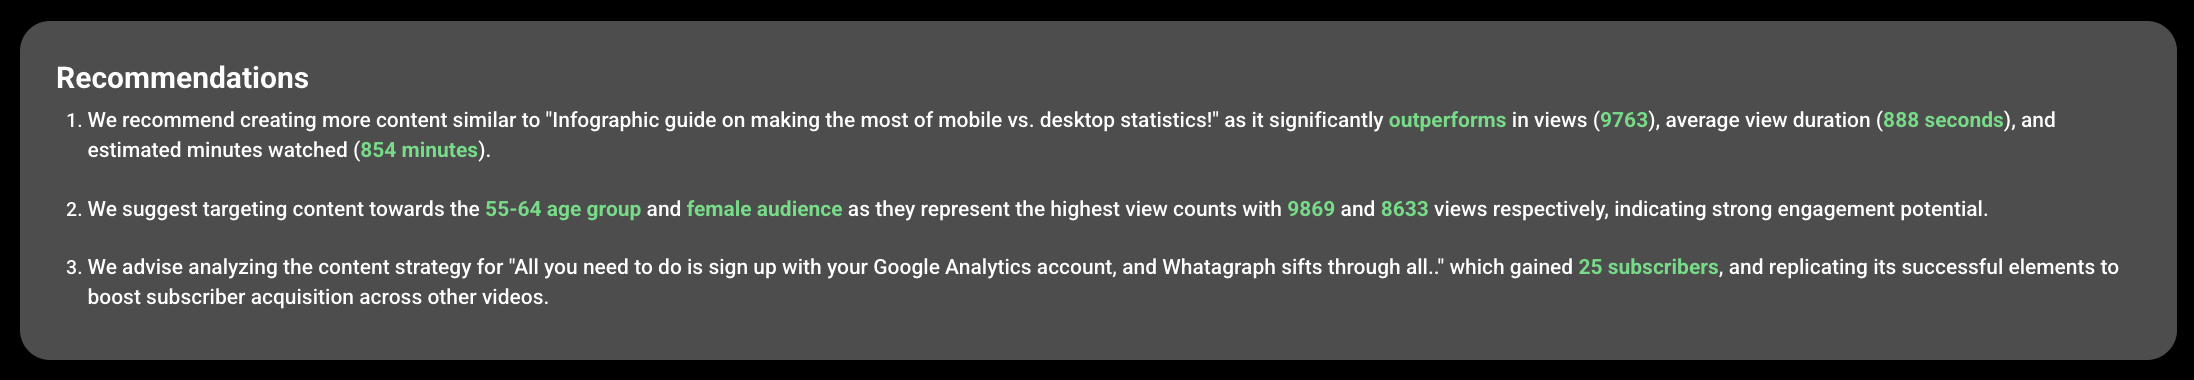
Back these up with a recommendations text widget - a written section where your team can summarize what the data means and outline the next steps for the client's YouTube strategy.
How to create YouTube reports for clients with Whatagraph’s YouTube analytics software
Building a YouTube report for clients doesn't have to mean manual data exports and reformatting everything from scratch.
With Whatagraph's YouTube analytics software, you can go from data connection to a client-ready YouTube analytics report in under 30 minutes. Here's how:
1. Connect your clients' YouTube accounts
Start by connecting each client's YouTube channel through Whatagraph's native integration.
From your workspace, select YouTube, authenticate with the client's login, and the data starts flowing immediately. Setup takes a few minutes per client.
You can also pull in data from any other channel the client is active on:
- PPC: Google Ads, Meta Ads, LinkedIn Ads, Microsoft Ads
- Social: TikTok, Instagram, Facebook, LinkedIn
- SEO & Analytics: GA4, Semrush, Ahrefs, SE Ranking
- E-commerce: Shopify, BigCommerce, Magento
- Email: Mailchimp, ActiveCampaign, Constant Contact
Whatagraph supports 60+ integrations in total - and unlike setups like Looker Studio with Funnel or Supermetrics, every integration is fully native. If something goes wrong, engineers are notified immediately.
Kim Strickland, Digital Marketing Specialist at Peak Seven, experienced connectors breaking firsthand:
With Looker Studio and Funnel, reporting was a constant struggle—broken connections, double-counted conversions, and inaccurate metrics. With Whatagraph, it's so much easier. The data always matches what we're seeing on the platforms.
With no “middlemen,” your clients’ YouTube channel data always stays accurate and up-to-date.
2. Organize and standardize your YouTube data
Once your clients' channels are connected, structure the data so it actually makes sense to present.
This solves issues agencies often face - inconsistent naming, different currencies, and data that needs blending with paid channels.
With Whatagraph, you can:
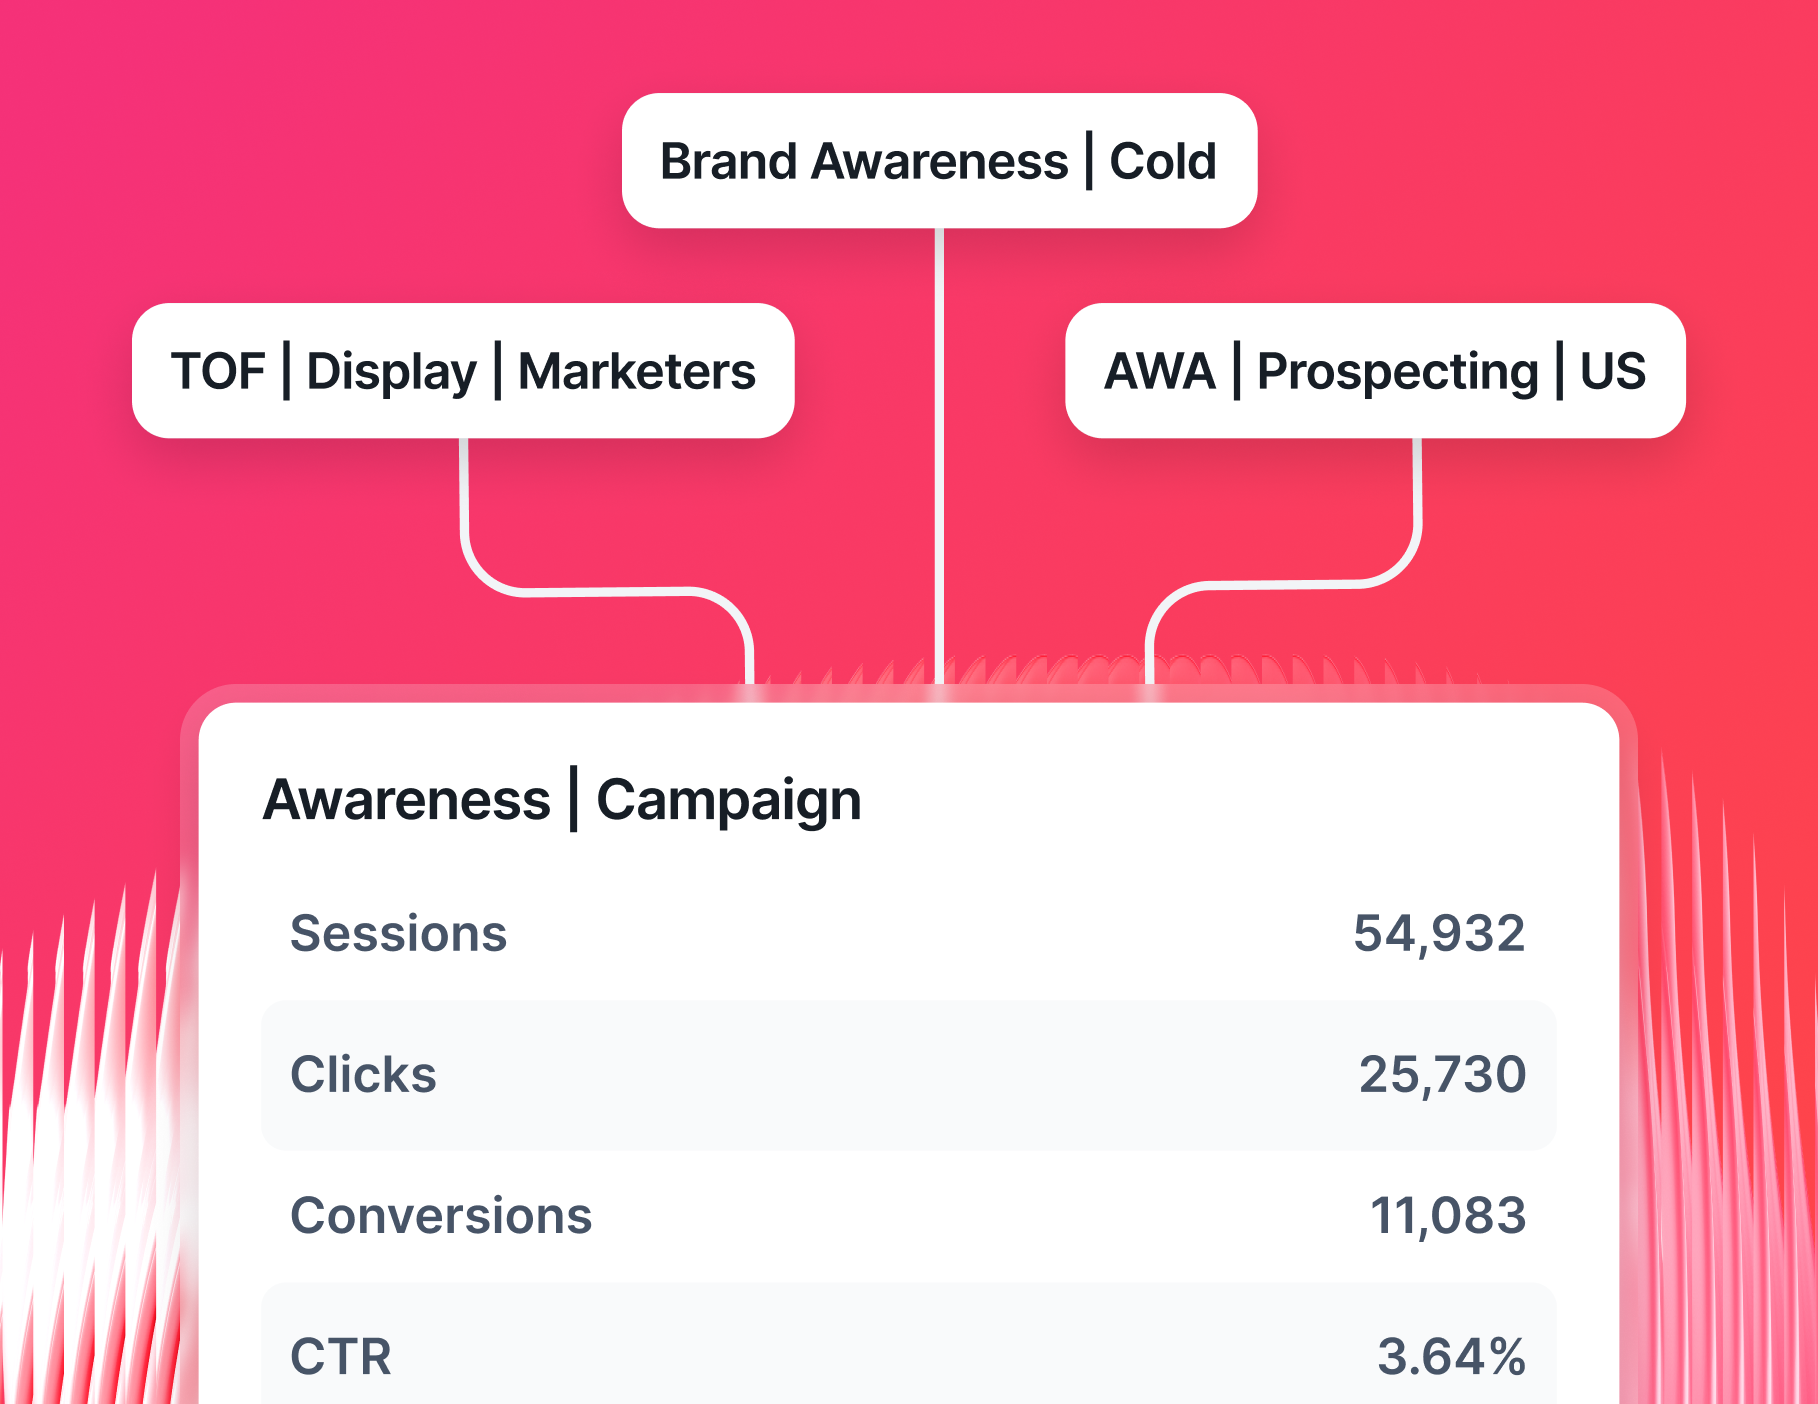
- Group YouTube channel data by client, account manager, or region using tags and folders
- Standardize YouTube channel metric naming so it matches your agency's terminology
- Filter by specific videos, date ranges, or audience segments
- Blend YouTube data with any paid channel data to create a unified performance view for clients who run YouTube ads alongside other campaigns
With Whatagraph IQ Dimensions, you can take this even step further. Just describe what you need in plain language, and IQ builds it:
- "Combine YouTube ad spend with Google Ads spend into one total paid media metric"
- "Group all Q1 video content by campaign type"
- "Normalize subscriber data across all client channels into a single comparable view"
IQ makes sense of inconsistent data and removes hours of manual cleanup from the reporting cycle.
3. Build client-ready YouTube reports with AI
This is where agencies used to spend the most time: building, formatting, and branding reports from scratch for every client.
With Whatagraph IQ, that's no longer the process:
1. Generate a full YouTube subscriber analytics report instantly. Type what you need - for example, "Build a YouTube Ads report for a client showing views, watch time, subscriber growth, estimated revenue, and video-level performance for the last 30 days"
IQ assembles the complete report, with the right tabs, widgets, and layout already in place.
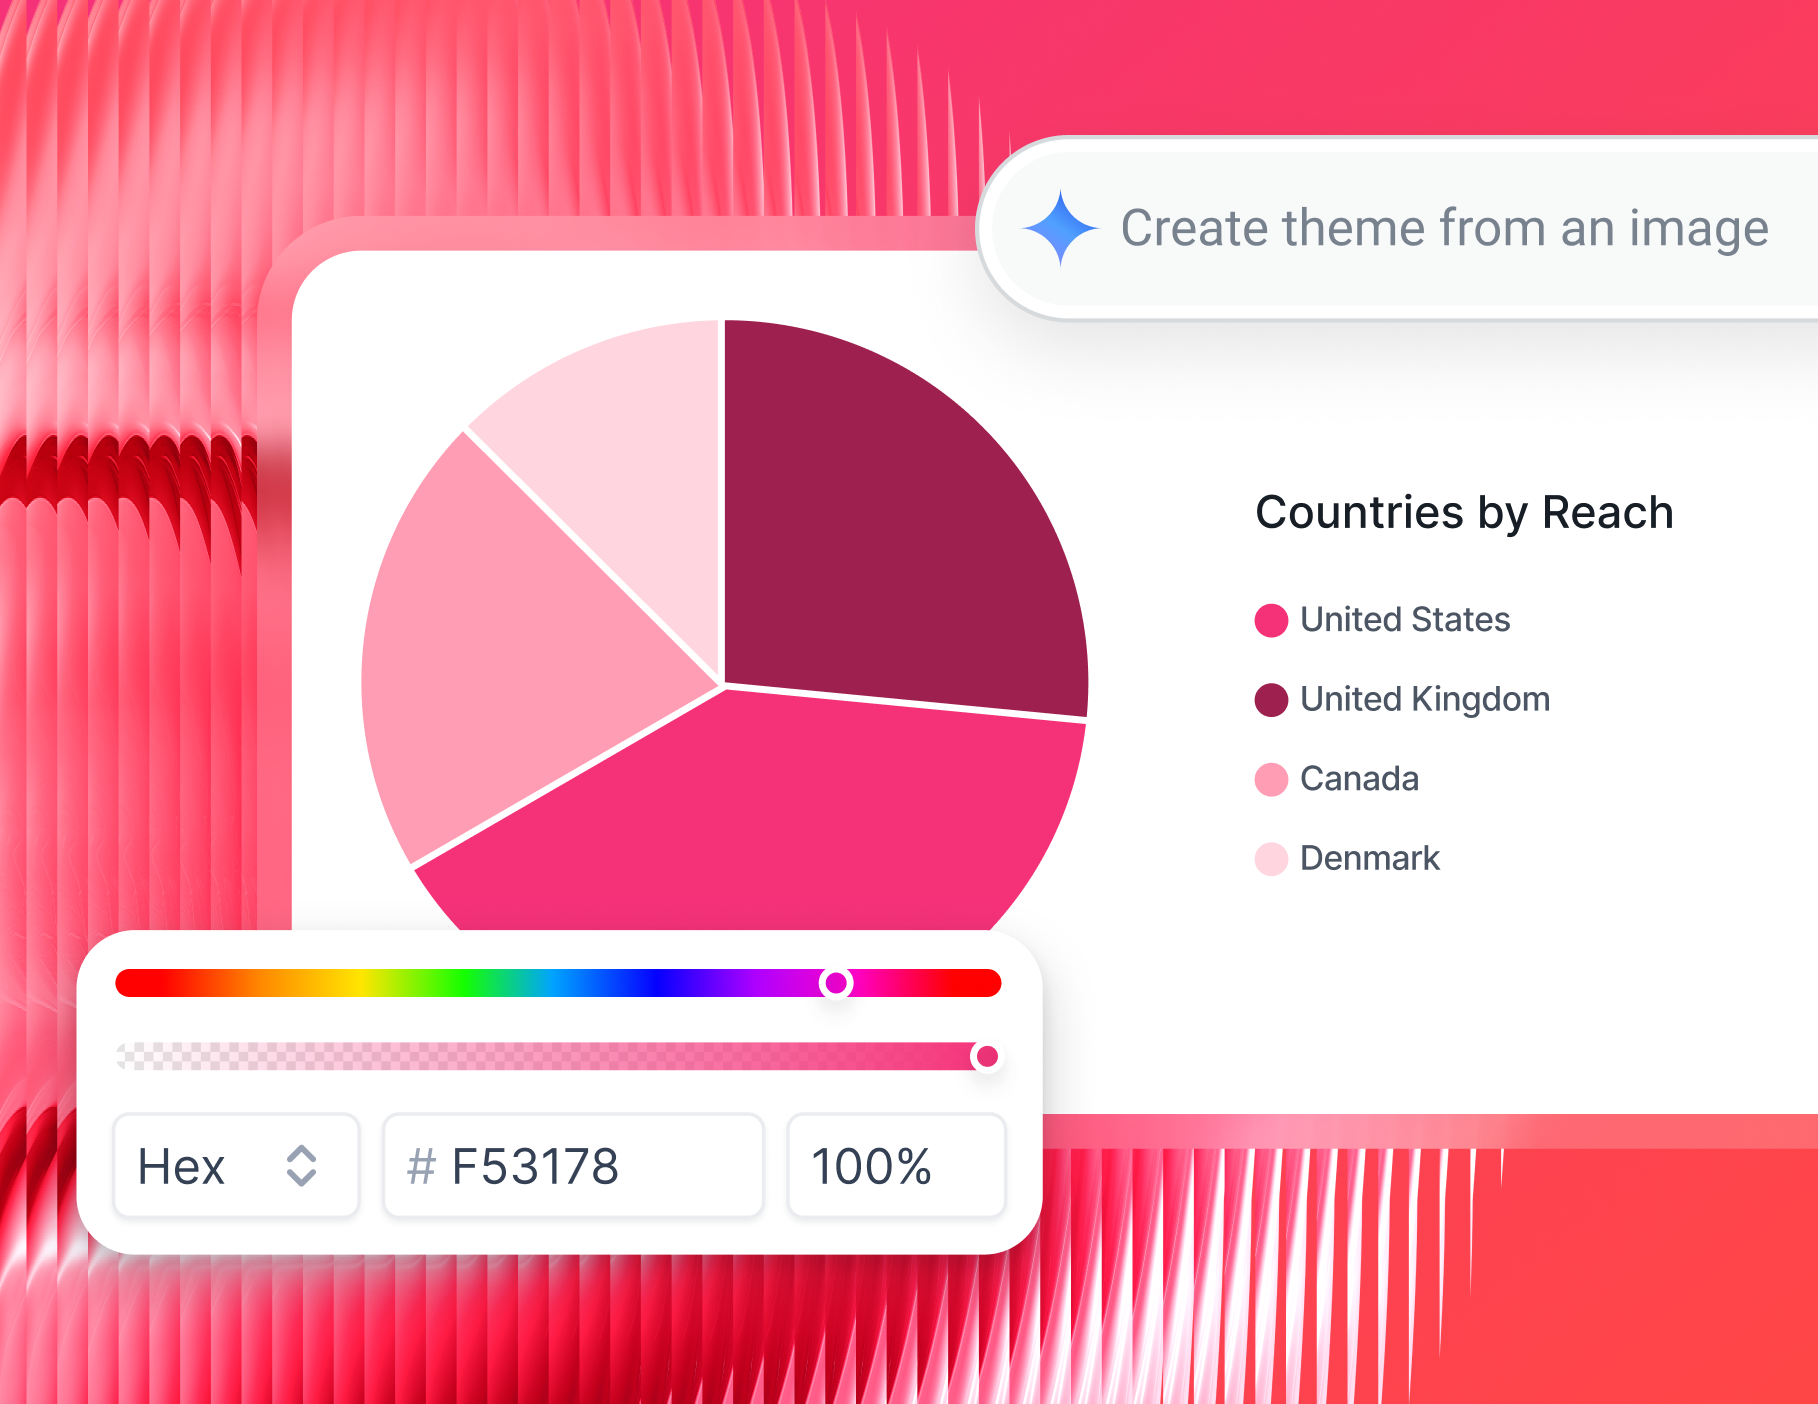
2. Brand it automatically. Upload your client's logo or a screenshot of their brand kit, and IQ Themes applies the right colors, fonts, and icons across the entire report.
White-label YouTube reports for all your clients - without touching a design tool.
3. Add written performance summaries in seconds. IQ reads the data already in your report and writes plain-language summaries you can edit, adjust in tone, or send as-is.
No writing from scratch after every reporting cycle.
Want full control over the layout? Start from a blank canvas and build using Whatagraph's drag-and-drop widget library.
With every widget, you can:
- Change labels, sizes, icons, and layout
- Apply custom formulas and blended metrics
- Match color schemes to each client's branding
- Set reporting periods, adjust currencies, or hide irrelevant sections
However you build your report, only add widgets that tie directly back to what the client actually cares about.
As Peter Murphy Lewis, CEO of Strategic Pete, puts it:
I only include KPIs directly tied to the client's goals. Every metric has to justify its presence in the report. Consistency also matters - use the same report format every time so clients can quickly find and interpret what matters to them.
4. Build internal YouTube KPI dashboards
Client-facing YouTube reports are only part of the picture. Agencies that scale well also need internal visibility across all accounts - without checking each one manually.
Whatagraph's Overviews gives your team a live internal dashboard covering every client's YouTube channel at once.
Use it to:
- Track YouTube channel metrics across all client accounts in one place
- Flag channels that are underperforming against targets before the client notices
- Monitor Account Manager workload and reporting status at a glance
- Set goals and spending caps with real-time alerts when something goes off-track
Slice by client, region, account manager, or channel type - whatever fits how your agency is structured. This gives your team the visibility to act proactively, not reactively.
5. Use AI to write summaries and answer client questions
Clients don't want a wall of charts. They want to know what happened, why it matters, and what you're doing about it.
On Whatagraph, you can ask IQ to generate performance summaries based on any YouTube channel data and timeframe.
For example, your team can type:
- "Summarize YouTube channel performance for a client meeting"
- “Compare YouTube and TikTok performance across all my clients”
For each summary, you can choose short or long format, adjust the tone, and edit as needed before sending.
6. Automate YouTube reports for all your clients monthly
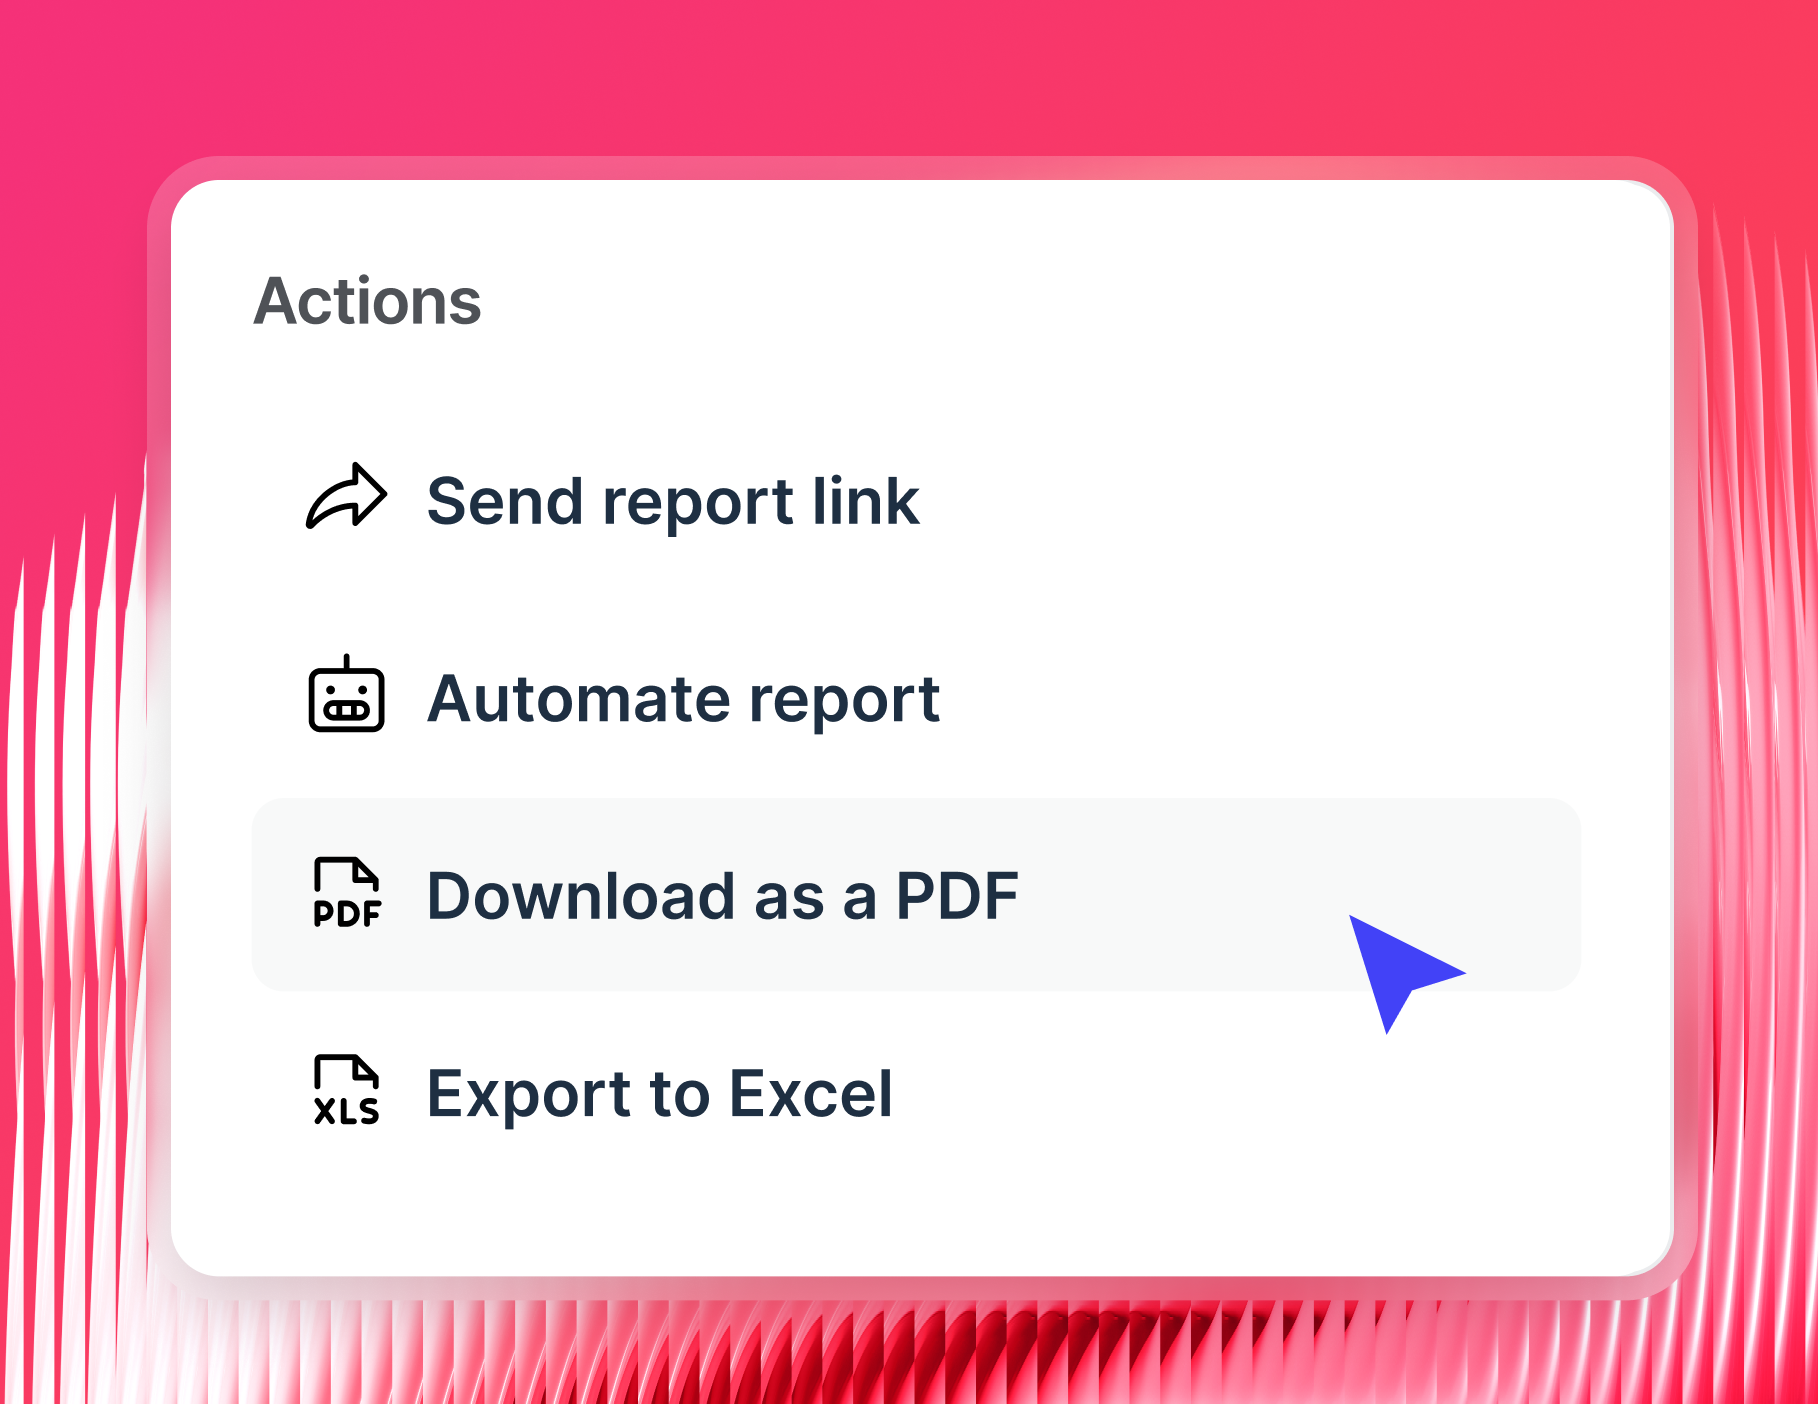
Once a report is built and reviewed, Whatagraph handles the distribution automatically.
- Automated emails: Schedule YouTube reports to go out daily, weekly, or monthly - at the time your client prefers
- Live links: Give clients access to a real-time YouTube analytics dashboard they can check anytime
- PDF or CSV exports: For clients who prefer offline access or want to archive monthly results
- White-label delivery: Send reports from your own custom domain with your agency's sender details
- BigQuery or Looker Studio: Store or build on top of your data
You can also enable IQ Chat on any shared report link, so clients can ask their own questions about the data and get instant answers - without emailing your account team.