Meet Performance Monitoring: Your Solution to Scattered Data & Insights
With Performance Monitoring, it’s refreshingly easy to group, organize, and monitor your scattered data in one place, and get actionable insights for your clients and your agency.

Oct 16 2024●3 min read


Over the past nine years, we’ve worked with thousands of digital marketing agencies ranging from SEO and PPC to full-scale operations.
One thing that constantly comes up is just how much agencies are under pressure to perform. Competition is fierce, and you need to constantly prove your value to retain clients and onboard new ones.
But we’ve also seen how much agencies are buried under scattered data.
Agencies run multiple campaigns on multiple platforms for dozens of clients. And different platforms use different metrics and dimensions, making it way more complex to centralize and standardize data in one place.
You need to spend 4-5 hours a week just to manually compile data on spreadsheets or to use clunky tools.
This process is so time-consuming that you don’t have time for important tasks, like strategy and client retention.
We get it, and we’re here to help.
We’re excited to announce Performance Monitoring—a set of solutions that make it refreshingly easy to turn scattered data into actionable insights in minutes.
But before we dive in, here’s a quick look at how Whatagraph has evolved over the years to give you the full context.
Whatagraph’s Journey Through Time
Our journey with marketing data began in 2015.
I was running a successful digital marketing agency at the time, and even though we just had a handful of clients, we needed to create dozens of reports for each account across different channels.
Like many agencies today, we resorted to free reporting tools, only to find that they were too basic and hard to use. We were still creating reports from scratch and struggling with managing large volumes of data.
That became our first goal when we founded Whatagraph—to make data management and reporting easy for marketers.
How? By improving agencies’ workflow of connecting, visualizing, and sharing marketing data.
We developed native integrations, a great report and dashboard builder, and reporting automations to make this process scalable.
Then, in January 2024, we took a huge step forward.
We expanded into an all-in-one data platform, not just for reporting, but also for organizing data (unifying, blending, aggregating).
Since then, we’ve also added data transferring, where you can ship your data to BigQuery automatically on Whatagraph. (We’re launching more destinations soon—stay tuned!)
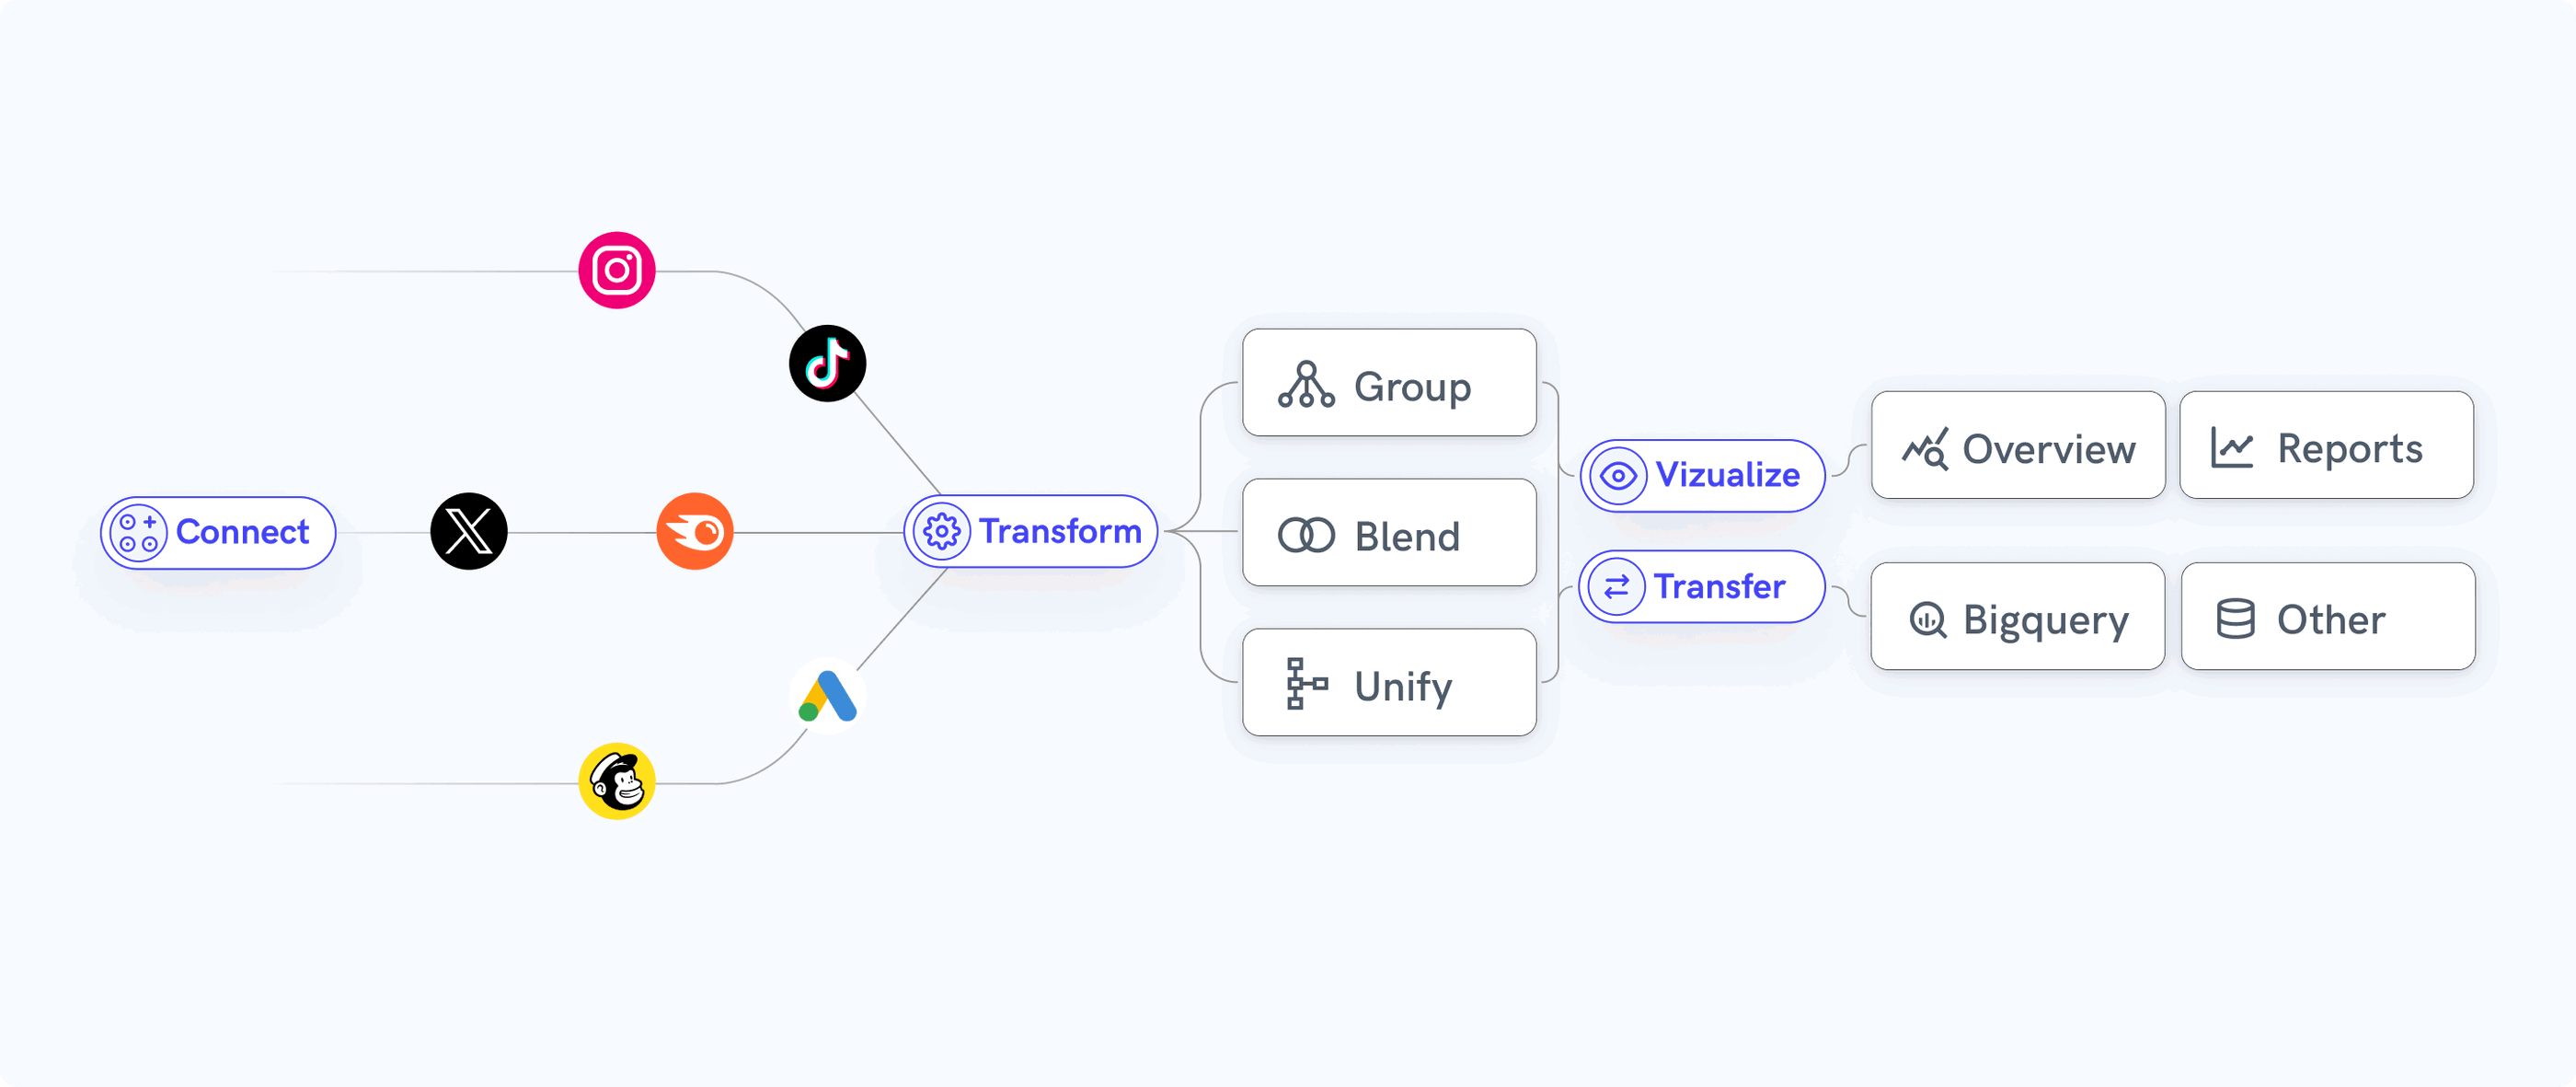
Being able to connect, organize, visualize, and share your data on one easy-to-use platform means:
✅ You save hours of manual work per week.
✅ You don’t need to tinker with or pay for so many different tools.
✅ Your data is safe and secure on one platform, rather than being shared with different platforms.
✅ Your reports are neat, organized, and impactful.
✅ It’s easy to onboard new employees and clients.
These are real benefits that our clients are seeing. Here’s what they’re saying online:
“I appreciate Whatagraph’s seamless data integration, customizable reporting, and interactive dashboards. It empowers me to effortlessly transform complex data into meaningful insights, enabling better-informed decisions and more impactful communication."
Capterra verified review by Roberto G., ITI Project Manager
“To me, Whatagraph is like the Tesla of digital analytics tools, their clean and simple way to present complex marketing data. I highly recommend it to anyone working with marketing analytics who values efficiency and clarity in their reporting.”
G2.com review by Márcio D. Customer Advisory Board Member
With Performance Monitoring, we’ve made it even easier for you to group, organize, and monitor your data. Let’s dive in.
Introducing Performance Monitoring
Raise your hand if you’ve ever had questions like these at your agency:
✋: How is the marketing campaign we launched last month performing?
✋: Is this campaign or channel actually bringing in leads?
✋: Are we overspending on campaigns/channels?
✋: Why is X channel performing better (or worse) than Y channel?
✋: How are our Account Managers performing? Who’s doing well and who needs help?
It’s difficult to answer these questions right away if your client data is scattered across different platforms, metrics, and dimensions.
You’ll need to manually download data from all your platforms, upload it to spreadsheets, and clean it up to get insights.
But this process takes up so much time that by the time you get insights, they’re already outdated. Plus, manual work means room for human errors, making your insights inaccurate.
This is why we built Performance Monitoring.
With Performance Monitoring, it’s so much easier to organize and analyze your data any way you’d like and get insights in seconds.
There are three key things you can do with Performance Monitoring:
1. Group 100s of similar data sources under one roof using “Source Groups”
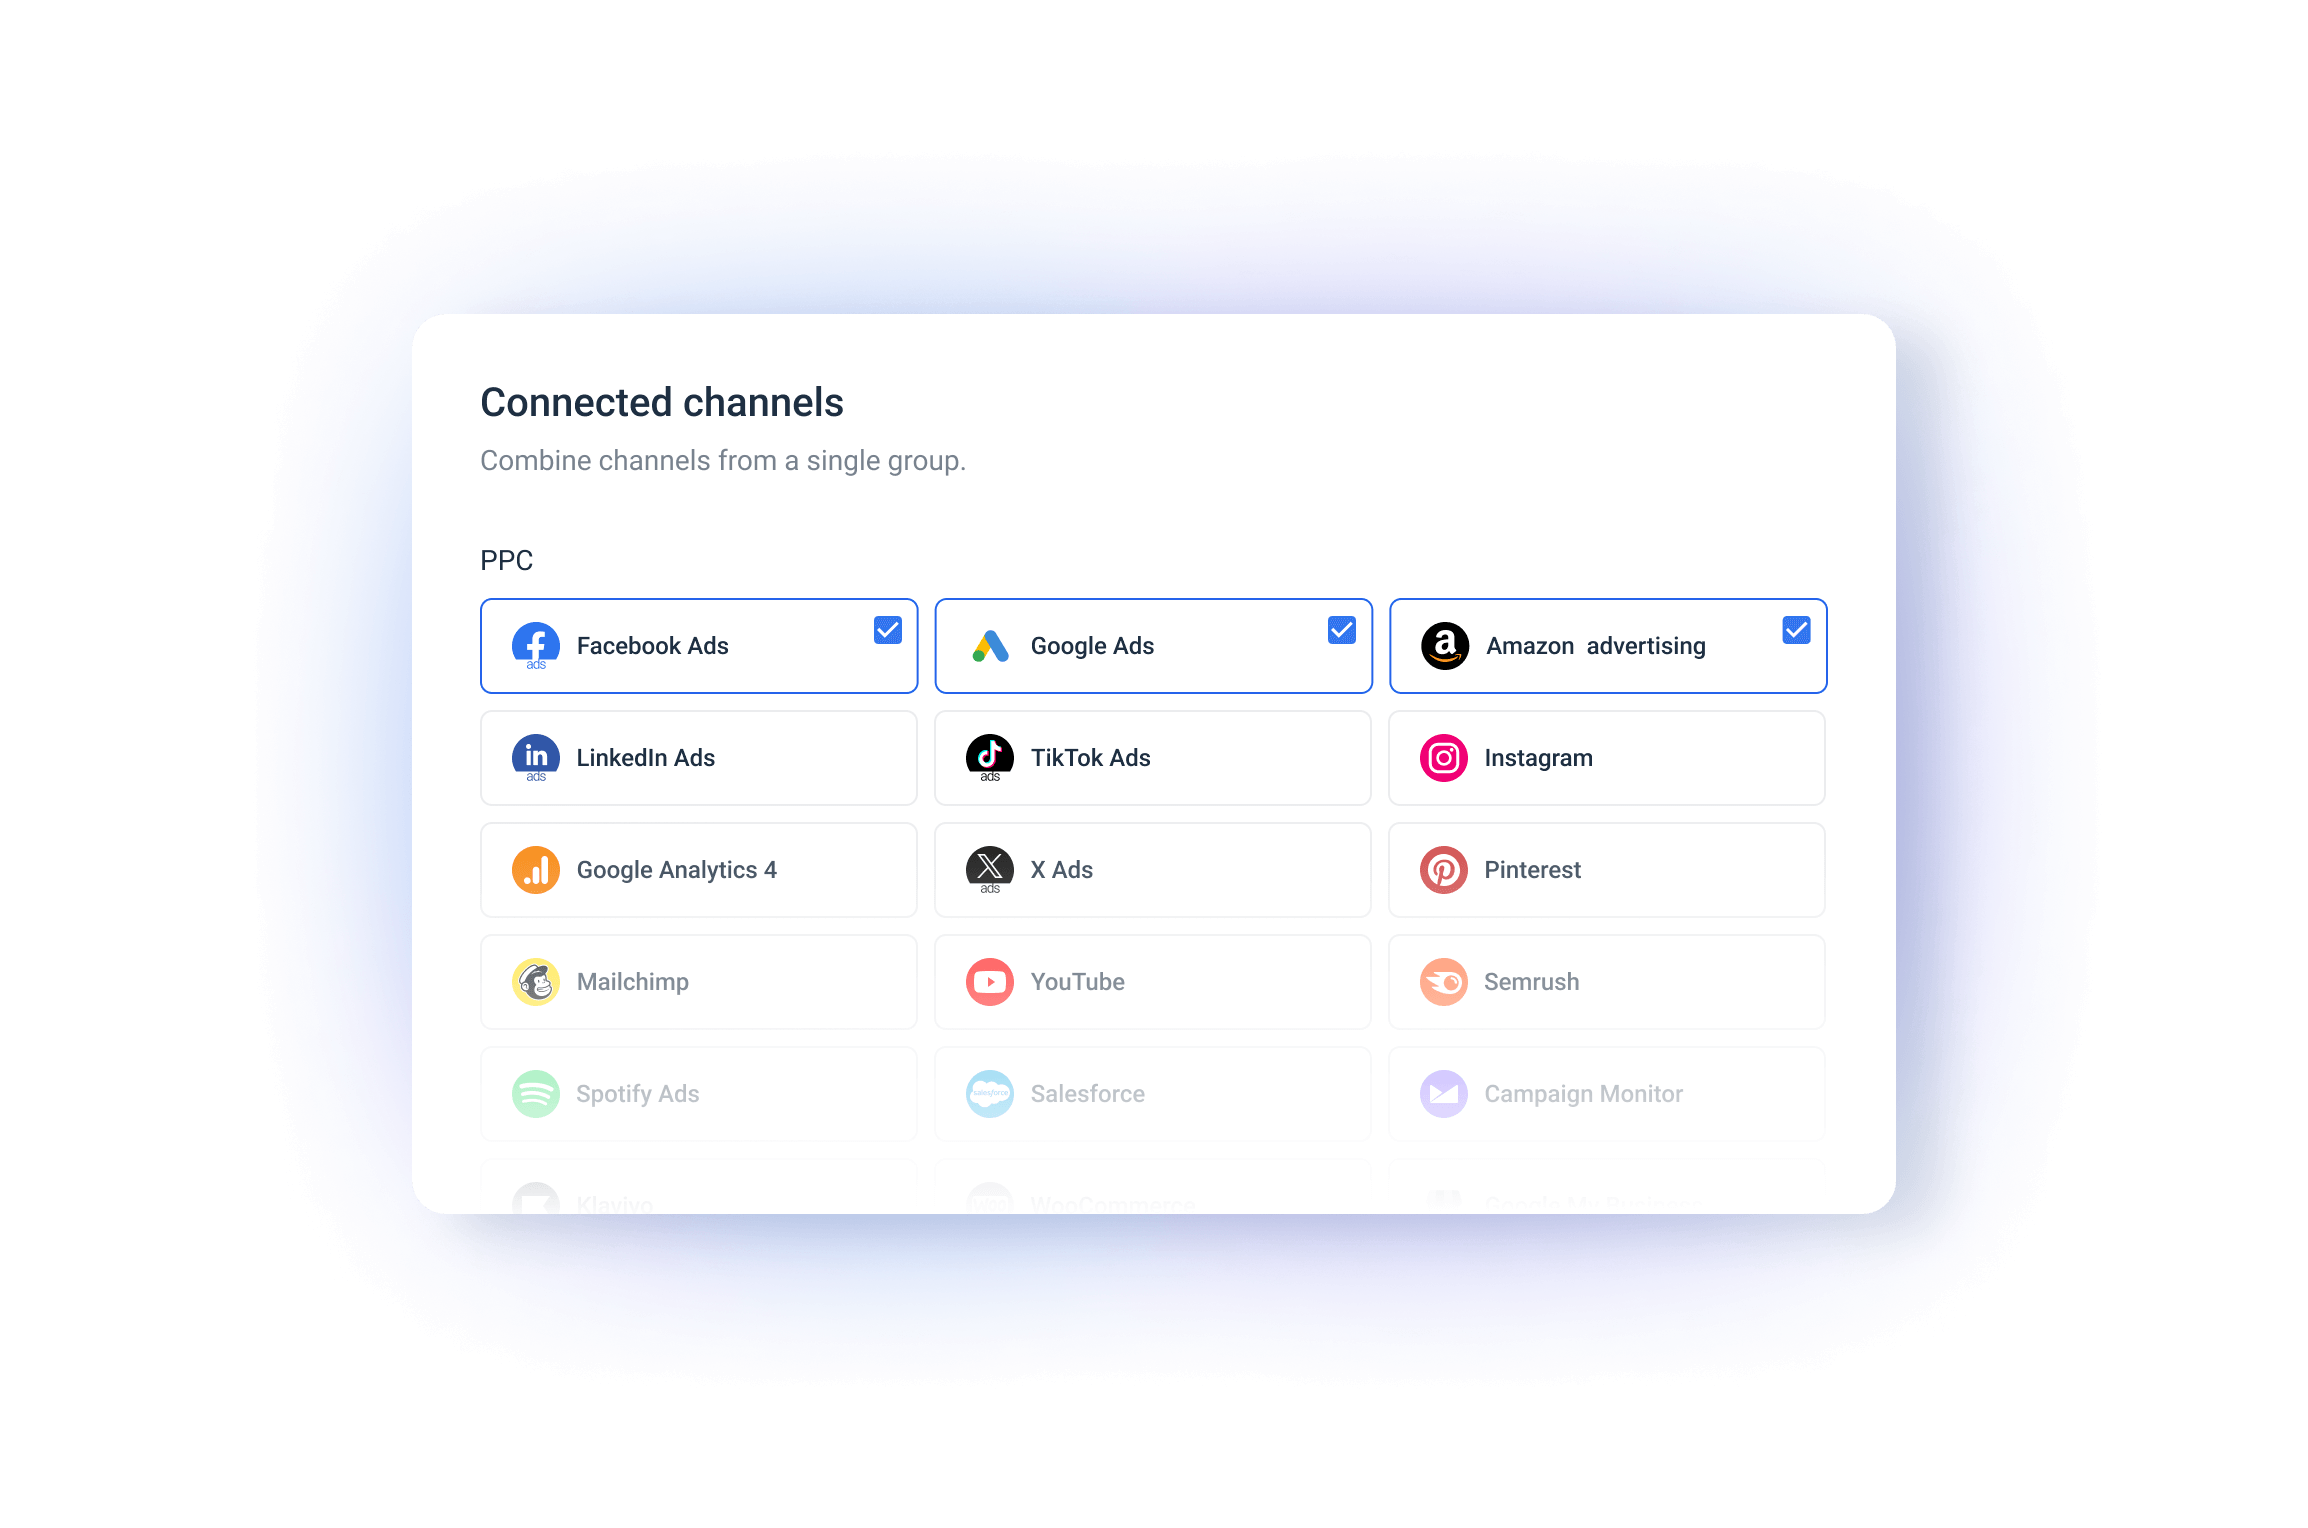
Source Groups help you combine data from multiple different sources even if they’re from different channels.
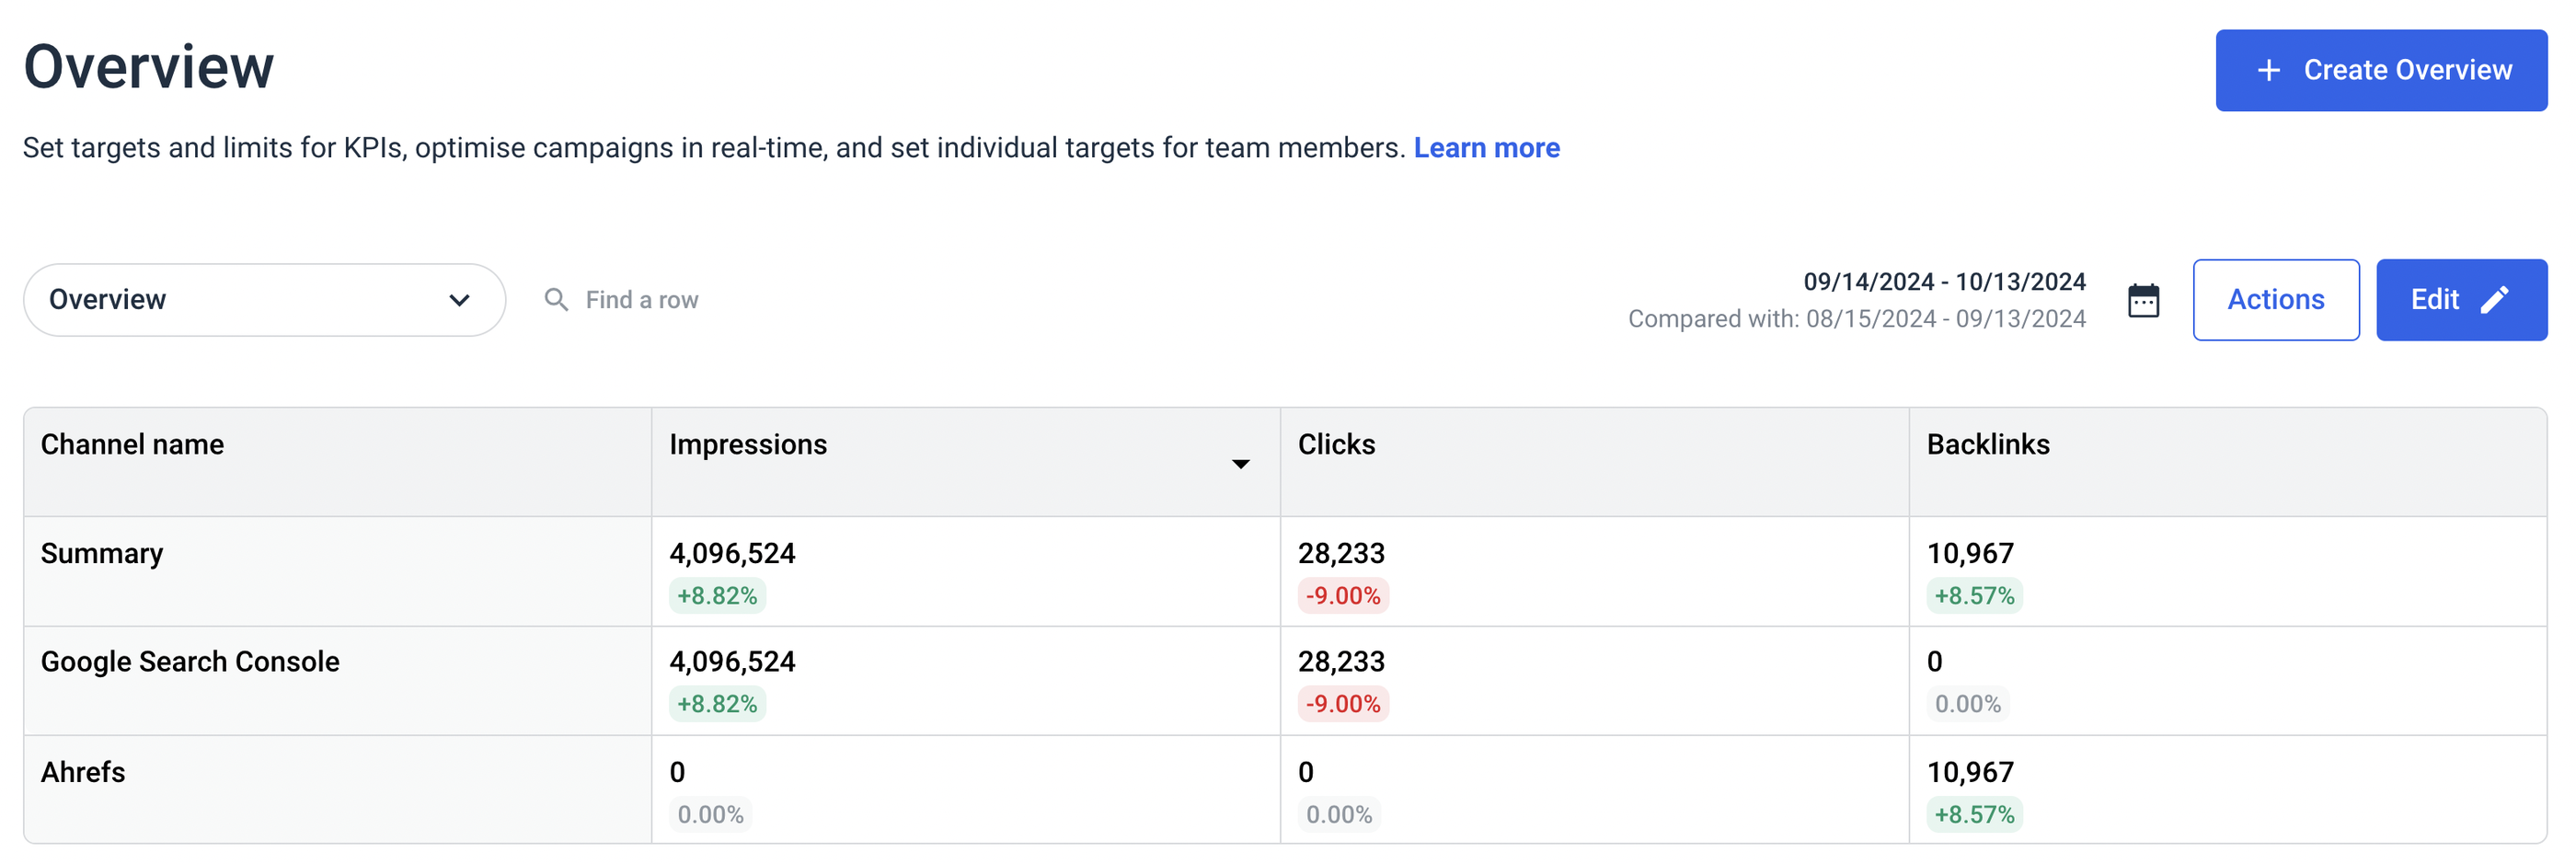
For instance, say you want to see a unified view of SEO performance from Google Search Console and Ahrefs.
Previously, you’d need to do a complicated blend to combine matching metrics and dimensions from GSC and Ahrefs.
Now, you can create a “Source Group” in seconds using a simple workflow, and Whatagraph automatically combines these metrics and dimensions for you.
The result is a unified Source Group with aggregated metrics from both channels which you can add to your reports.
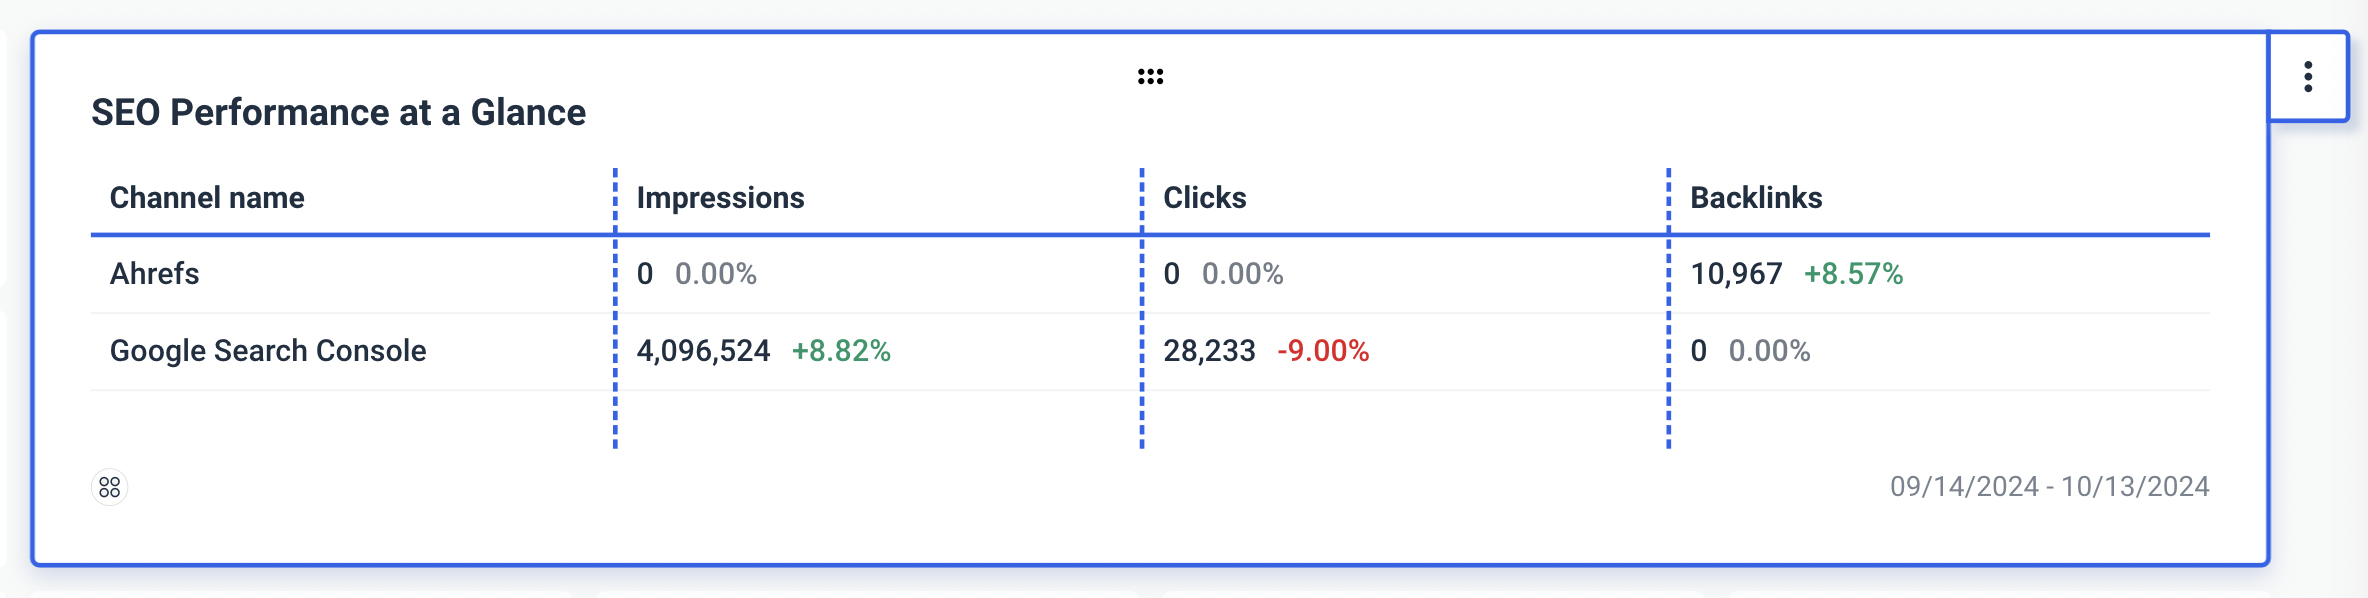
This way, your reports are neat, tidy, and organized and you can clearly see where performance is going up or dipping, and where your focus should be. (For example, in the image above, I know that I should be focusing on improving “Clicks”.)
In short, Source Groups help you answer questions like:
✅ How is our [SEO, PPC, social] performance across different channels?
✅ Which channels are contributing the most to the business result we want (e.g. leads)?
✅ What are the key trends in performance across various data sources and channels?
2. Slice and dice data any way you want with “Custom Tags”
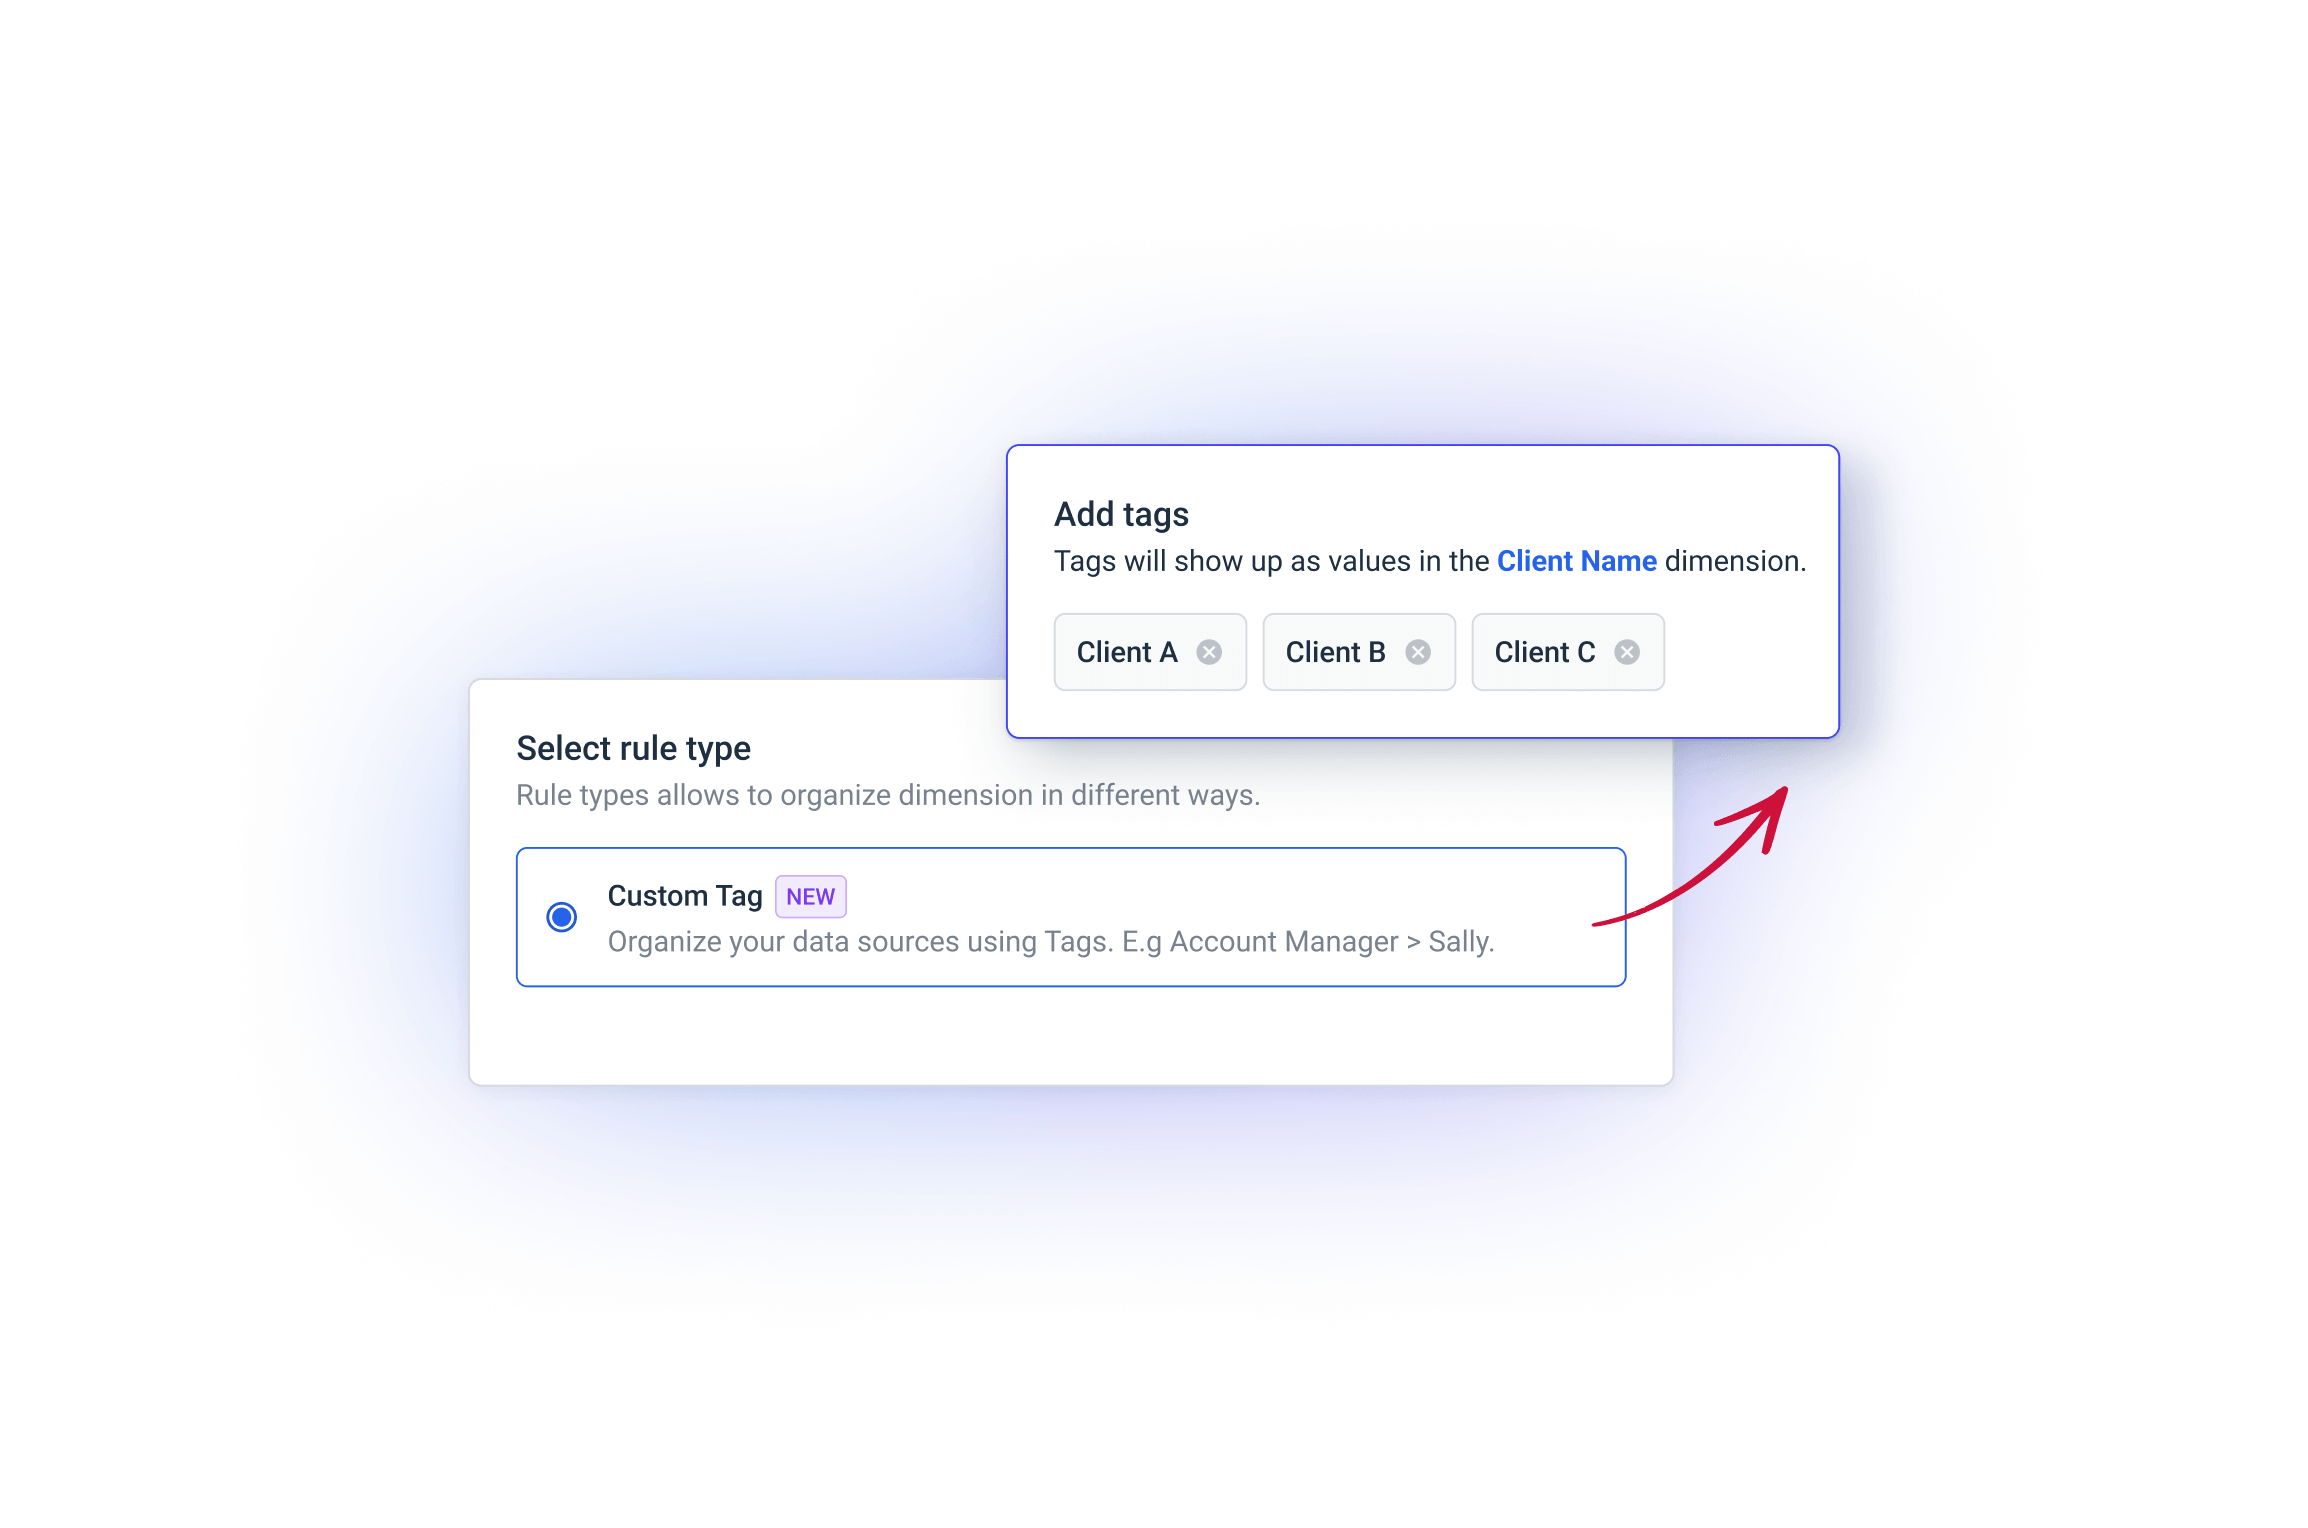
Custom Tags are easy ways to add custom attributes to your data sources. You can use them in different ways to meet your specific tracking needs, such as:
- Tags by Client Industries: Easily group sources that are related to particular client industries.
- Tags by Regions: Organize sources by the specific regions your clients operate in.
- Tags by Account Managers: Assign sources to team members or account managers responsible for them.
Custom Tags significantly reduce clutter and help you sort large volumes of data efficiently.
For instance, say you just hired a new Account Manager, Bob, and you want to see how his clients’ campaigns are performing so you can give guidance if needed.
You can simply create a “Bob” tag and add that to data sources he’s managing.
Then, you can visualize ONLY the data sources with the “Bob” tag and see his clients’ campaigns performance at a glance.
In short, Custom Tags help you answer questions like:
✅ How are campaigns performing in specific industries or regions?
✅ Are we performing well in our most important “Tier 1” locations?
✅ How is each Account Manager performing? Who can we learn from and who needs help?
3. Visualize key metrics from all your sources in “Data Overview”
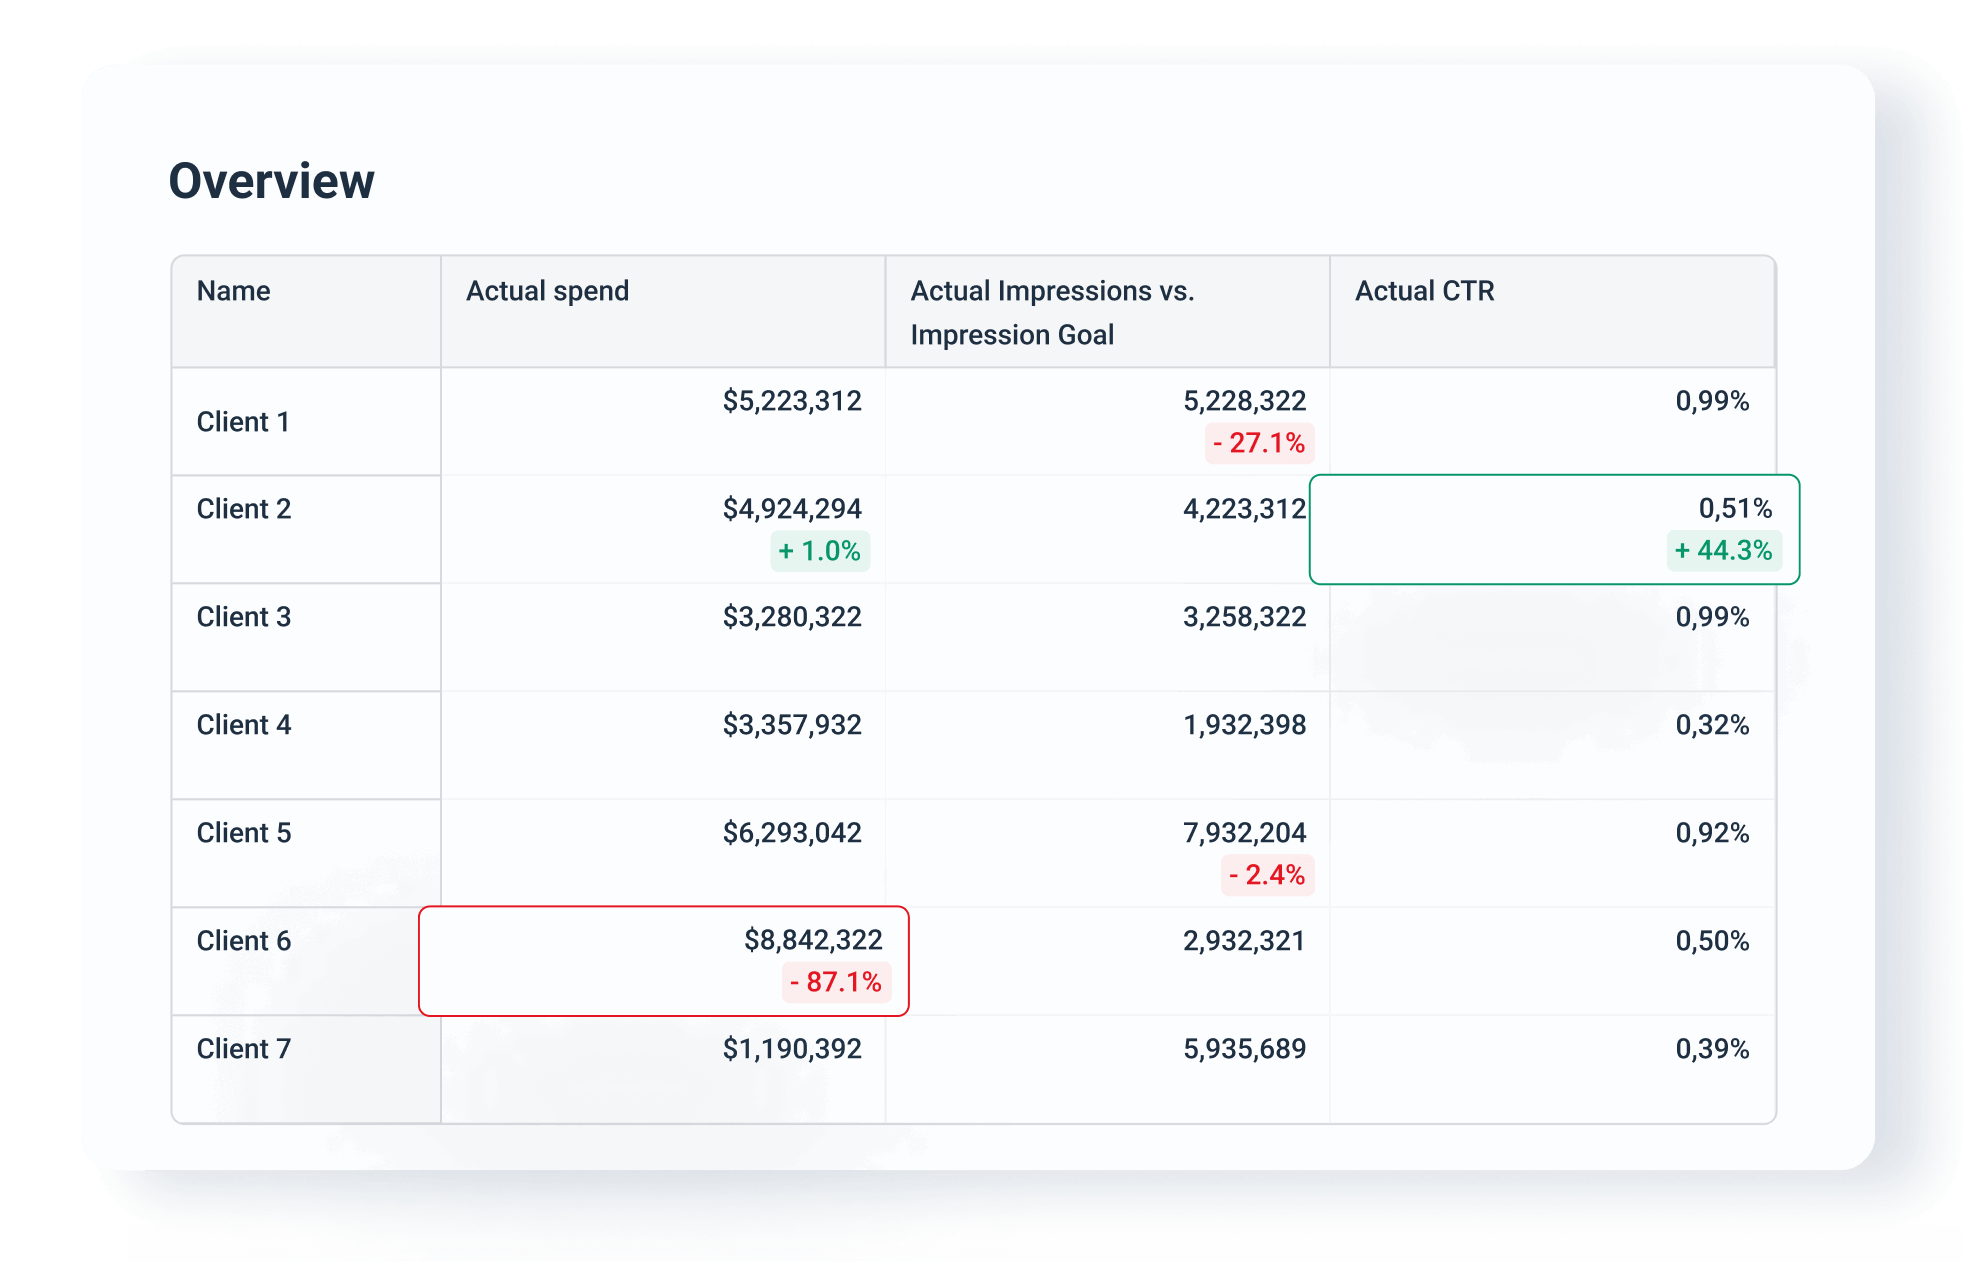
Data Overview helps you visualize large volumes of data efficiently. You can create overviews for “Cross Channel” or “Single Channel” metrics.
With Cross Channel, you can visualize metrics from data blends and Source Groups.
For instance, an overview of the metrics under your new Source Group, “SEO Performance” would look like this:
This overview is mainly for your internal team members (e.g. Account Managers) to understand performance at a glance and devise optimization strategies for campaigns and channels.
In short, Data Overview helps you answer questions like:
✅ Which channel is delivering the best performance?
✅ Is a specific metric (e.g. Impressions) trending up or down?
✅ How can we optimize our campaigns based on current data?
The Bottom Line
With all these insights neatly centralized on one platform, you can strategize better for your clients and make fast decisions to boost ROI and lower costs.
Over time, you deliver smashing results for your clients and clearly demonstrate your value. Your clients succeed, you succeed, and you form a long-term partnership.
Your agency’s processes become more efficient, freeing up time from spreadsheets and clunky tools for strategy and client retention. Your Account Managers stay motivated and get the support they need.
Want to see how all this can help YOU?
You can book a data consultation and product showcase with us.
Tell us the challenges you’re facing with your current data and reporting set up, and we’ll help you resolve them.
Already a Whatagraph customer? Get in touch with your Customer Success Manager or reach out to us via the live chat to learn more.
Published on Oct 16 2024
WRITTEN BY
Justas MalinauskasJustas is the CEO and Co-Founder of Whatagraph. Frustrated with inefficient reporting and data management processes when he was leading a digital marketing agency, he founded Whatagraph in 2015. His main mission? Empower marketers to make data-driven decisions, fast. Now, he leads a team of 60+ employees worldwide.