8 Best Marketing Agency Reporting Tools to Scale Up [2026]
Reporting eats more agency time than most teams realize - HubSpot puts it at around 4-5 hours per client each month.
That's the time you could be spending scaling your business - building proposals for new clients, retaining current ones, building automation systems, e.t.c.
The right marketing agency reporting tool lets you scale, without adding on more headcount or spending thousands of dollars on a reporting stack that keeps breaking.
In this article, I’ll review 8 best tools in the market, including the features, pros and cons, and pricing of each.

Jun 15 2026●10 min read


Reports are key to building trust with your clients, and keeping them at your agency.
But here’s the catch: your reports need to be accurate, comprehensive, and engaging for clients to actually read them and understand the value of your agency.
Manually creating a report like this can take hours, but a client reporting tool can make it easier and faster.
But not every tool is created equal.
Over the past 6 months, I’ve talked to agency leaders and marketing specialists to find out what really matters in a client reporting platform. Here’s what they said:
✅ Connector stability: Native, directly managed integrations keep your data flowing reliably - no third-party pipelines to babysit.
✅ Data blending and custom metrics: You should be able to blend sources, standardize naming, and build custom formulas without writing a single line of code.
✅ AI reporting and automated commentary: Reports need context, not just numbers. AI summaries and MCP integrations speed up performance reviews and help you answer client questions fast.
✅ Linked templates for scale: One template update should cascade to all client reports instantly - not require rebuilding from scratch.
✅ White-labeling and custom domain: Clients should see your branding, not the tool's.
✅ MCP and AI assistant integration. In 2026, most tools have some form of MCP. The question is what the MCP connects to - raw API data or a governed, normalized data layer.
✅ Pricing model that scales: Per seat, per source, or per client - the model shapes how costs grow as you add clients.
So, with all that in mind, here are the 8 best client reporting tools agencies swear by in 2026.
8 best marketing agency reporting tools in 2026
Here’s a summary of the best marketing agency reporting tools in 2026:
| Tool | Best for | Pricing (annual) | Key differentiator | MCP/AI |
| Whatagraph | Mid-size agencies, multi-location operators | 14-day free trial | Cross-client governed data layer | Yes |
| Data Studio | Google-stack agencies on a budget | Free (Pro: $9/user/project/mo) | Free with Google sources | Limited (Pro only) |
| AgencyAnalytics | SEO agencies, per-client pricing | $20/client/mo | Per-client pricing, built-in SEO auditing | Yes |
| DashThis | Small-to-mid agencies, quick setup | From $44/mo | Simplest setup, lowest entry price | Limited |
| Klipfolio | Technically oriented analysts | From $120/mo | Deep formula-driven customization | Beta (PowerMetrics only) |
| Databox | Enterprises with dedicated data engineers | From $79/mo (agency) | Goals, anomaly detection, benchmarks | Yes |
| NinjaCat | Large enterprise agencies | Custom (est. $1,500+/mo) | 100+ pre-built AI marketing agents | Yes |
| TapClicks | Large ecommerce and franchise agencies | Custom (est. $599+/mo) | AI-generated decks and email summaries | Yes |
We’re starting off with our own, Whatagraph, because we built it specifically for agencies like yourself, and covers all your needs. Let’s look at how.
1. Whatagraph
Best for: mid-size agencies that want to scale client count without scaling reporting headcount
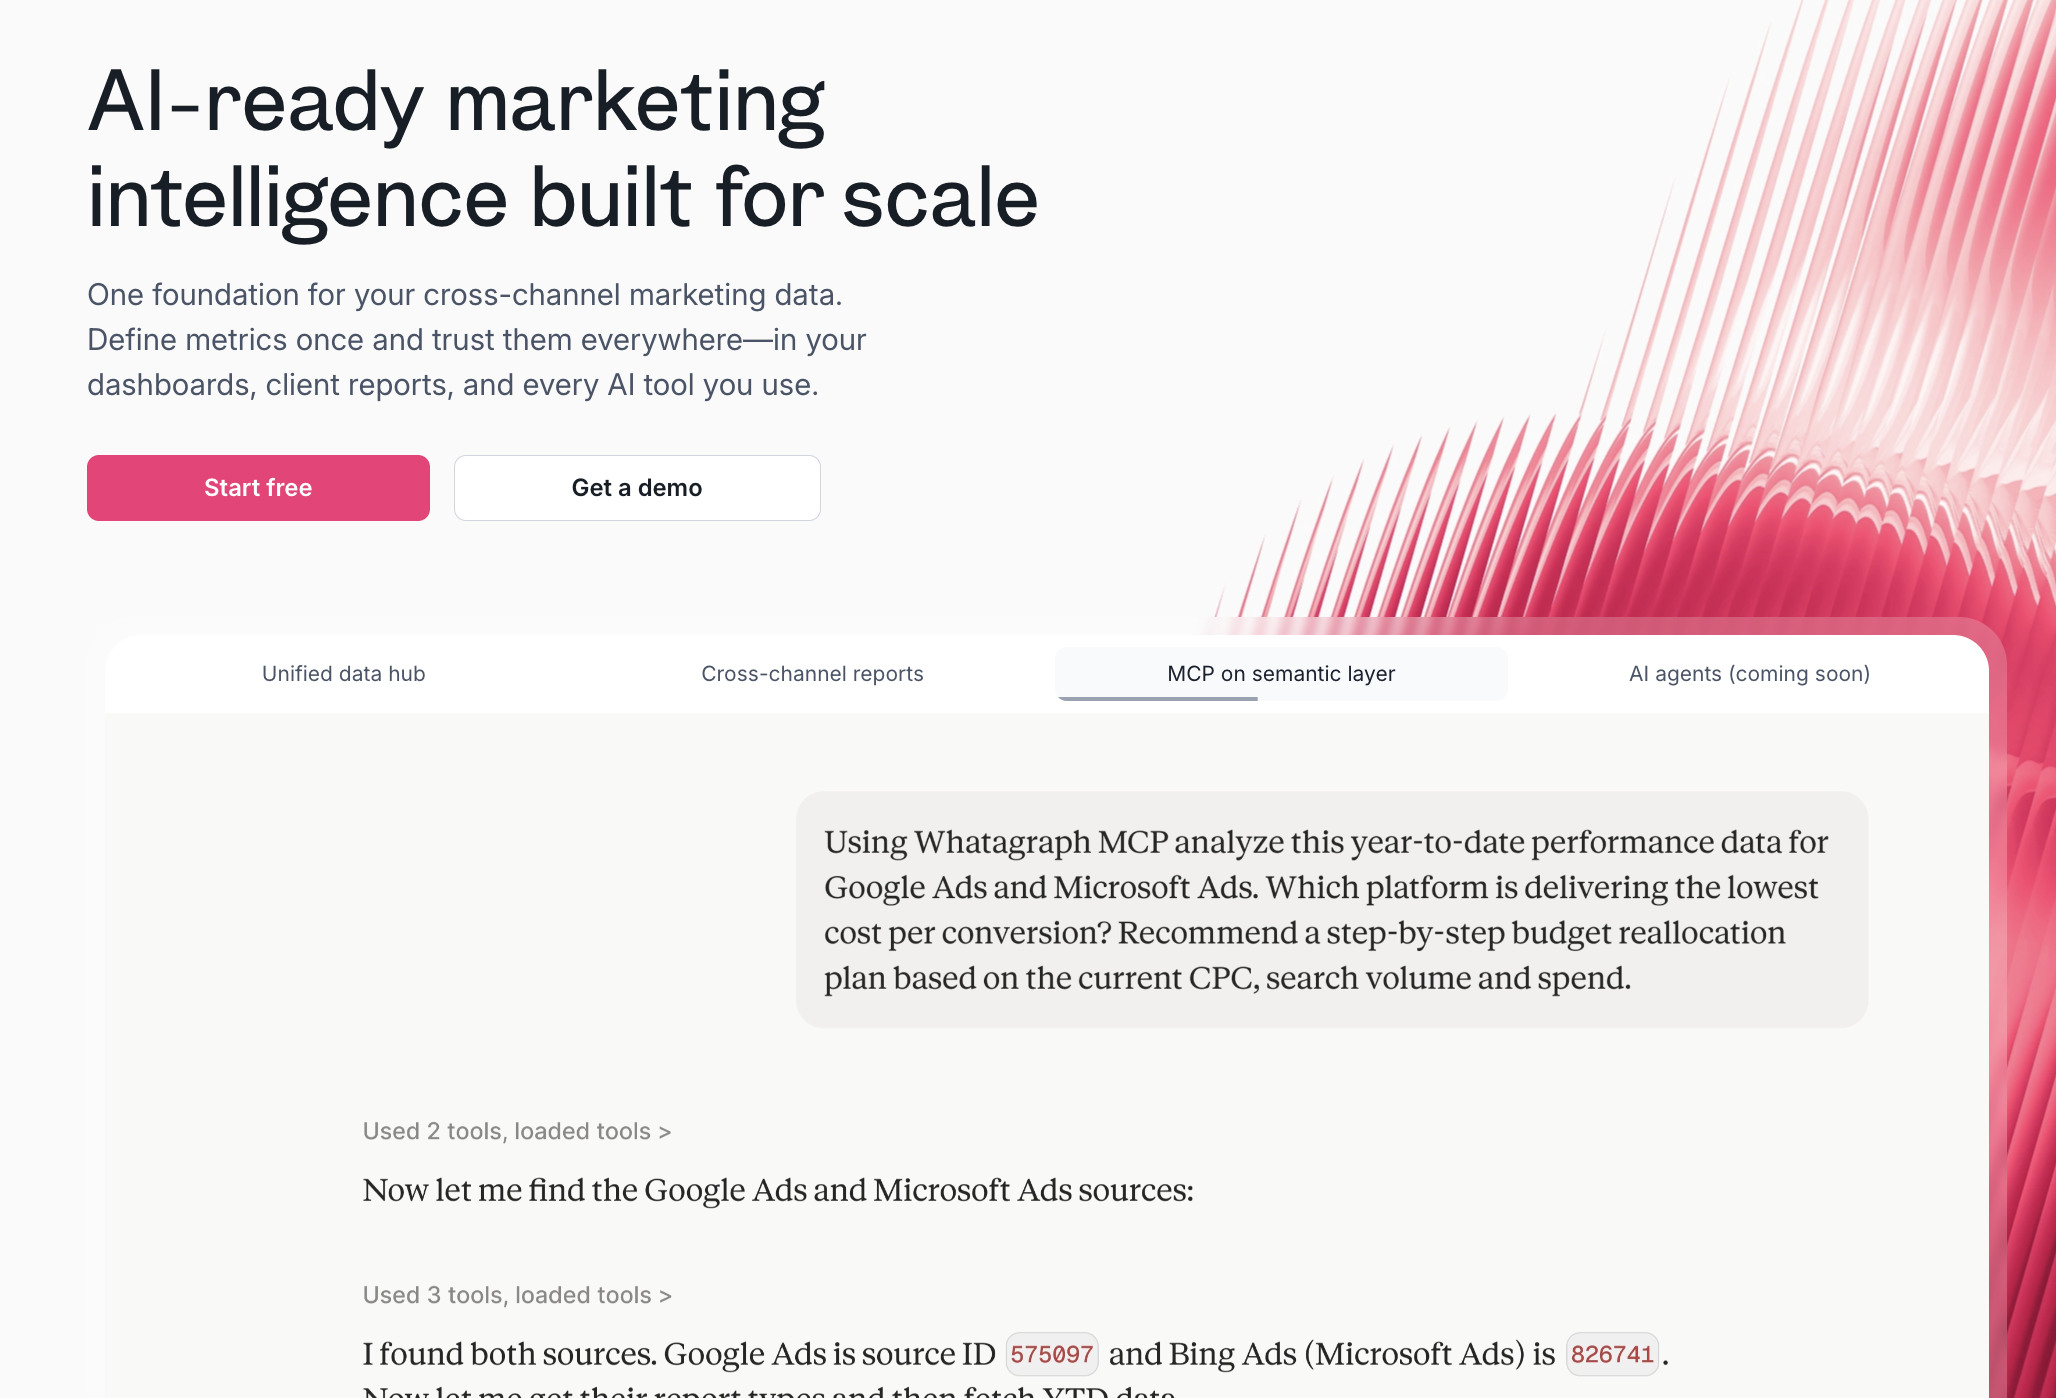
Whatagraph is a marketing intelligence platform built for agencies reporting at scale. Everything runs on one governed data foundation: you define each metric once, and the same numbers power your client reports, dashboards, and AI tools.
Here's how it works:
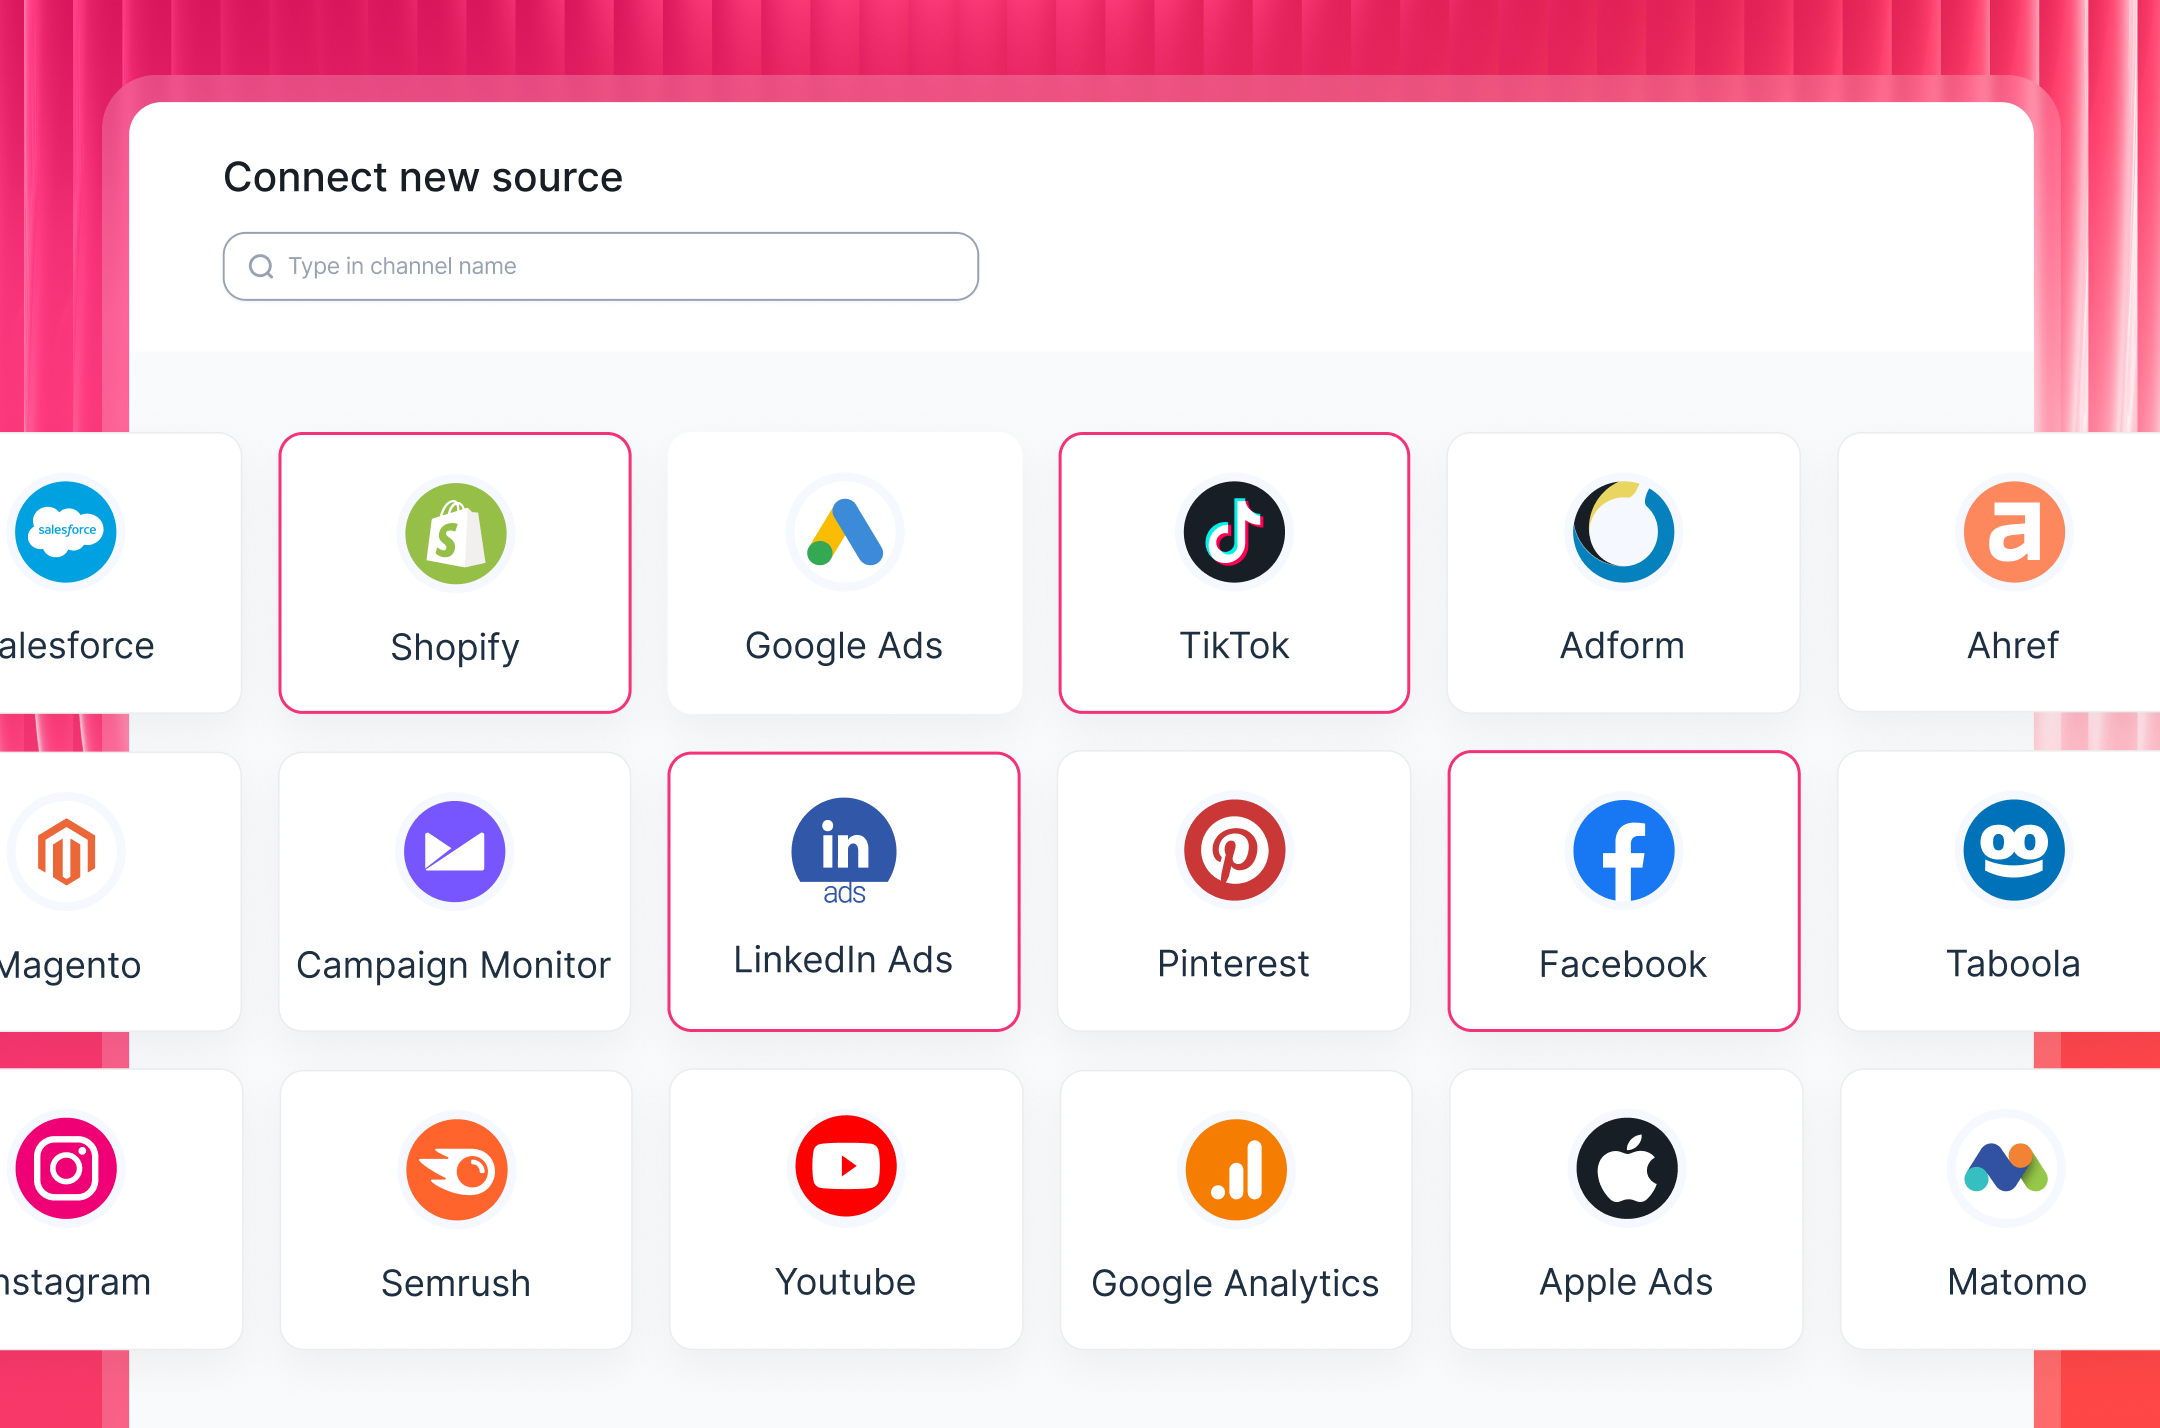
1. Connect your data. Pull client data from 60+ marketing platforms (Google Ads, Meta, GA4, StackAdapt, and more) through native, fully managed connectors with 99.95% average uptime. There are no third-party pipelines to babysit, and if there's a bug, Whatagraph's own engineers fix it, not you.
Tanja Keglić, Performance Marketing Manager at Achtzehn Grad agency, says:
We don't have any connection issues on Whatagraph at all. We just connected the platforms once, and that was it. It's very, very quick when loading the data on reports.
2. Define your data once. Blend sources, build custom metrics and dimensions, and standardize naming across channels without writing code. For scaling agencies, Source Groups do the heaviest lifting: combine any number of sources (say, a client's Google, Meta, and LinkedIn Ads accounts) into one group and aggregate metrics across them, no custom formulas needed.
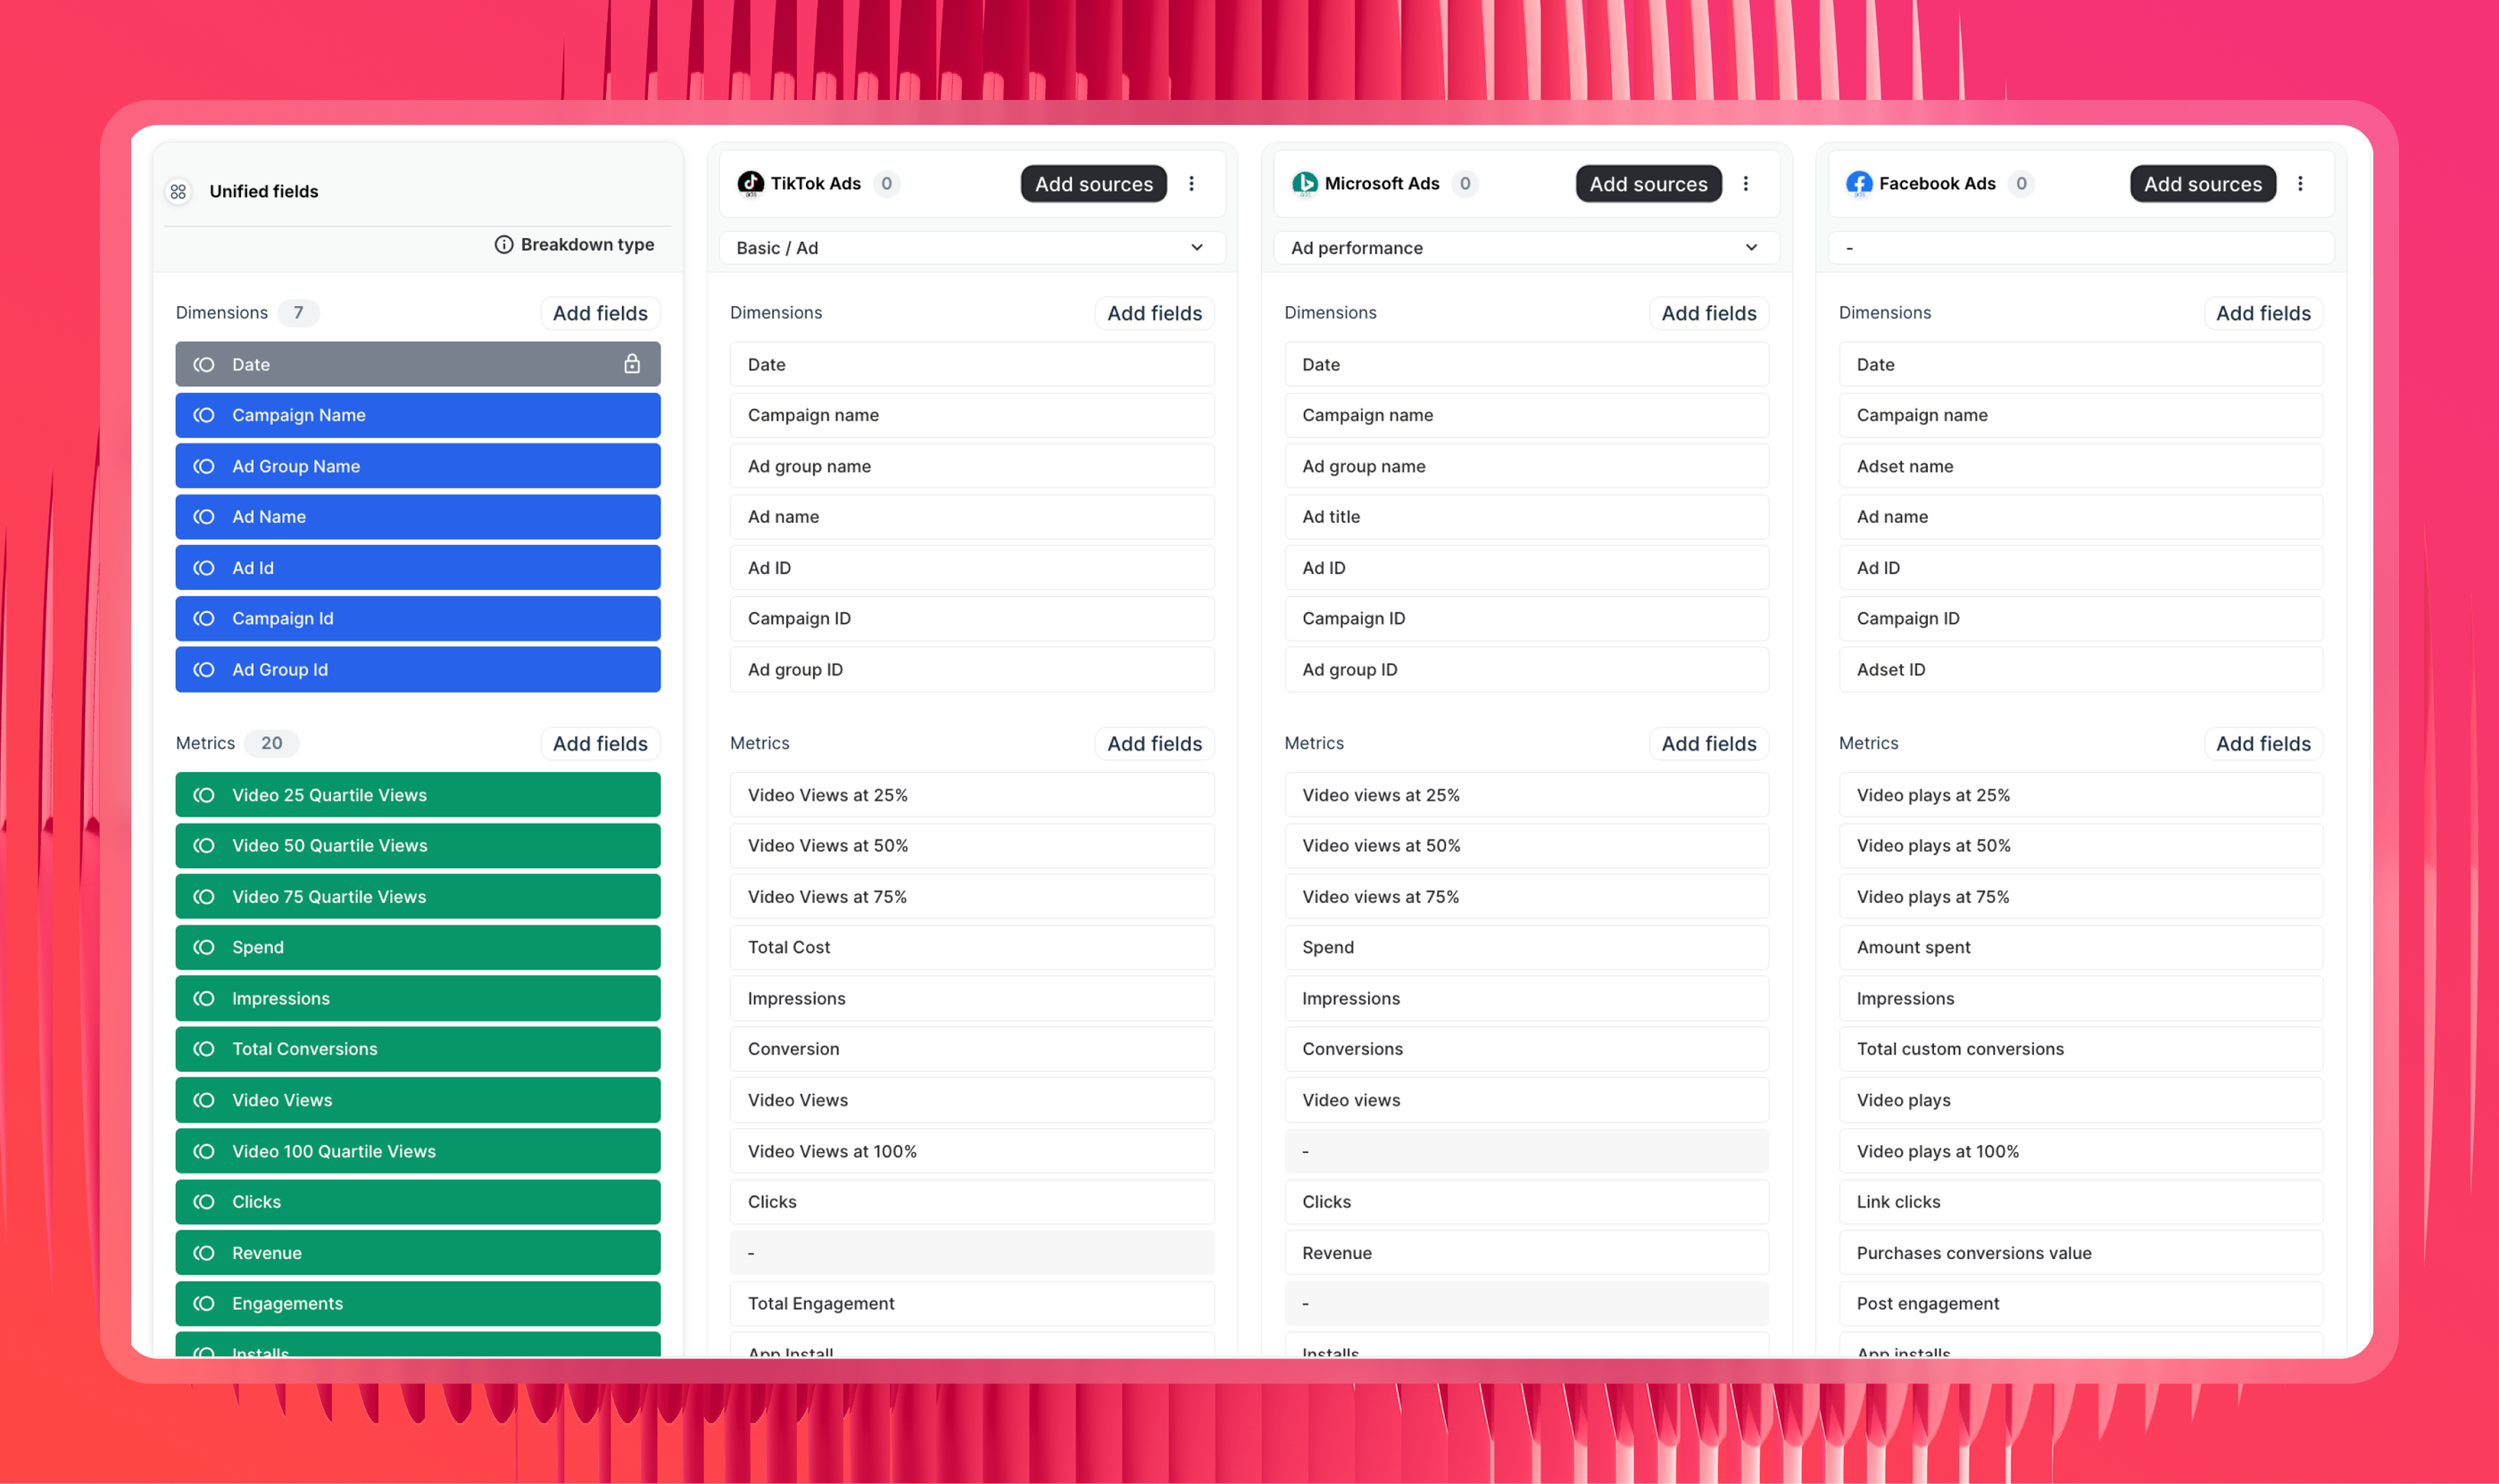
Your clients get one clear view of their performance, in their own terminology, instead of conflicting numbers scattered across sheets and platforms. Drew Cove, Senior SEO Manager at DigitalParc, says:
We use Whatagraph for all our client's reports. The ability to title metrics differently is important to us because we often report the same metrics to different clients and just need to call them differently because many clients have internal terminology that is very different from one another.
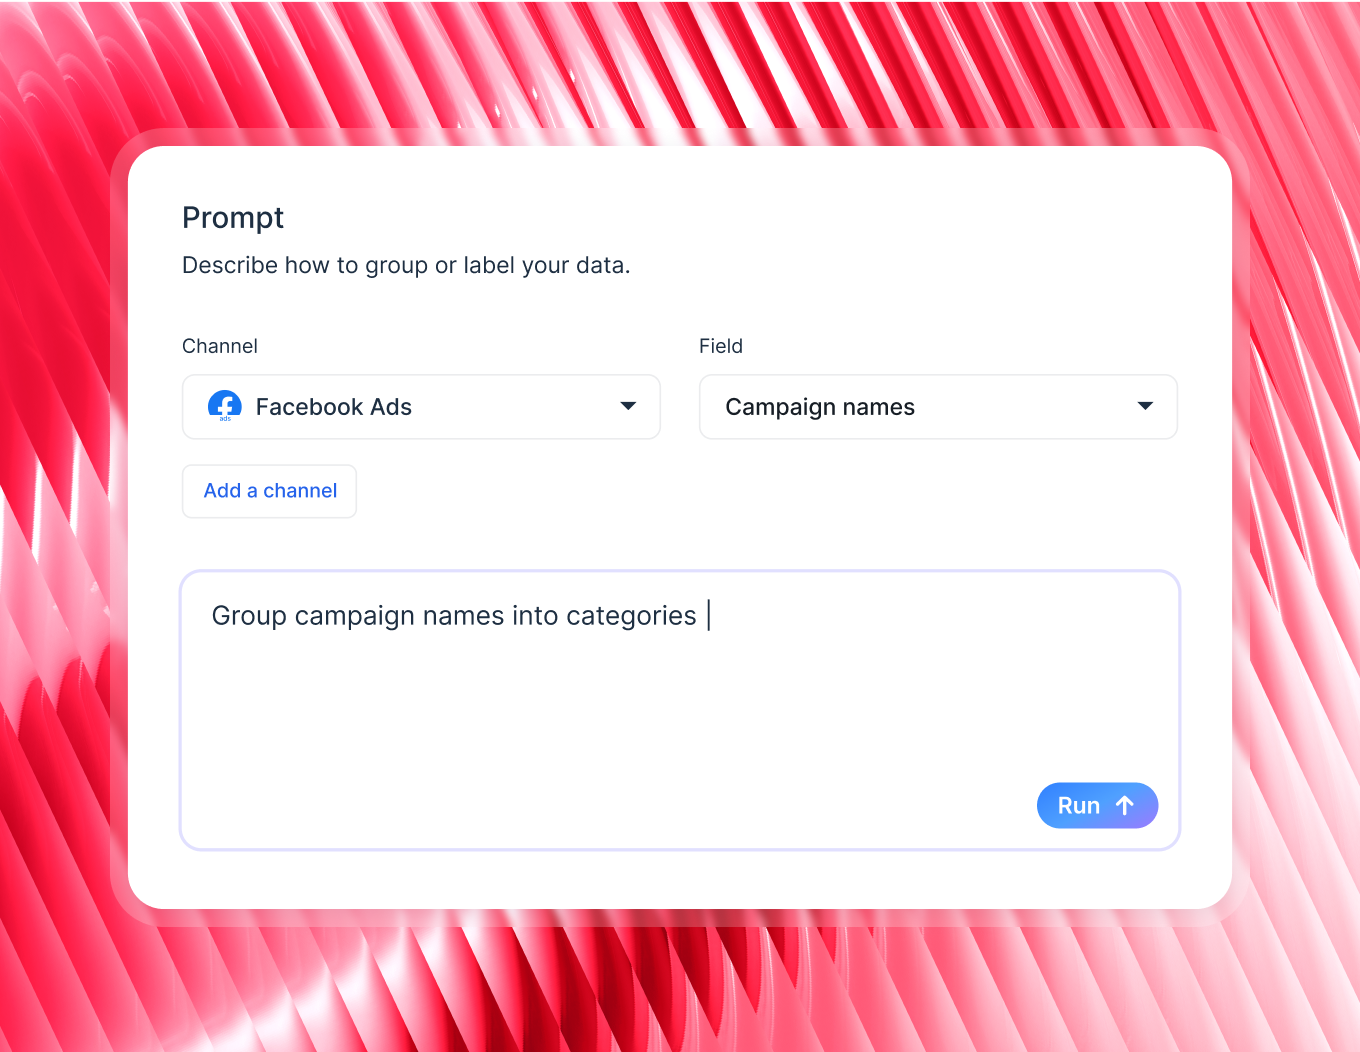
You can also get Whatagraph IQ to generate a custom dimension for you based on a text prompt. Once defined, the same definitions flow into every report, dashboard, and AI answer, so ROAS means the same thing everywhere.
Tanja also told us:
The biggest reason we chose Whatagraph was because of that holistic approach. We wanted to blend more sources together to see in one overview what's the performance and what we should change or adapt.
3. Query your data from Claude or ChatGPT. Whatagraph MCP connects your AI assistant to that governed data layer, not raw channel APIs. Ask "what's blended ROAS across all clients this month?" and the number matches the one in your client report. Setup takes five steps, no coding required.
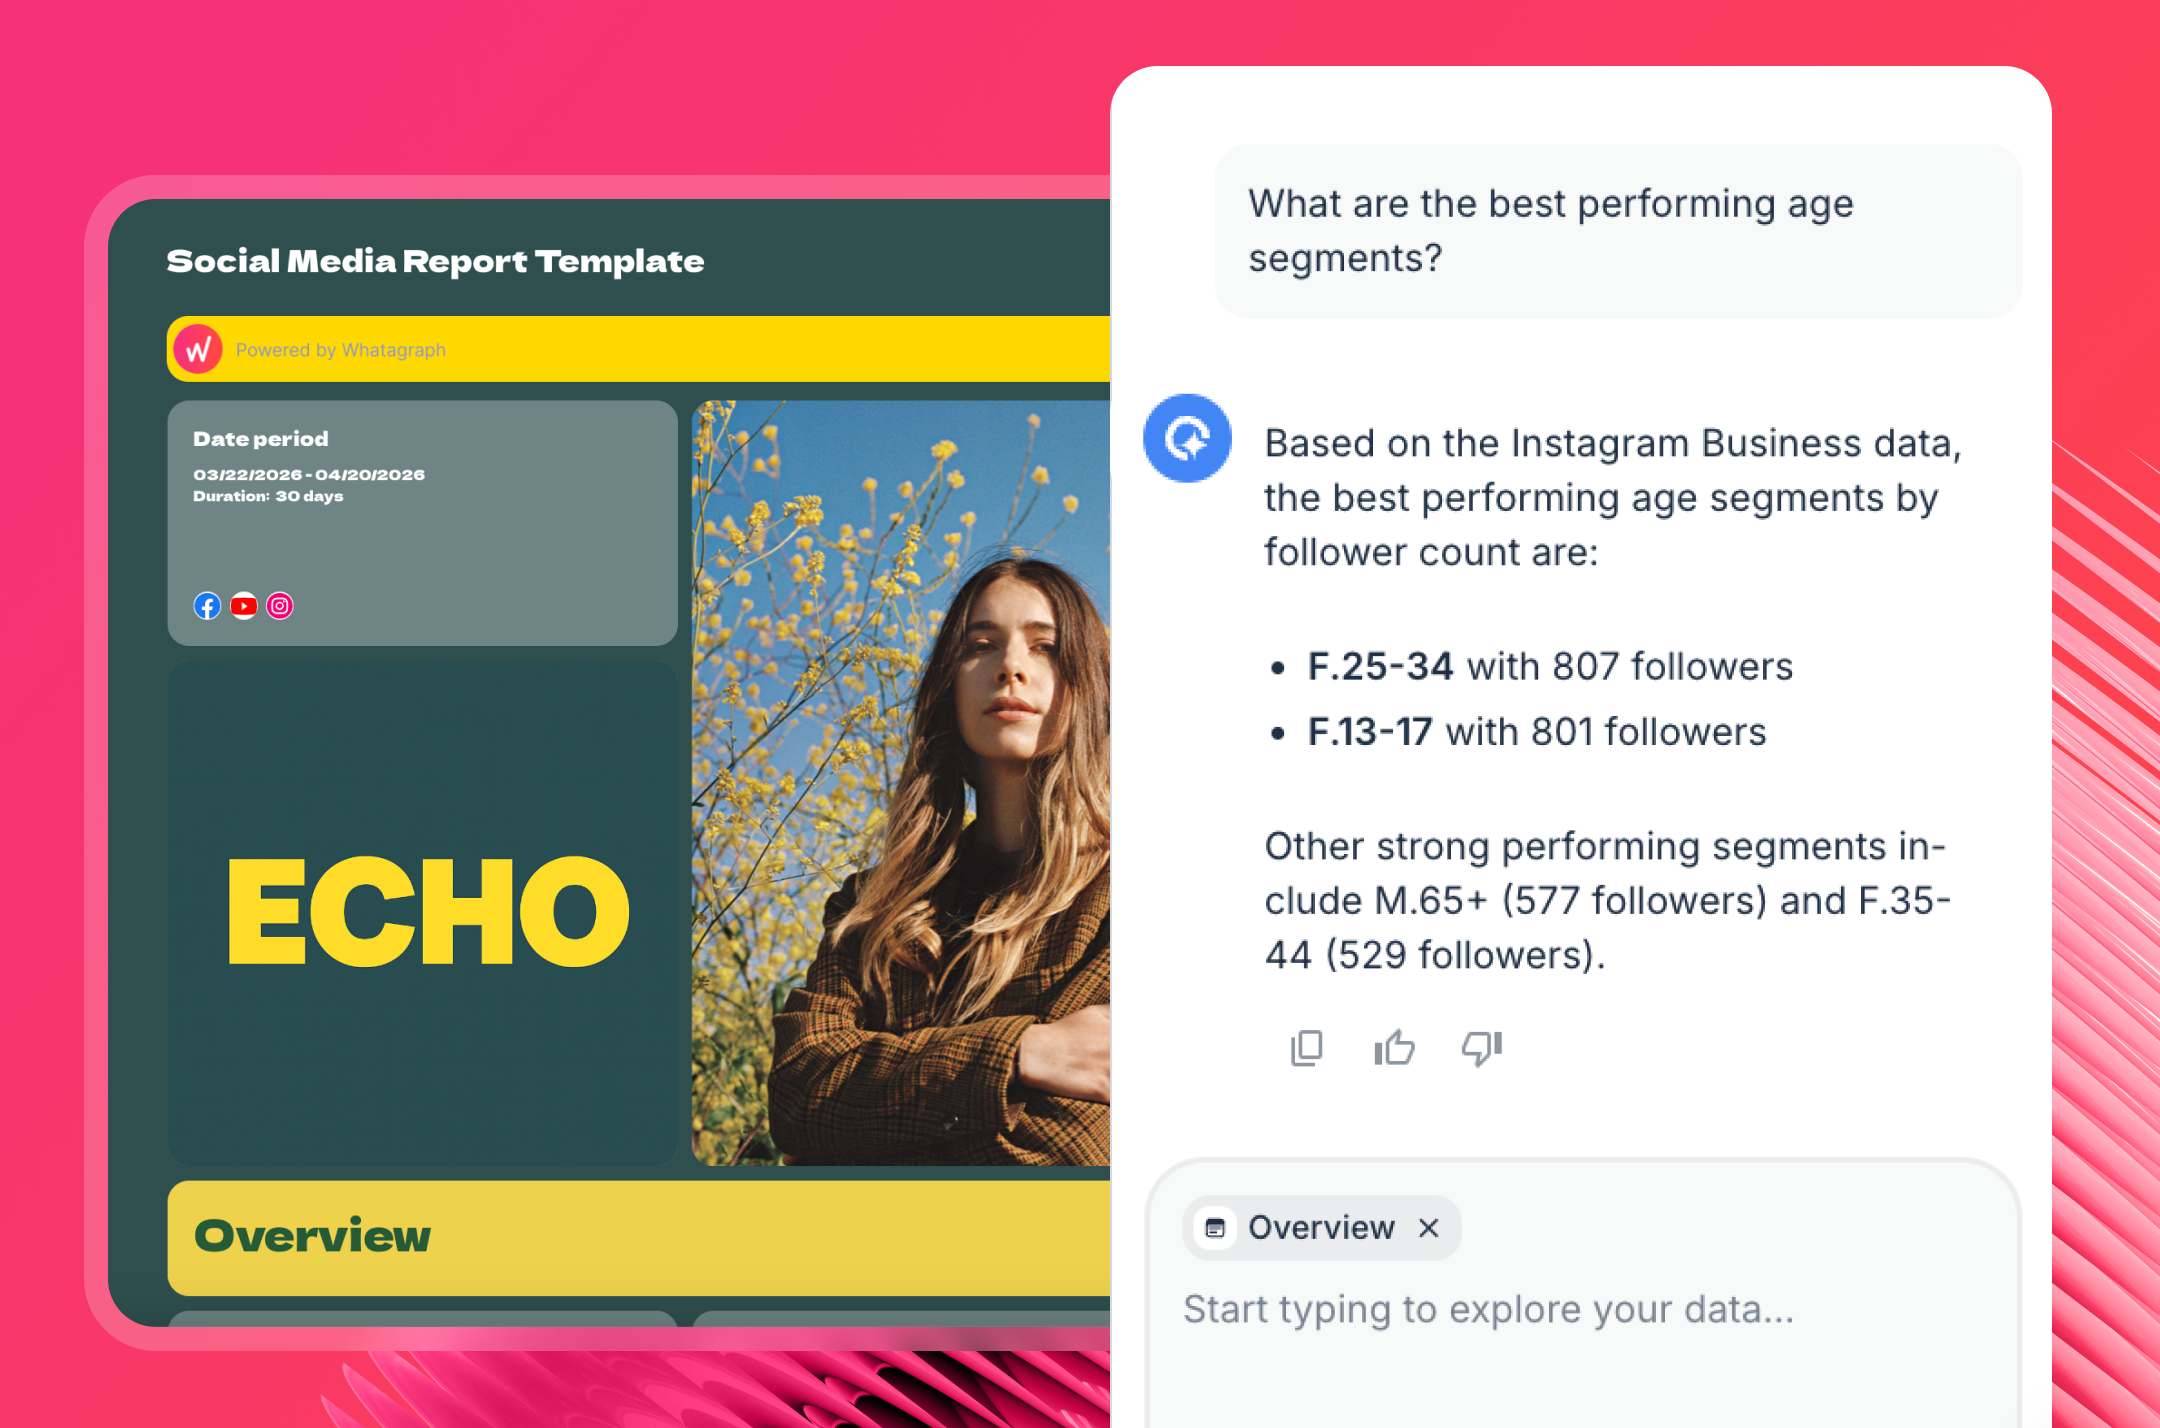
4. Generate branded reports in seconds. Describe the report you need and Whatagraph IQ builds it, applying client branding automatically from a logo or a screenshot of their website.
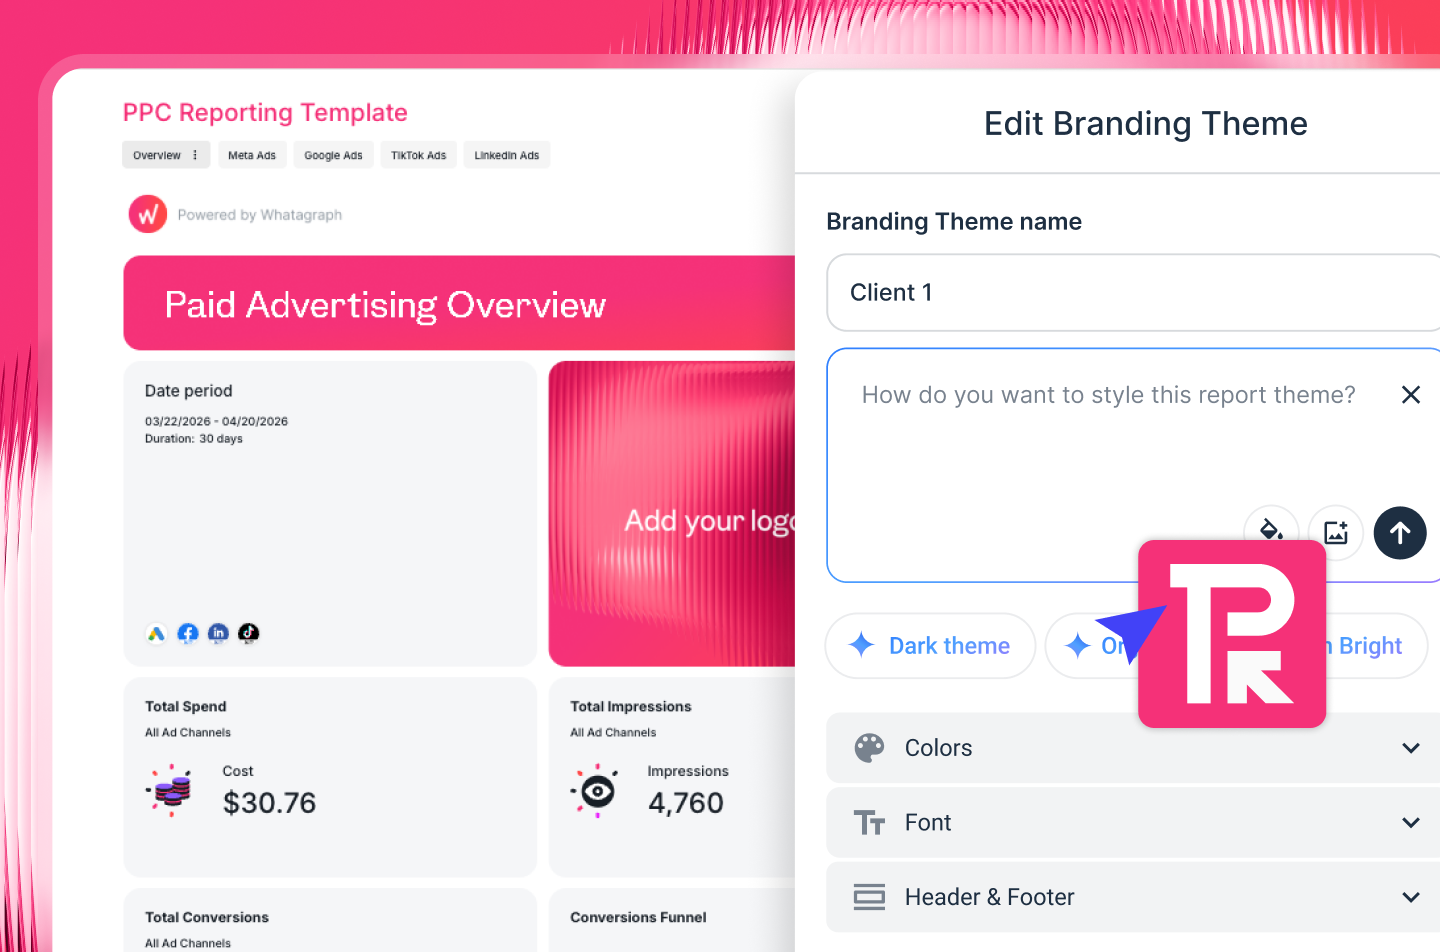
Branded, neat, clean, reports make it easier for clients to read and understand results. They see the professionalism behind your agency, making them want to stay longer.
In fact, Dtch. Digitals reduced client churn by 50% after switching from Looker Studio to Whatagraph because of this exact reason. Stef Oosterik, Quality Manager at Dtch. Digitals says:
The look and feel of the reports is way more professional compared to before. Clients are more satisfied with the reports and they tell us this is the way forward for us."
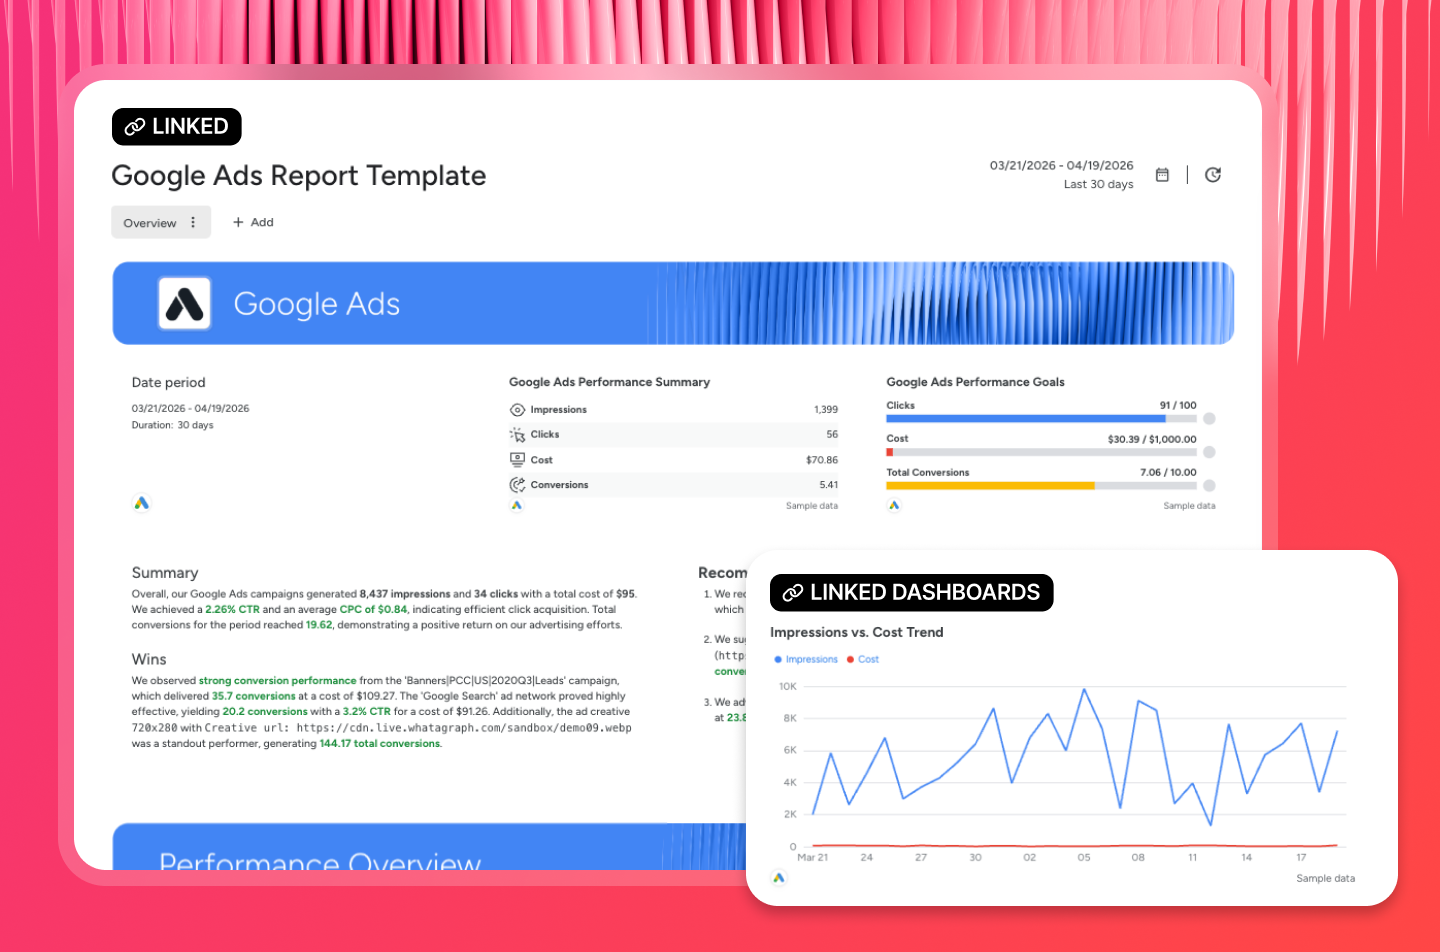
Linked templates keep everything consistent from there: edit the master template once, and the change cascades to every client report.
This is massive for agencies with hundreds of reports because this means you don't need to manually edit them one by one at all. Less tedious, and more time for other things that matter, like scaling your agency and building relationships with clients.
And templates go beyond reports. You can save data blends, custom formulas, and Source Groups as templates too, so the next client's entire reporting setup is a copy, not a rebuild.
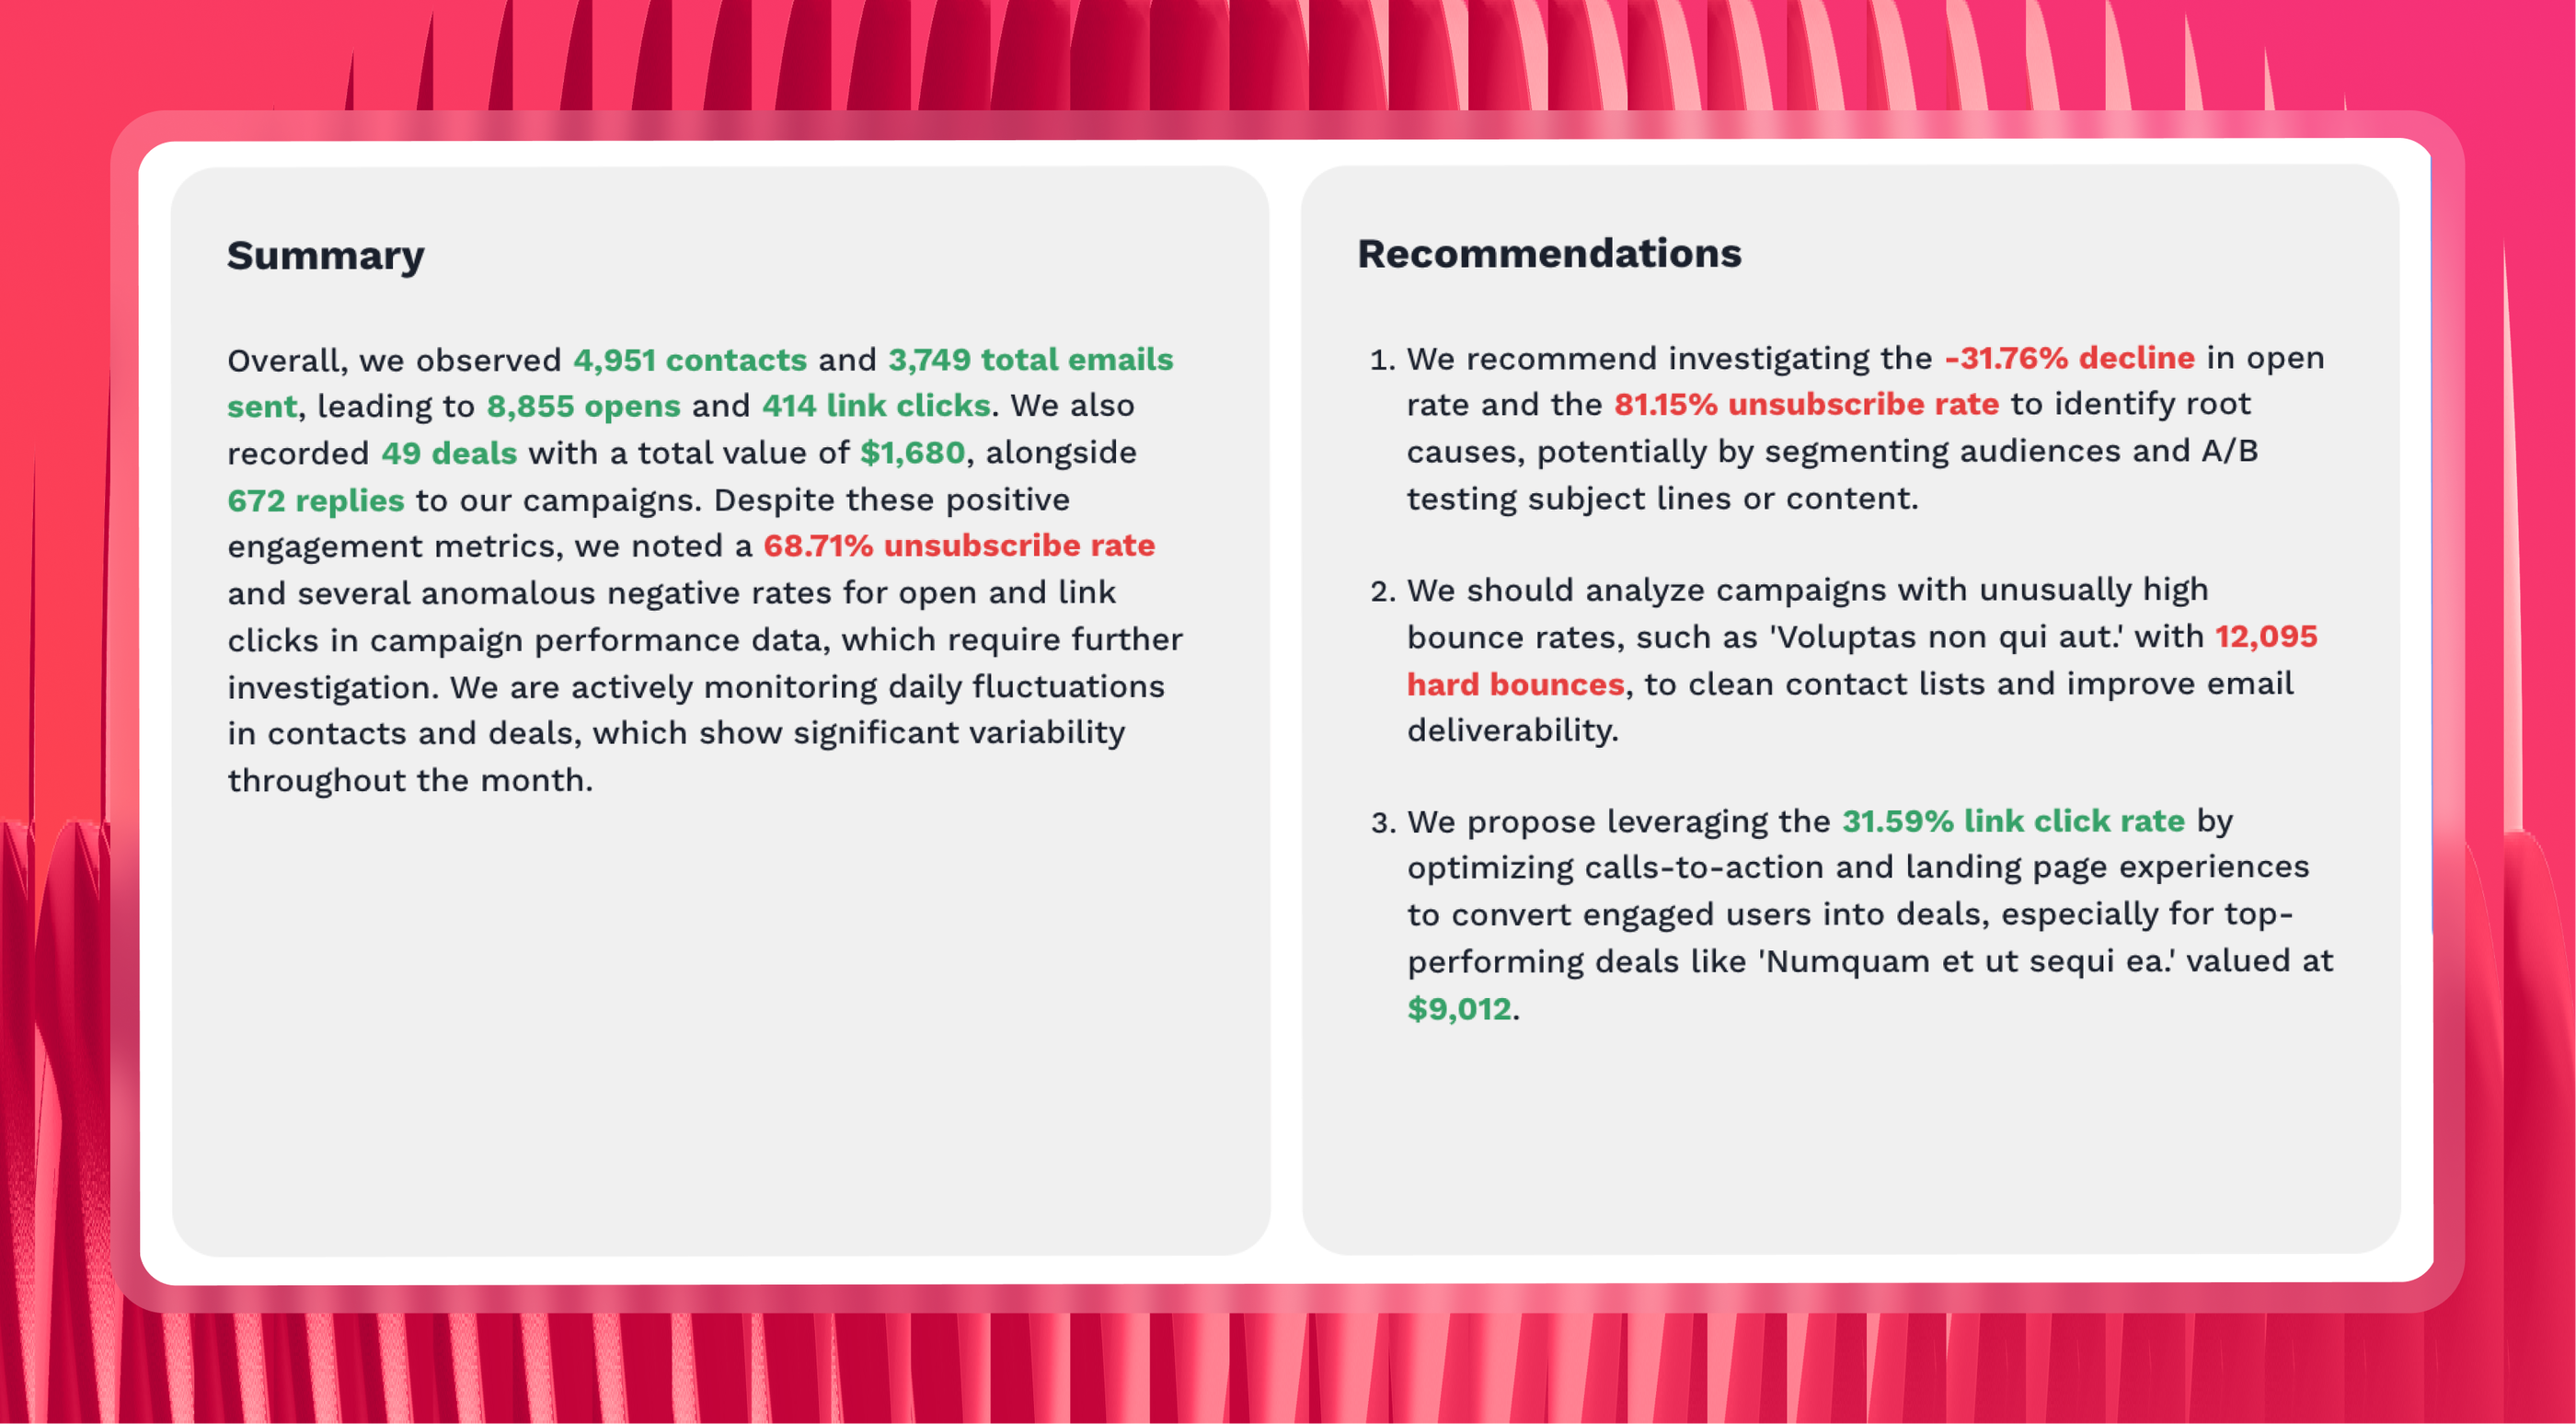
5. Add AI commentary with IQ summaries. IQ writes the performance summary directly inside the report: summary, wins, issues, recommendations, or your own custom prompt. Every client gets context with their numbers, and you can edit the text for a human touch. Clients love this kind of transparency
6. Answer ad-hoc questions with IQ chat. Your team can ask anything about performance inside of a report ("how much did we spend on Google Ads last month?") and get an answer in seconds, without opening a single ad platform.
You can also turn on this function for clients so they can ask questions and get back quick answers without having to wait for someone. Faster analysis means faster decisions and better client satisfaction.
When it's time to deliver, share reports as live links, scheduled white-label emails, PDFs, or push the data to BigQuery and Data Studio.
Key features:
- 60+ fully managed native connectors, 99.95% average uptime
- Custom blends, metrics, and dimensions - define once, apply everywhere
- Linked templates - one edit updates all client reports instantly
- Whatagraph IQ - builds complete branded reports from a text prompt, writes performance summaries (Summary, Wins, Recommendations, Issues) from live data
- White-label with custom domain
- Export to BigQuery, Looker Studio, PDFs, live links, scheduled emails, Excel, CSV
- Whatagraph MCP for Claude and ChatGPT on governed data layer
- Unlimited users on all paid plans
What users say
“Amazing reporting tool to showcase channel performance and to create blended performance reports for yourself or for clients.” (Source)
“We used to have to make our reports by either screenshotting lots of different platforms (which looked awful), or by manually taking all the data and then inputting it into our own reports. This was very time consuming and subject to human error.
Whatagraph has removed that problem and by automating our reporting, has saved our team a lot of time. Also their customer support is excellent.” (Source)
Pros:
- Governed data layer - one definition across reports, AI, and exports
- Linked templates scale across any number of clients
- Unlimited users on all paid plans
- Dedicated Customer Success Manager on Max plan
Cons:
- No freemium plan
- Smaller connector library than enterprise ETL tools
Pricing:
Whatagraph's pricing scales with your needs. Check out the pricing page for the updated information.
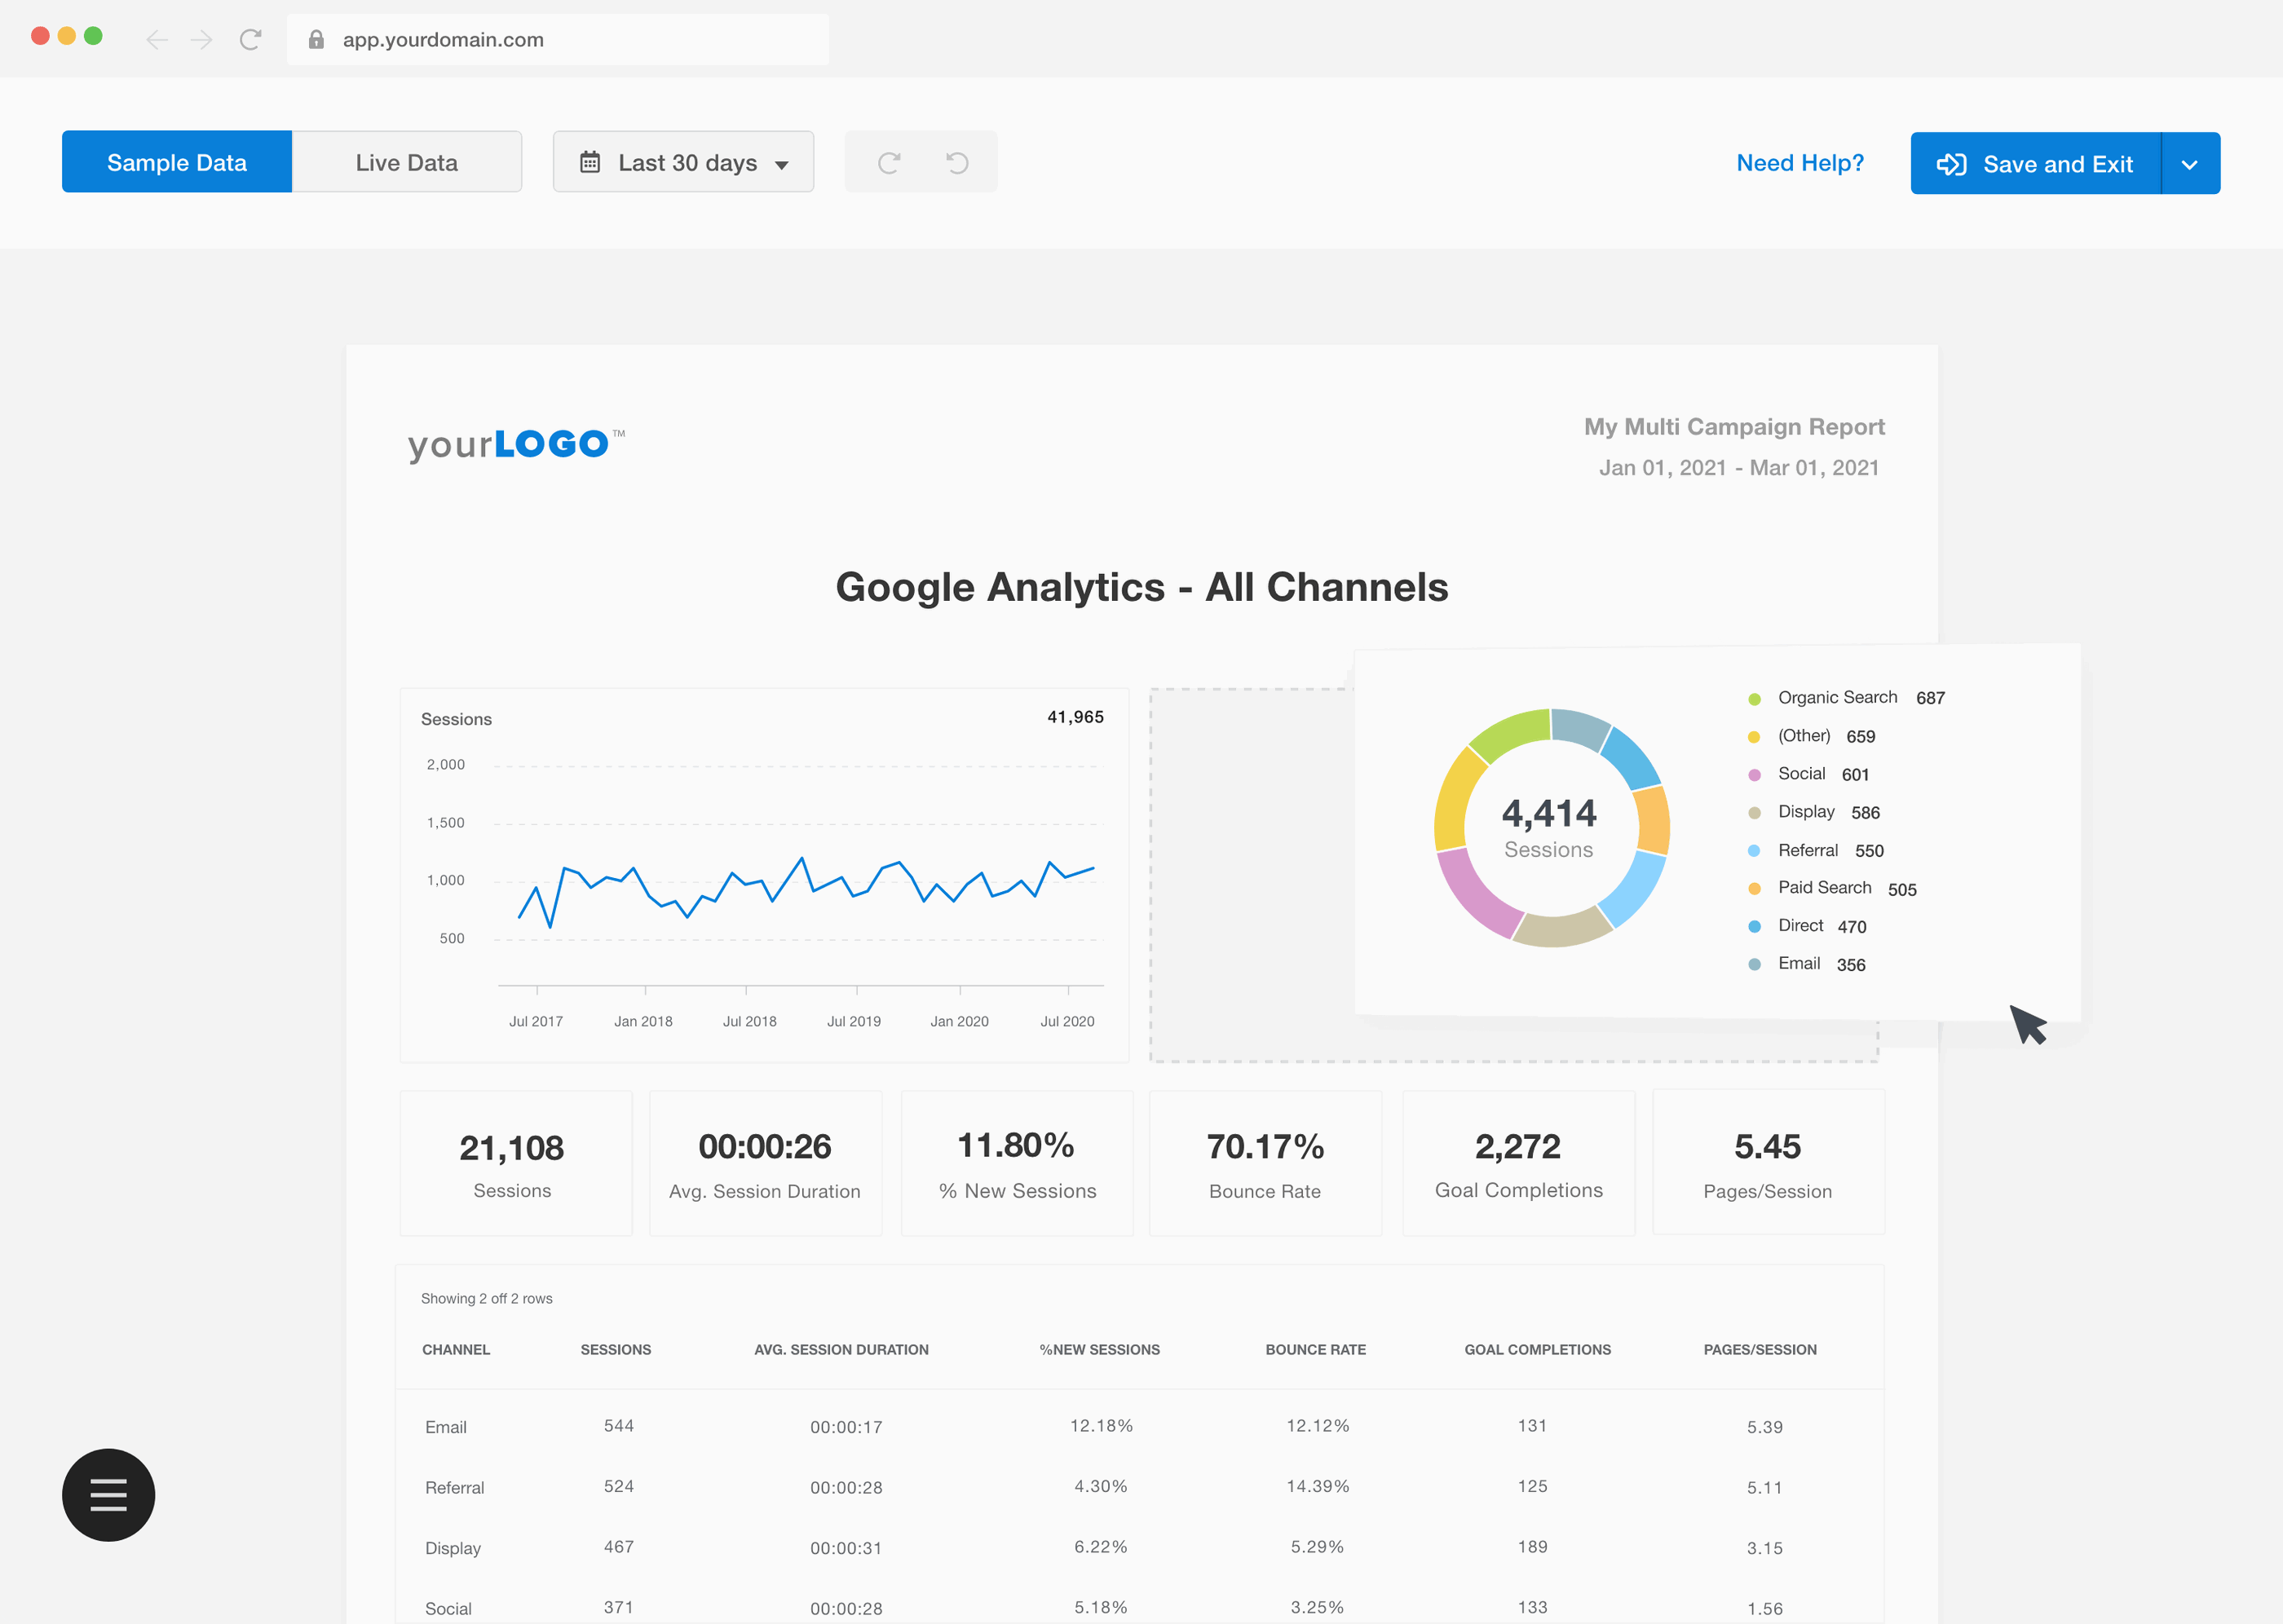
2. Looker Studio
Best for: boutique agencies that only needs connections with Google platforms
Looker Studio is Google's free reporting and dashboard builder. If your agency runs primarily on Google Analytics, Google Ads, Search Console, or YouTube, it connects natively, and setup is fast. It's the most common starting point for agencies that are just getting their reporting off spreadsheets.
The ceiling shows up once you scale beyond Google. Connecting Meta, LinkedIn, or HubSpot requires third-party connectors that cost $20-350/mo each and are less stable than native ones - connector breaks and slow load times are the most common complaints in user reviews.
Cross-data source filtering is available on the free tier, meaning one filter can control charts from multiple sources simultaneously.
Key features:
- 21 native Google connectors - GA4, Google Ads, Google Search Console, YouTube, Sheets, and more
- Cross data source filtering
- Large library of pre-built templates
- Embed dashboards on any website
- Gemini conversational analytics, Google Slides export, mobile app
What users say:
"The native integration with Google tools like Sheets, Analytics, Search Console, and BigQuery makes data pulling in pretty seamless." (Source)
"Looker Studio is a useful tool for building shareable, real-time dashboards. It can feel limited when it comes to more advanced data modelling and calculations." (Source)
Pros:
- Free with Google sources
- Fast setup for Google-stack agencies
- Cross data source filtering is now on the free tier
Cons:
- Third-party connectors are unreliable and add cost
- No white-label or custom domain on the free tier
- No linked templates for multi-client management
- Pro billed per project - agencies with many client environments pay per environment
Pricing:
As of June 2026, Looker Studio’s pricing plans are:
- Free: unlimited users, 21 native Google connectors, core reporting builder
- Third-party connectors: $20-350/mo each
- Pro: $9/user/project/mo (billed annually) - Gemini AI, scheduled PDFs, Google Slides export, mobile app
3. AgencyAnalytics
Best for: SEO and content marketing agencies
AgencyAnalytics is a client reporting tool designed specifically for marketing agencies looking to automate their reporting process. It connects to 85+ platforms and lets you create custom, white-labeled reports for each client - with AI insights, goals, alerts, and MCP access.
It's a particularly strong fit for SEO-focused agencies, thanks to built-in SEO reporting and auditing tools that scan client sites automatically and flag issues.
Where it falls short is data organization. Blending data across sources or standardizing metric names across channels isn't natively supported. The AI Views feature builds cross-channel tables per report, but it's a per-report build - not a platform-wide definition that carries through everywhere.
Key features:
- 85+ integrations, including Google Ads, Meta, LinkedIn, StackAdapt, and SEO platforms (e.g., Ahrefs and Semrush)
- White-label reporting with a custom domain and a custom email
- AI insights and natural language data queries
- MCP access for Claude and ChatGPT
- Goals, alerts, and anomaly detection
- Benchmarks and forecasting
- Roll-up reporting across clients
- Dynamic variables in reports and emails
What users say:
“We use this to manage a lot of clients with multiple marketing services, such as SEO, PPC, and social media reporting.” (Source)
“It feels a bit behind on AI updates. They have a lot of the right features, but they don’t connect together in the way I’d want.” (Source)
Pros:
- Predictable per-client pricing with unlimited users
- Full AI and MCP on Core plan - no upsell
- Strong SEO tooling with rank tracker add-on
- Frequent product updates
Cons:
- Data blending is per-report, not platform-wide
- Reports older than 60 days are deleted
- BigQuery and database connectors require an add-on or Enterprise
Pricing (verified May 2026):
AgencyAnalytics offers two main plans and optional add-ons:
- Core: $20/client/mo (billed annually) - unlimited data sources, reports, dashboards, staff, client users
- Enterprise: Custom, starts at 25 clients
- Rank Tracker add-on: $50/mo per 500 keywords
- Database connectors (MySQL, BigQuery, Redshift): custom pricing
4. DashThis
Best for: Small agencies and freelancers, quick setup
DashThis is a straightforward reporting tool built for agencies that want to get reports set up and sent quickly.
It comes with a drag-and-drop editor, preset templates, and AI-powered Insights included on all plans. It’s most recent connectors include Reddit Ads and Pinterest Ads.
The main thing to watch is how costs scale. Plans now cap both the number of dashboards and data sources, and each connected account counts as one source. An agency with 10 clients across Google Ads, Meta, and GA4 is already at 30 sources - worth checking against your plan before signing up.
Key features:
- Drag-and-drop editor with preset templates
- Unlimited users and integrations on all plans
- AI Insights included on all plans
- AI Insights Pro add-on - Chat Mode and Dashboard Context ($15/mo annually)
- White-labeled dashboards, custom domain, custom email
- Automated email delivery, link sharing, and PDF export
- Reddit Ads and Pinterest Ads connectors
What users say:
“DashThis saves us a significant amount of time by bringing key marketing metrics together in one place. The automation feature is also great.” (Source)
“Unfortunately a subscription became a little pricey for me; I found I wasn't using the tool enough to warrant the cost.” (Source)
Pros:
- Lowest entry price on this list
- Fast setup with no technical knowledge required
- AI Insights included at base plan level
- Unlimited users on all plans
Cons:
- Plans cap both dashboards and data sources - costs scale quickly with more clients
- No linked templates for multi-client management
- No MCP support
- White-labeling is only available from the Professional plan
Pricing:
As of June 2026, this is DashThis’ pricing:
- Individual: $44/mo - 3 dashboards, 15 sources, unlimited users
- Professional: $139/mo - 10 dashboards, 40 sources, white-label, custom domain
- Business: $279/mo - 25 dashboards, 100 sources, customer success specialist
- Standard: $429/mo - 50 dashboards, 200 sources
- AI Insights Pro add-on: $15/mo annually
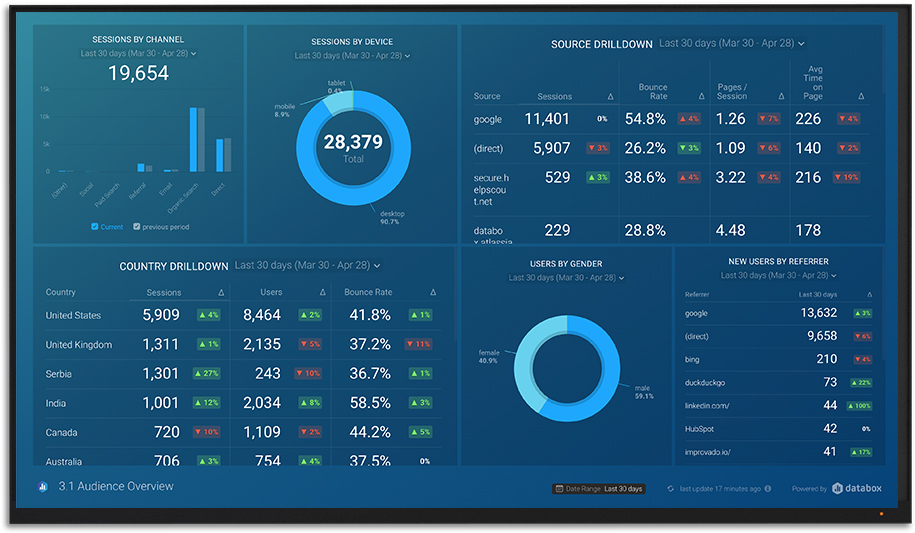
5. Databox
Best for: Agencies wanting goal tracking, forecasting, and anomaly detection
Databox is a dashboard and reporting platform with a strong focus on performance monitoring. It has a dedicated agency pricing track that includes client account management and bulk operations from the entry level, and MCP access is available on all plans, including the free tier.
The trade-off is that the more advanced AI features - performance summaries, forecast modeling, and anomaly detection - are only available from the Growth plan upward. White-labeling is also a separate add-on on lower plans rather than included by default.
Key features:
- 100+ integrations
- Goal tracking, alerts, and anomaly detection
- AI Analyst for natural language data queries
- AI performance summaries and forecast modeling
- MCP access
- Bulk operations across client accounts
- Client performance overview dashboard
- Benchmarks against industry peers
What users say:
“Databox helps with sending automatic reports to clients, which means I don't have to manually send them.” (Source)
“Sometimes the dashboards won't refresh at a fast pace. Also, the annual subscription cost is considerable for a small business” (Source)
Pros:
- MCP is included on all plans, including free
- Strong goal tracking and anomaly detection
- Bulk operations save time across large client rosters
- Free plan available
Cons:
- White-labeling is a $200/mo add-on on lower plans
- AI performance summaries are only available from Growth plan
- Per-source pricing scales unpredictably with more clients
- 3 data sources included - additional sources cost extra on all plans
Pricing:
Databox offers four different pricing plans:
- Agency Starter: $79/mo - 3 sources, 10 dashboards, 5 client accounts, unlimited users
- Agency Pro: $159/mo - unlimited dashboards and client accounts, AI Analyst, remove branding
- Agency Growth: $399/mo - AI performance summaries, anomaly detection, forecast modeling
- Agency Premium: $799/mo - 50 sources included, all add-ons bundled
6. Klipfolio
Best for: Technically oriented analysts at agencies
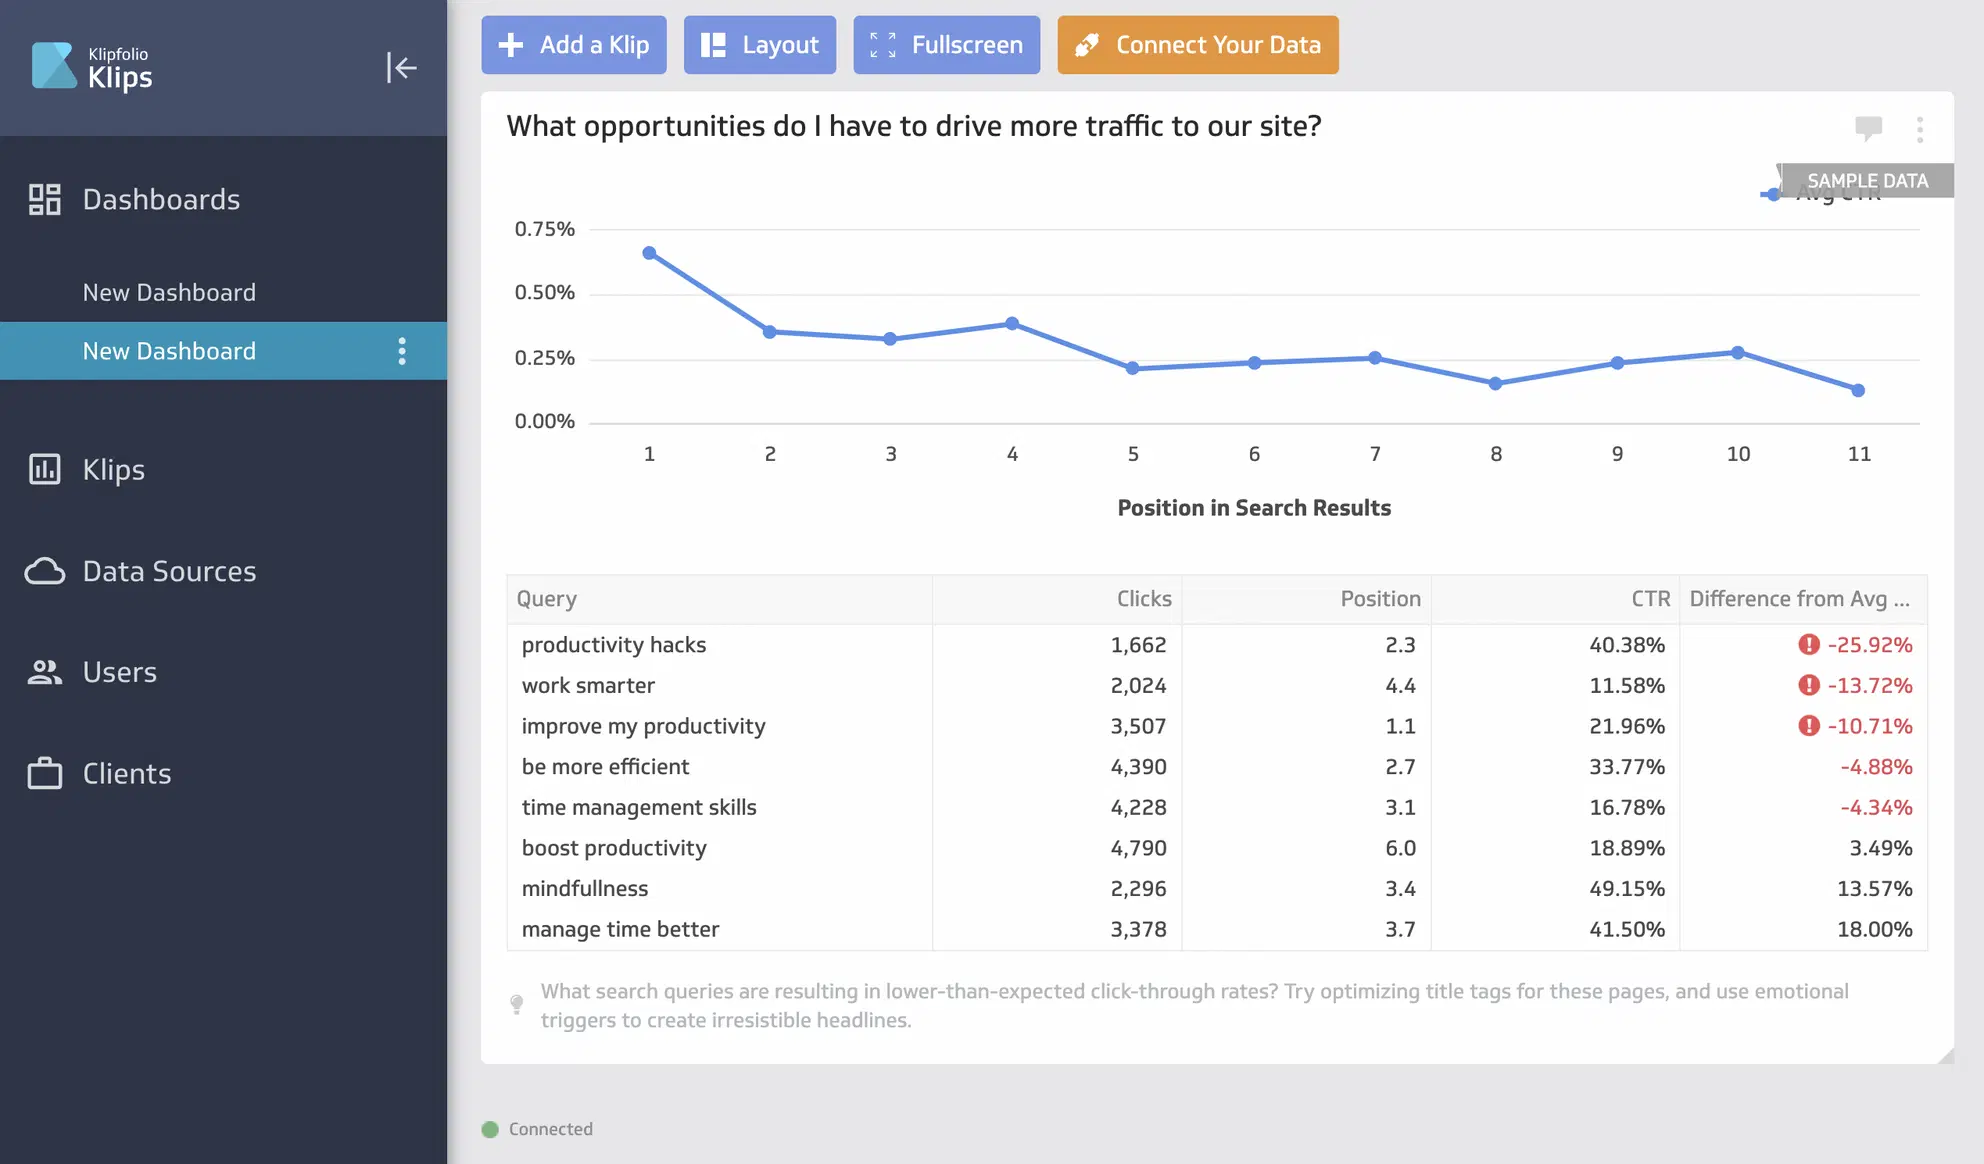
Klipfolio is a dashboard builder built around formula-driven control. Technically capable users can build complex dashboards with live data connections, custom formulas, and granular refresh rates. Unlimited users are included on all plans.
Note that Klipfolio operates two separate products: Klips (the dashboard builder covered here) and PowerMetrics (a separate marketing analytics platform).
The main trade-off is scalability across clients. Every Klip is configured in its own separate environment, which makes replicating dashboards across many clients more manual than template-driven tools.
Key features:
- 130+ integrations with live data connection
- Unlimited users on all plans
- Complex formula support and custom metric building
- Configurable data refresh rates by plan
- MySQL server connection
- AI goal tracking, forecasting, anomaly detection (PowerMetrics only - separate product)
What users say:
“It's very intuitive, and the UI is clean. The integration capabilities are nice.” (Source)
“Seeing all of the pertinent data at a glance is really helpful. Sometimes it takes a little while to load the information I need.” (Source)
Pros:
- Deep formula-based customization
- Unlimited users on all plans
- Actively maintained connectors
- Competitive pricing at the entry level
Cons:
- AI features are PowerMetrics only - not available in Klips
- Every Klip is configured separately - harder to scale across clients
- Custom domain and custom theme are not included in the lower plans
- PowerMetrics MCP is still in Beta
Pricing (verified March 2026, billed annually):
- Base: $120/mo - 3 dashboards, 130+ integrations, 4-hour refresh, unlimited users
- Grow: $190/mo - 10 dashboards, 1-hour refresh
- Team: $310/mo - 20 dashboards, 15-min refresh, SSO
- Team+: $600/mo - 40 dashboards, up-to-the-minute refresh, priority support, custom onboarding
7. NinjaCat
Best for: Large enterprise agencies
NinjaCat positions itself as an enterprise data and AI agents platform. The platform now includes 100+ pre-built marketing agents that execute workflows rather than just surface insights.
For example, an anomaly detection AI agent can trigger a Slack alert, diagnose the root cause, and generate recommended actions automatically.
NinjaCat is built for large enterprise agencies and priced accordingly. If you're a smaller agency, the complexity and cost won't be the right fit.
Key features:
- 150+ native connectors with fully managed Data Cloud
- 100+ pre-built AI marketing agents
- Chained autonomous agents - anomaly detection through to recommended actions
- White-label reporting with custom branding
- SEO tools - rank tracking and backlink monitoring
- Export to BigQuery, Snowflake, Amazon S3
- New Report Studio UI with Sankey chart type
- MCP server support for Claude, ChatGPT, and other AI assistants
What users say:
“NinjaCat has a lot of connectors that are able to bring in data from countless platforms.” (Source)
The technology is sophisticated and can do a lot. Because of that, things can break down from time to time. (Source)
Pros:
- Most advanced AI agent library for marketing on this list
- MCP designed for agentic execution, not just querying
- Strong enterprise agency credentials
- Snowflake and BigQuery export included
Cons:
- No public pricing - requires a demo
- Enterprise-only - not suited for smaller agencies
- Complex to implement without a dedicated data team
- Some UX complaints around report builder performance
Pricing (verified May 2026):
- No public pricing. Contact sales.
- Estimated $1,500+/mo based on market data
8. TapClicks
Best for: agencies that mostly with eCommerce and franchise clients
Best for: Large ecommerce and franchise agencies
TapClicks is a marketing operations platform covering data integration, dashboards, and automated client deliverables. The standout feature is SmartReports - automatically generated branded PowerPoint decks and email summaries on a schedule, which removes a significant amount of manual work.
TapClicks’ AI expansion also added two features: Widget creation from natural language prompts and an AI Insights Agent that turns metric widgets into instant recommendations.
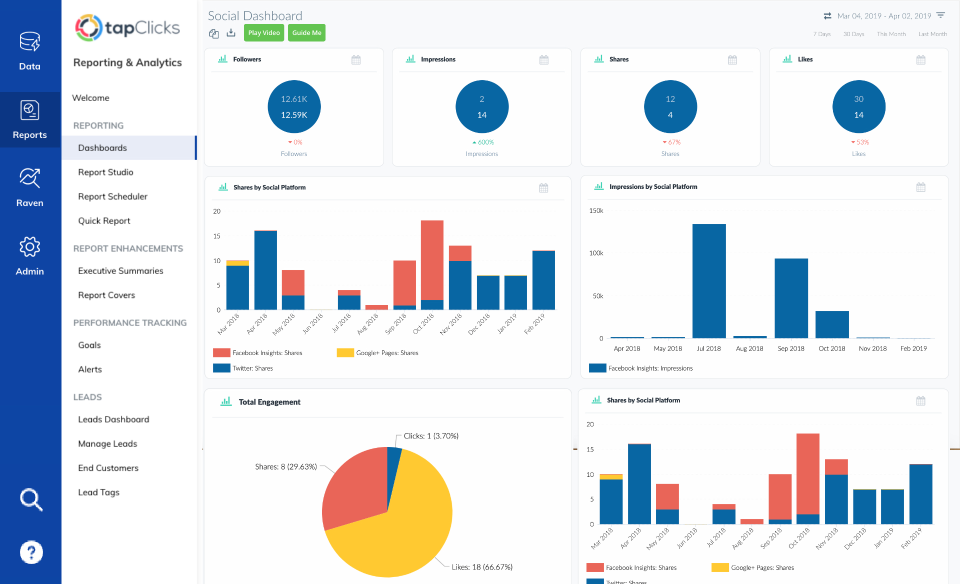
Like NinjaCat, pricing is quote-based, and the platform is geared toward larger agencies with ecommerce and franchise clients.
Key features:
- 250+ connectors, including CTV and retail media
- SmartSlides - AI-generated branded PowerPoint decks on schedule
- SmartEmail - AI-authored email summaries on schedule
- AI widget creation from natural language prompts
- AI Insights Agent - turns metric widgets into insights
- Build-Your-Own Agent for custom workflows
- White-label reporting with custom branding
- Real-time client reporting dashboards
What users say:
“For the most part, it has integrations with 90% of the tools we use.” (Source)
“You are able to connect a lot of platforms to the app. (Google Ads, Facebook Ads, LinkedIn Ads, etc). As for a small company, the price can rise very fast.” (Source)
Pros:
- Strongest automated deck and email generation on this list
- Broad connector library, including CTV and retail media
- AI agent building for custom workflows
- Covers the full marketing operations stack
Cons:
- No public pricing - requires a demo
- Complex initial setup
- No bulk report editing
- Classic UI being deprecated - migration required
Pricing (verified May 2026 - estimated, no public pricing):
- Basic: ~$599/mo
- Pro: ~$999/mo
- Enterprise: $1,500+/mo
- All tiers require a demo call to confirm pricing
On a separate note, if your current client reporting solution has multiple time-saving features, you won’t be thrilled to hear that TapClicks doesn't allow you to edit multiple reports at once.
Published on Aug 14 2024
WRITTEN BY
YamonYamon is a Senior Content Marketing Manager at Whatagraph. With an eye for detail and a knack for always considering context, audience, and business goals to guide the narrative, she's on a mission to create genuinely helpful content for marketers. When she’s not working, she’s hiking, meditating, or practicing yoga.