

What is a Meta Ads report template?
A Meta Ads report template is a ready-made report that connects your Facebook and Instagram Ads data and organizes it into a clear, visual format.
Right now, most agencies are still doing this the hard way:
1. Exporting CSVs from Meta Ads Manager
2. Dropping them into spreadsheets or Looker Studio
3. Formatting everything by hand
4. Writing up a summary manually before every client call
This process works - but it doesn't scale, and it eats hours that should be going into optimization.
Facebook and Instagram remain the dominant paid social media channels: a 2025 Statista report found that 83% of marketers worldwide use Facebook for marketing purposes, with Instagram right behind at 78% usage. But that pipeline is getting more expensive to justify. Triple Whale's 2026 Facebook Ads Benchmark Report showed Facebook Ads CPMs climbed over 20% in 2025.
When clients are paying more to reach the same audience, an accurate report is no longer optional - it's how you prove the spend is working.
A solid Facebook Ads report template gives your team a repeatable way to:
- Monitor key metrics like ROAS, CTR, CPC, CPM, and conversion rate across every Facebook Ads campaign
- Break down performance by ad set, ad creative, and ad placement to pinpoint what's driving results
- Show audience demographics - age, gender, location, device - to confirm campaigns are reaching the right people
- Add context and recommendations alongside the data so clients understand what the numbers actually mean
- Deliver reports through live links, scheduled emails, or branded PDFs without rebuilding anything each time
Whatagraph IQ takes this even further.
Once your Facebook Ads report template is live, it writes performance summaries automatically from your actual data and brand reports to match each client.
Clients can even ask questions about their own report and get instant plain-language answers, no analyst required.
Plus, with Whatagraph's Facebook Ads MCP, you can connect your Meta Ads and other marketing data to Claude and analyze it in plain language and get back answers you trust.
For agencies running multiple accounts, the time savings are significant. After switching to Whatagraph, Peak Seven cut reporting time from 4 hours per report to 1.5 hours - saving 63 hours every month across their 25 clients.
I immediately knew Whatagraph was going to save us a lot of time, and that we were going to have accurate reporting. It took us to the next level with our clients and within our team. - Kim Strickland, Digital Marketing Specialist at Peak Seven
What Should Be Included in a Facebook Ads Report Template?
If you’re running ads for clients or managing in-house campaigns, your Facebook reporting template should do more than dump metrics. It should tell a clear performance story, fast.
Here’s what a complete Facebook Ads dashboard template (like the one built in Whatagraph) includes.
1. Performance Summary
 Start your monthly report with a clear snapshot of your Facebook Ads performance over a specific time frame, for example, last month.
Drag-and-drop a goal widget to visualize key performance indicators like spend, reach, clicks, and conversions. Add a performance summary list that shows how each metric — such as CTR (Click-Through Rate), CPC (Cost per Click), CPM, and ROAS (Return on Ad Spend) — has changed compared to the previous period.
Then, include text widgets for your summary and recommendations. With Whatagraph IQ Summary, you don’t have to write these manually. Simply ask Whatagraph to write them for you in 18 different languages using your own Facebook Ads data.
For example:
“Write a short performance summary highlighting top-performing ad creatives and optimization opportunities for e-commerce campaigns.”
You can fully edit the text afterward to match your tone.
Since Whatagraph’s AI analyzes the actual data sources in your report, there are no hallucinations. Plus, you never risk data breaches because everything stays inside Whatagraph, not external tools like ChatGPT.
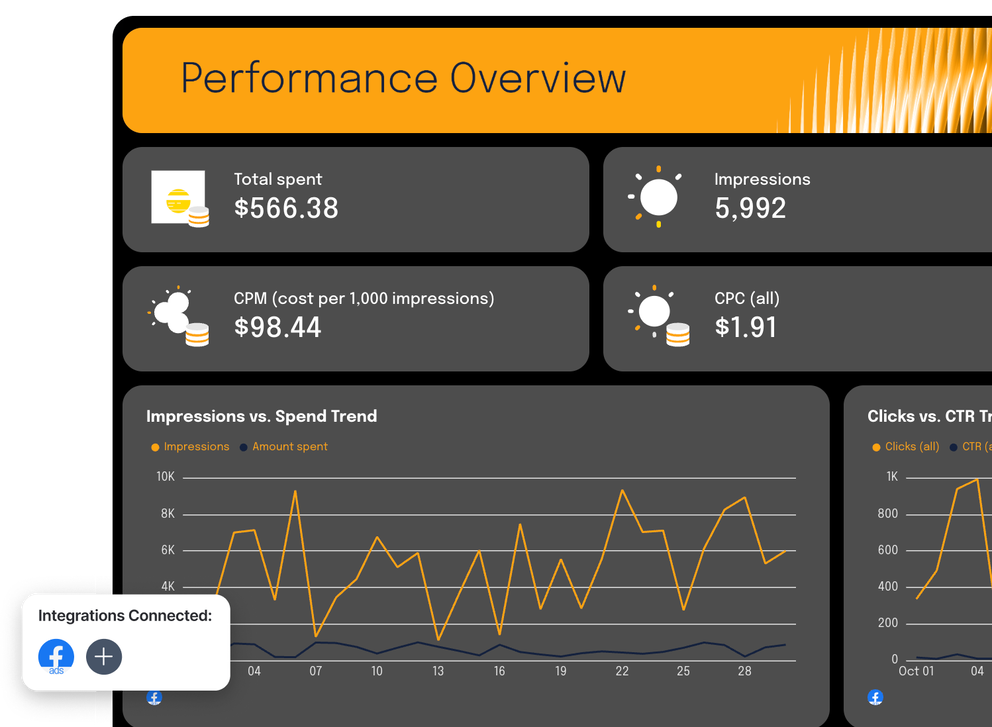
2. Performance Overview
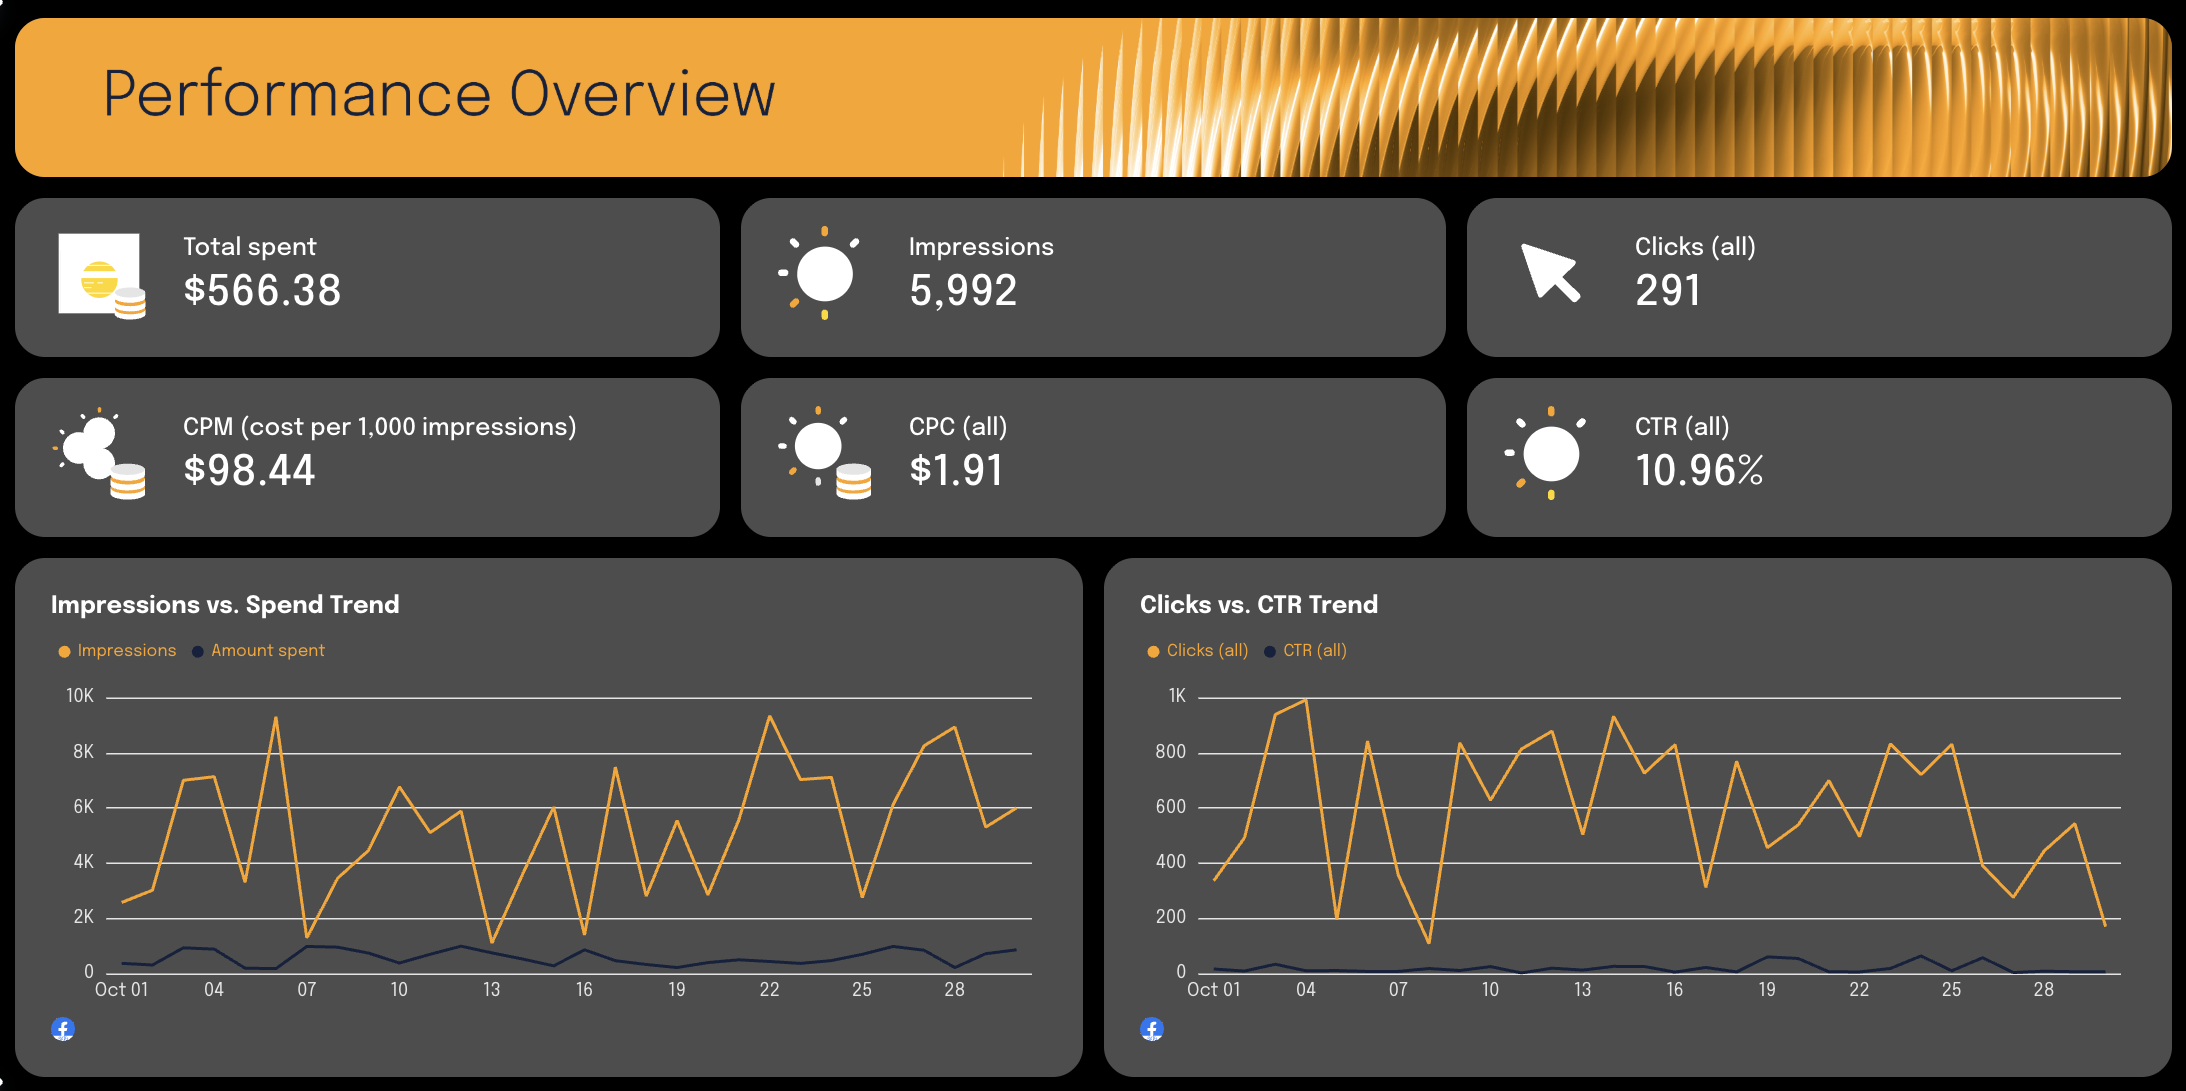
Use this section to visualize your most important key metrics in single-value widgets.
Show Facebook Ads performance trends across important PPC metrics like CTR, CPC, CPM, conversion rate, and ROAS, and compare them to the previous reporting period.
Use a variation of graphs to make your performance report easier to interpret for both clients and internal stakeholders.
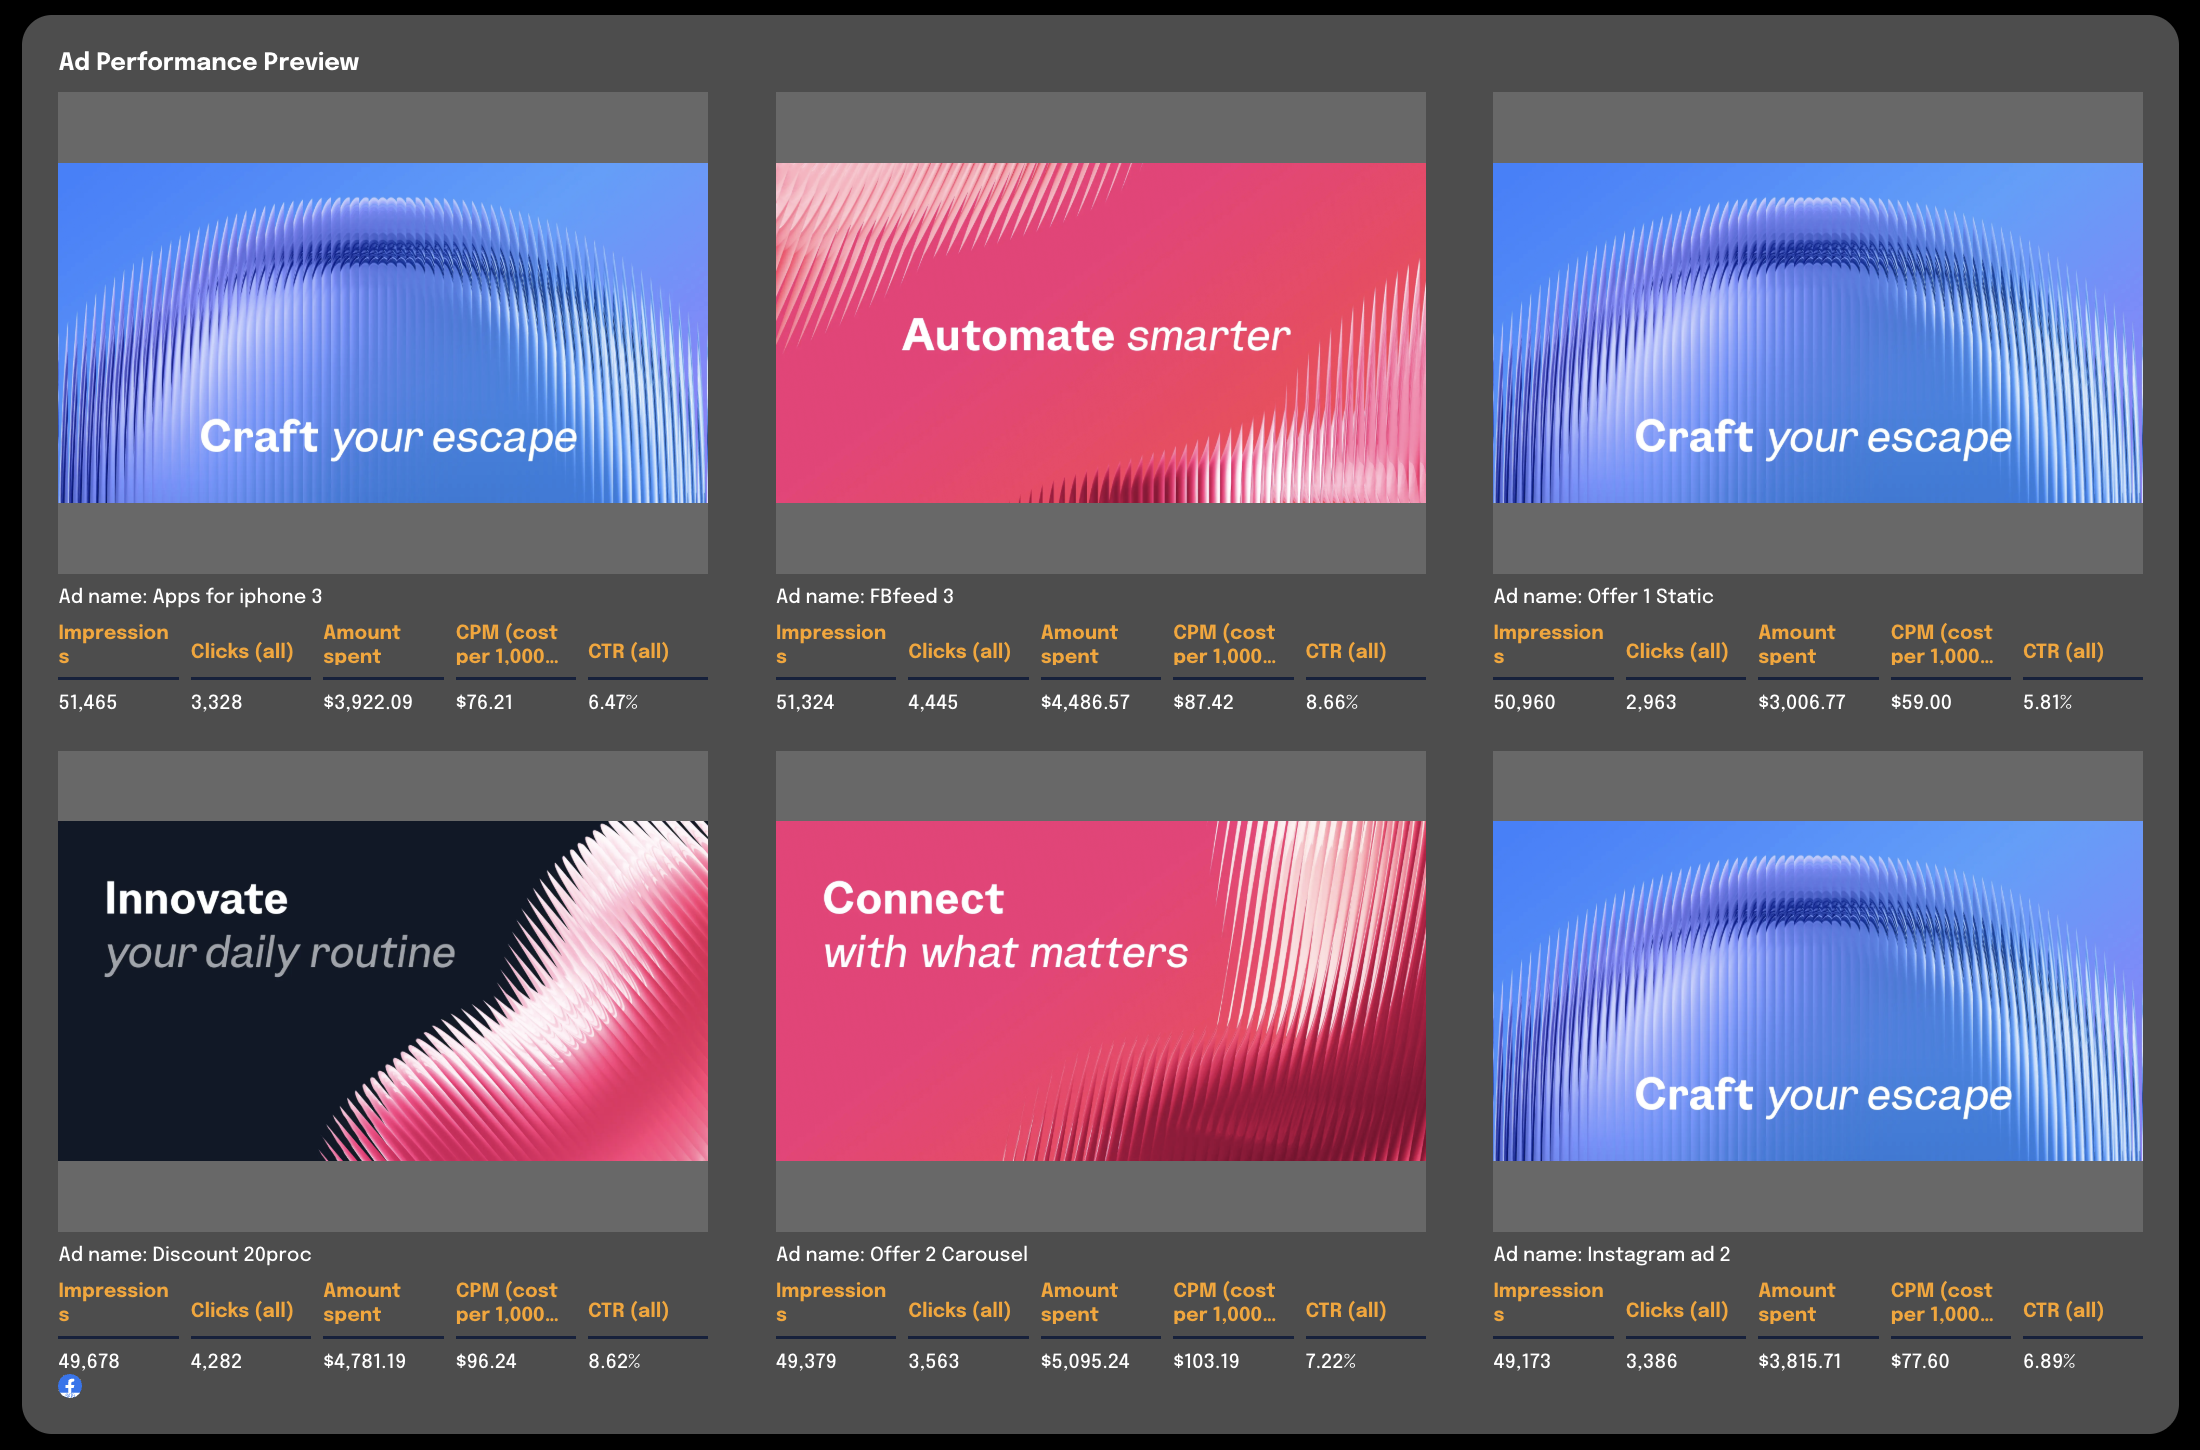
3. Campaign and Ad Performance Breakdown

Dive deeper into your campaign performance in this section of your Facebook ad campaign report template.
Create a table that breaks down each Facebook Ads campaign with marketing data like total spend, impressions, CPM, clicks, CPC, CTR, and engagement. This helps you instantly identify which campaigns perform best and where adjustments are needed to optimize performance.
Next, use a carousel to display your top-performing Facebook Ads — complete with visuals, audience reach, and conversion data. This gives stakeholders a quick look at what creative is driving results across Meta Ads and Instagram Ads.
4. Audience Insights (Demographics)
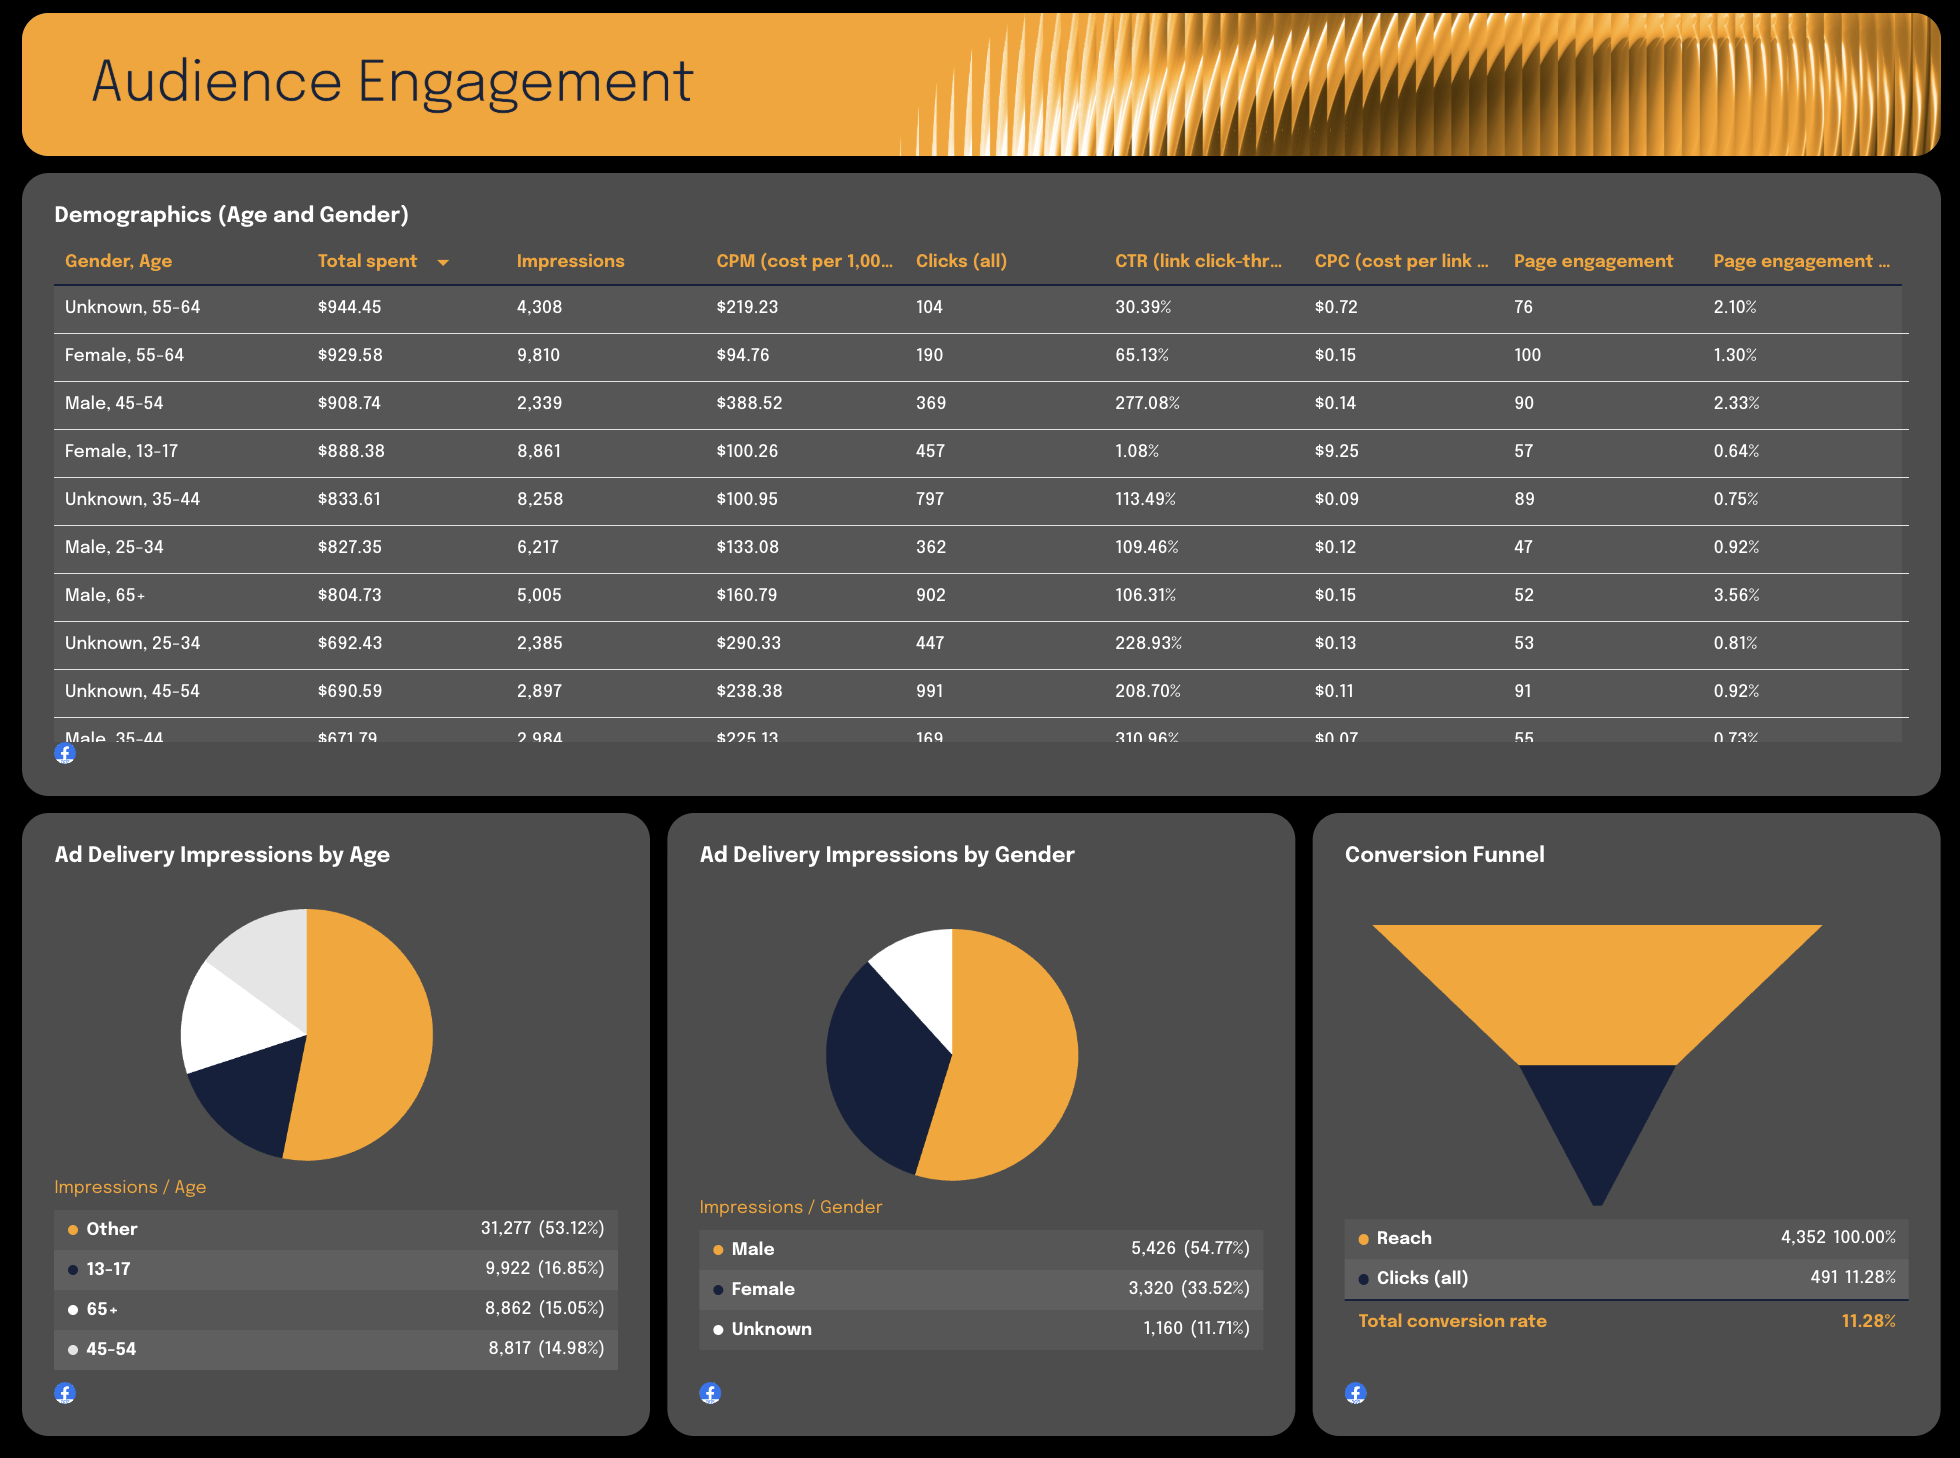
Next, show how your audience interacts with your ads in your Facebook Ads Insights report template.
Add a table breaking down demographics such as age, gender, and country, along with metrics like impressions, conversions, and engagement. Then use pie charts or visualization widgets to compare performance by audience segment — for example, impressions by gender or conversions by age group.
This section helps you uncover trends that can improve targeting and refine your marketing reporting for future campaigns.
5. Conversion Funnel Visualization
Wrap up your Facebook Ad reporting template should show the journey from reach to conversion using a funnel chart. It tracks how users move from reach to conversion, giving both clients and marketing teams a clear sense of their marketing efforts.
Explore more Facebook Ads report templates
Below are three more Facebook Ads report templates co-created with experienced paid media specialists.
Each is built for a specific use case: lead generation, eCommerce, and creative performance.
1. Meta Ads report template for lead generation
The Meta Ads report template for lead generation, co-created with Lars Maat, the co-founder of Maatwerk Online, is built for agencies running Meta Ads campaigns with the goal of generating leads.
It goes beyond surface-level lead counts and tracks what actually matters: how many of those leads turn into paying clients.
Structure
The report opens up with the top-line KPIs and insights, and recommendations section - so stakeholders get a quick overview of what's working before digging into details.
From there, it moves into secondary KPIs, a campaign breakdown table, and a funnel view showing how users move from impression to click to lead.
Metrics to visualize
Primary KPIs:
- Website leads - the core conversion goal for lead gen campaigns
- Amount spent - tracks budget consumption against results
- ROAS - shows whether ad spend is generating measurable return
- Cost per lead - reveals the efficiency of each campaign in acquiring leads
Secondary KPIs:
- Impressions - measures overall campaign reach
- Clicks - shows how many users engaged enough to visit the landing page
- CTR - indicates whether ad creative and targeting are aligned
- CPC - tracks cost efficiency at the click level
- CPA - measures total cost to acquire a conversion, not just a lead
Lars Maat's approach to lead gen reporting challenges one of the most common mistakes agencies make - reporting on lead volume without looking at lead quality.
In Meta Ads, we don't focus on the number of leads. Instead, we look at how many new clients actually come from those leads. You might have one campaign with 100 leads at €10 CPL and another with 10 leads at €80 CPL - on paper, you'd kill the second one. But what if that second campaign brings in 9 clients, while the first only brings in one? That's why offline conversion tracking in Meta Lead Gen campaigns is so important. - Lars Maat, Co-Founder, Maatwerk Online
2. Meta Ads report template for eCommerce
Also co-created with Lars Maat, the Meta Ads report template for eCommerce is built for brands running Meta Ads with purchase and revenue targets.
It tracks performance from ad spend through to purchases, with a focus on profitability and goal pacing.
Structure
The report starts with a goal pacing widget - showing clients how close they are to hitting their targets and how much of the budget has been used.
A short insights and recommendations section follows, then top-line KPI widgets, campaign-level tables, and spend trend charts.
Metrics to visualize
Primary KPIs:
- Purchases - the main conversion event for eCommerce campaigns
- Revenue - ties ad performance directly to business outcomes
- ROAS - the key profitability indicator for eCommerce reporting
- Cost - tracks total ad spend against revenue generated
- Cost per purchase - shows how efficiently the budget is converting to sales
Secondary KPIs:
- Impressions, clicks, CPC, CTR - channel health indicators
- Conversion rate - reveals how well landing pages and ad creative work together
- CPA - tracks overall acquisition cost across the funnel
Best practices from Lars Maat:
- Open with a goal pacing widget so clients immediately see progress against targets
- Add a short insight or recommendation at the top before the data
- Use single-value widgets for the most important Meta Ads metrics - keep it scannable
- Include a table showing purchases and ROAS by campaign name for a quick performance read
- Use vertical bar graphs for daily purchase trends and horizontal bar graphs for monthly spend
3. Meta Ads report template with a focus on ad creatives
Co-created with Alexander Mitrofanov, Senior Paid Media Specialist at Tag Worldwide, this Meta Ads report template for ad creatives is for teams that want to go deeper on creative performance.
It helps to track which ads are actually driving engagement across Facebook and Instagram, not just which campaigns are spending the most.
Structure
The report opens with an aggregated values tab covering all active ad channels - Meta Ads, Google Ads, TikTok Ads - giving stakeholders a cross-channel view before drilling into Meta specifically.
On the second tab, it drills into Meta specifically. The tab opens with campaign goals tracked separately for Facebook and Instagram.
From there, it moves into a granular ad-level table and closes with a carousel of top-performing creatives showing CTR, post engagement, post shares, and post saves for each ad.
Metrics to visualize
Primary KPIs:
- Total impressions, Facebook impressions, Instagram impressions - breaks down reach by platform so you can see where your audience is most active
- Total spend - tracks budget against creative performance
- Page engagement - measures how ads are driving broader brand interaction beyond clicks
Secondary KPIs:
- Total clicks - overall engagement signal across all creatives
- Post saves - a strong indicator of content value and future intent
- Post shares - shows organic amplification driven by paid creative
- CPC - tracks cost efficiency at the individual ad level
- CPM - reveals how expensive it is to reach your audience on each platform
Best practices from Alexander Mitrofanov:
- Start with an aggregated values tab so clients see total cross-channel performance before the Meta breakdown
- Add performance summaries, recommendations, and comments throughout - not just at the end
- Use a goal widget at the top, segmented by platform, so Facebook and Instagram performance are always visible separately
- Use pie charts to break down results by gender and publisher platform
- Always include a carousel chart of top-performing Facebook Ads creatives - it's the fastest way to show clients what's working
Creative reporting is still massively underdeveloped. We need to stop focusing only on bidding and audiences. - Alexander Mitrofanov, Senior Paid Media Specialist at Tag Worldwide


