


What Should a Google Analytics Reporting Template Include
Based on Google My Business report templates built by marketers on Whatagraph, an effective template focuses on visibility, engagement, and real customer actions. It avoids raw exports and instead turns Google Business Profile data into a clear local SEO story that scales across clients or locations.
Below is how high-performing teams structure their Google My Business report template, section by section, and what to include in each.
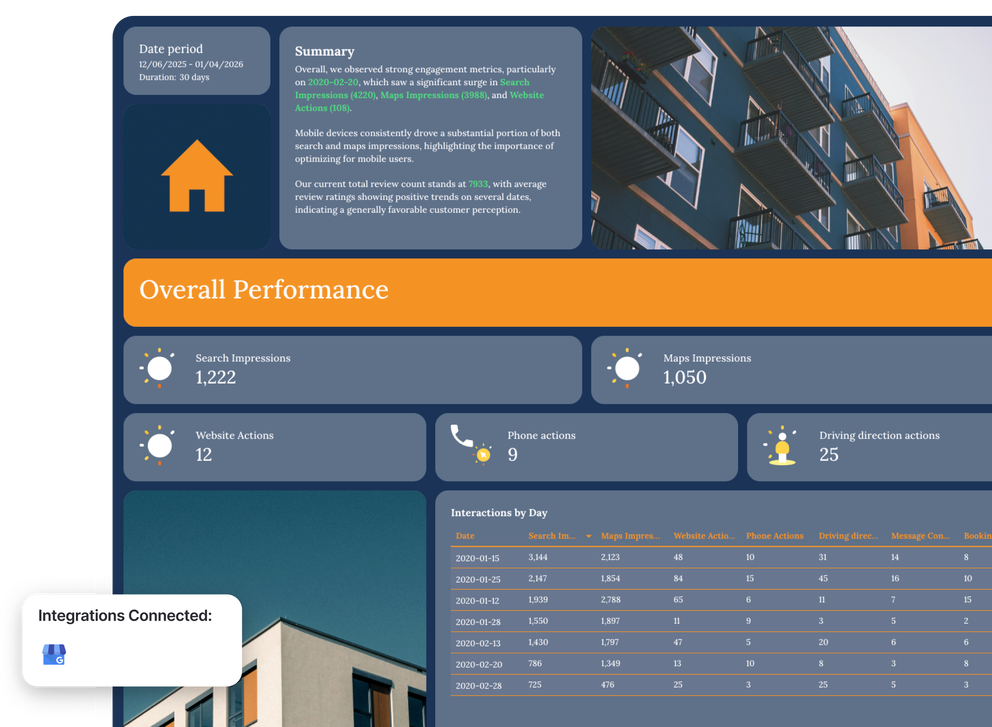
1. Report Context And Executive Summary
Start with context and conclusions, not charts.
What to include
- Time period covered by the report
- Short written summary of profile performance
- Key wins, declines, and notable changes in customer engagement
This summary typically references:
- Search Impressions and Maps Impressions
- Website clicks, calls, and direction requests
- Review count and average rating trends
This section sets the narrative for business owners and stakeholders before they look at detailed metrics.
2. Overall Google Business Profile Performance
This section gives a quick health check of the business listing.
Key metrics to include
- Search Impressions
- Maps Impressions
- Website clicks
- Phone actions tied to the listed phone number
- Driving direction requests
- Current total review count
Recommended visualizations
- KPI tiles or scorecards
These are the core KPIs that show how visible the local business is and how often that visibility turns into customer interactions.
3. Customer Actions And Engagement Over Time
Next, show how people interact with the profile on a daily basis.
What to include
- Website clicks
- Phone calls
- Direction requests
- Messages or bookings, if enabled
Chart types
- Daily tables
- Time-series visualizations
This section helps teams explain customer engagement trends and identify spikes tied to local SEO changes, promotions, or Google Search visibility.
4. Search And Maps Visibility Breakdown
Visibility is the foundation of local search performance, so it deserves its own section.
What to include
- Daily Search Impressions from Google Search
- Daily Maps Impressions from Google Maps
- Top-performing days by impressions
Chart types
- Ranked tables
- Simple trend views
This breakdown helps connect local SEO efforts to actual discovery in search results and maps.
5. Device Performance For Local Search
Device behavior matters for local SEO and conversion intent.
What to include
- Search Impressions by device
- Maps Impressions by device
- Desktop vs mobile comparison
Chart types
- Side-by-side tables
- Comparative visualizations
This section supports decisions around mobile optimization, profile updates, and local landing page improvements.
6. Review And Reputation Performance
Reviews are one of the strongest drivers of trust and local rankings.
Key metrics to include
- Current total review count
- Average rating
- Review volume changes over time
Optional additions:
- Individual review feed
- Rating distribution
Chart types
- KPI tiles
- Tables
- Review lists
This section helps agencies and internal teams connect reputation management to business performance and local SEO outcomes.
7. Interactions By Day Or Location
For deeper analysis or multi-location reporting, include a granular breakdown.
What to include
- Daily performance by metric
- Optional per-location views for franchises
- Ability to compare underperforming vs high-performing locations
Chart types
- Detailed tables
This makes it easier to spot trends, anomalies, and optimization opportunities at scale.
8. Insights And Optimization Recommendations
A strong Google My Business report template does not stop at metrics.
What to include
- Areas to optimize profile performance
- Opportunities to increase website visits or calls
- Review and engagement actions to prioritize
- Notes that tie local SEO activity to business outcomes
This section turns business data into actionable insights and supports confident decision-making.