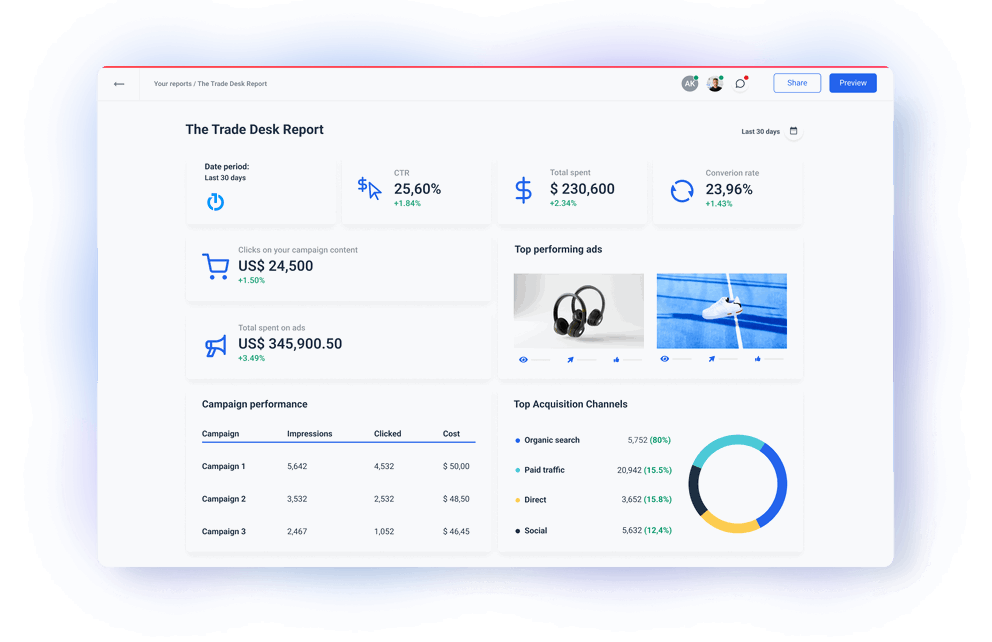
The Trade Desk Integration
Connect The Trade Desk data and use Whatagraph’s advanced visualization to analyze and share the performance of your programmatic advertising campaigns. A fully managed The Trade Desk integration pulls data directly from your The Trade Desk API to help you demonstrate how your agency is turning your clients’ paid advertising budget into conversions across various ad formats, including display, video, audio, and social. Blend The Trade Desk source data with other digital campaign performance metrics to present a holistic image. Share insights from your marketing data automatically as scheduled emails or live links.


The Trade Desk metrics available instantly in Whatagraph
All
The Trade Desk Ad Group Performance
166The Trade Desk Ad Group Recency
166The Trade Desk Browser
166The Trade Desk Data Element
166The Trade Desk Geo
166Search...

Impressions
Clicks
Bids
Player views
Player starts
Player 25% complete
Player 50% complete
Player 75% complete
Player completed views
Player mute
Player unmute
Player pause
Player resume
Player full screen
Player errors
Player skip
Player engaged views
Player rewind
Player expansion
Player collapse
Player close
Player invitation accept
Sampled tracked impressions
Sampled viewed impressions
Total bid amount (USD)
Total bid amount (adv currency)
Total bid amount (partner currency)
TTD cost (USD)
TTD cost (adv currency)
TTD cost (partner currency)
Partner cost (USD)
Partner cost (adv currency)
Partner cost (partner currency)
Advertiser cost (USD)
Advertiser cost (adv currency)
Advertiser cost (partner currency)
Conversion touch 01
Conversion touch 02
Conversion touch 03
Conversion touch 04
Conversion touch 05
Conversion touch 06
Conversion touch 01 revenue
Conversion touch 02 revenue
Conversion touch 03 revenue
Conversion touch 04 revenue
Conversion touch 05 revenue
Click conversion 01
Click conversion 02
Click conversion 03
Click conversion 04
Click conversion 05
Click conversion 06
Click conversion 01 revenue
Click conversion 02 revenue
Click conversion 03 revenue
Click conversion 04 revenue
Click conversion 05 revenue
Click conversion 06 revenue
View through conversion 01
View through conversion 02
View through conversion 03
View through conversion 04
View through conversion 05
View through conversion 06
View through conversion 01 revenue
View through conversion 02 revenue
View through conversion 03 revenue
View through conversion 04 revenue
View through conversion 05 revenue
View through conversion 06 revenue
Conversion touch 07
Conversion touch 08
Conversion touch 09
Conversion touch 10
Conversion touch 11
Conversion touch 12
Conversion touch 13
Conversion touch 14
Conversion touch 15
Conversion touch 16
Conversion touch 17
Conversion touch 18
Conversion touch 19
Conversion touch 20
Conversion touch 21
Conversion touch 22
Conversion touch 23
Conversion touch 24
Conversion touch 25
Click conversion 07
Click conversion 08
Click conversion 09
Click conversion 10
Click conversion 11
Click conversion 12
Click conversion 13
Click conversion 14
Click conversion 15
Click conversion 16
Click conversion 17
Click conversion 18
Click conversion 19
Click conversion 20
Click conversion 21
Click conversion 22
Click conversion 23
Click conversion 24
Click conversion 25
Click conversion 07 revenue
Click conversion 08 revenue
Click conversion 09 revenue
Click conversion 10 revenue
Click conversion 11 revenue
Click conversion 12 revenue
Click conversion 13 revenue
Click conversion 14 revenue
Click conversion 15 revenue
Click conversion 16 revenue
Click conversion 17 revenue
Click conversion 18 revenue
Click conversion 19 revenue
Click conversion 20 revenue
Click conversion 21 revenue
Click conversion 22 revenue
Click conversion 23 revenue
Click conversion 24 revenue
Click conversion 25 revenue
View through conversion 07
View through conversion 08
View through conversion 09
View through conversion 10
View through conversion 11
View through conversion 12
View through conversion 13
View through conversion 14
View through conversion 15
View through conversion 16
View through conversion 17
View through conversion 18
View through conversion 19
View through conversion 20
View through conversion 21
View through conversion 22
View through conversion 23
View through conversion 24
View through conversion 25
View through conversion 07 revenue
View through conversion 08 revenue
View through conversion 09 revenue
View through conversion 10 revenue
View through conversion 11 revenue
View through conversion 12 revenue
View through conversion 13 revenue
View through conversion 14 revenue
View through conversion 15 revenue
View through conversion 16 revenue
View through conversion 17 revenue
View through conversion 18 revenue
View through conversion 19 revenue
View through conversion 20 revenue
View through conversion 21 revenue
View through conversion 22 revenue
View through conversion 23 revenue
View through conversion 24 revenue
View through conversion 25 revenue
Unique IDs
Unique households
Unique persons
Frequency per household
Frequency per person
Frequency per unique ID
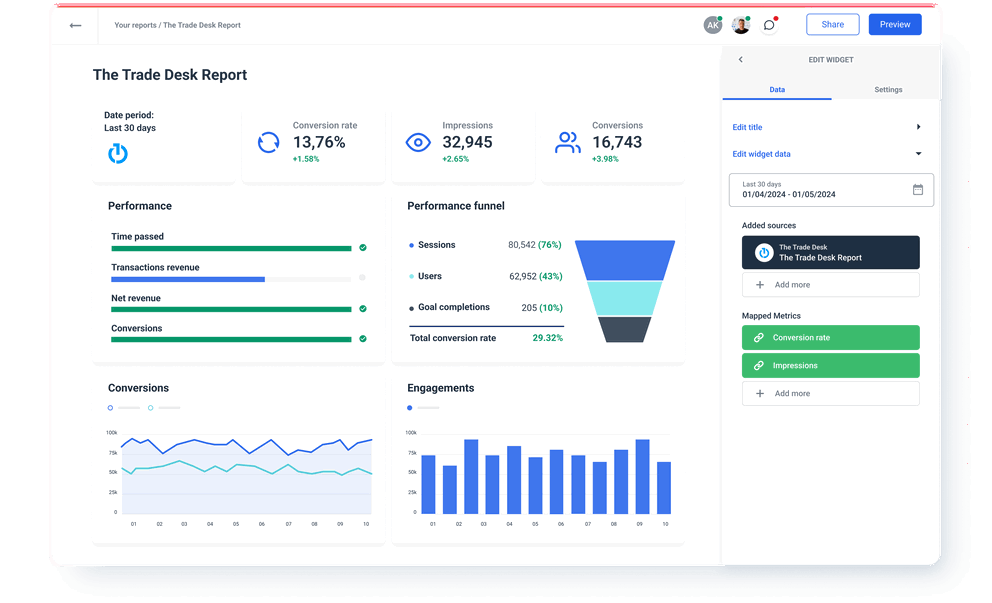
Manage all The Trade Desk data with a direct connector to The Trade Desk API

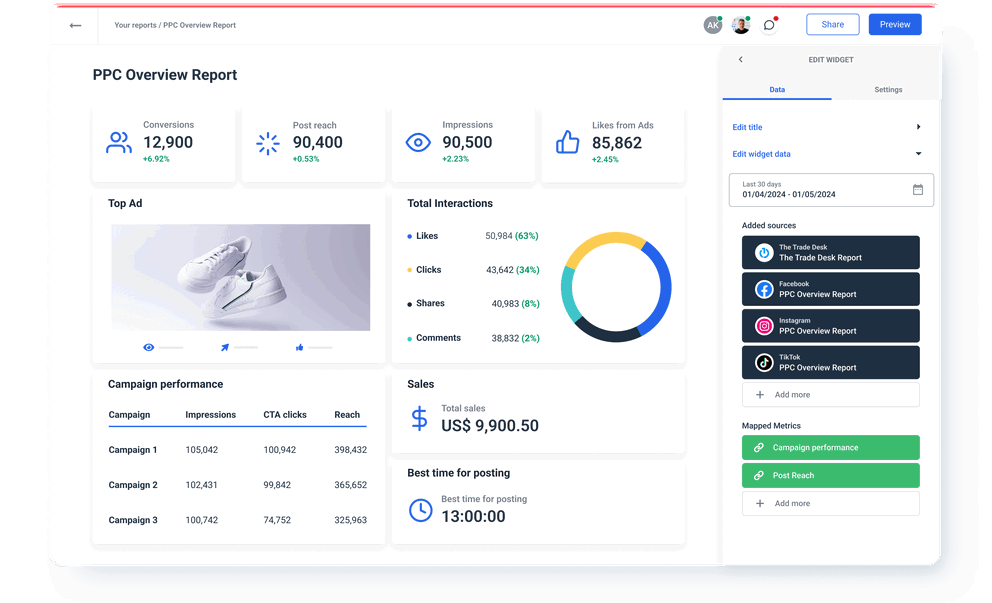
Blend The Trade Desk metrics with actionable insights from other digital marketing platforms
Check out related integrations:


Explore marketing automation and custom report features


Frequently Asked Questions
Do I need a separate report builder to visualize The Trade Desk data?
No, you don’t need any other tool to visualize The Trade Desk data. Whatagraph is an all-in-one marketing data platform to connect, organize, visualize, and share all your data.
This makes Whatagraph a better choice than other data platforms that provide only the connection functionality, so users need to use a separate reporting platform to visualize ad performance data. Having one platform to connect, organize, visualize, and share insights from your marketing data saves time and allows faster decision-making.
What other marketing data sources can I connect alongside The TradeDesk?
Apart from The TradeDesk sources, you can connect other PPC platforms like Simpli.fi, Search Ads 360, and Microsoft Ads, social media like LinkedIn and TikTok, SEO tools like Semrush and Ahrefs, CRMs like Salesforce and HubSpot, e-commerce platforms like Shopify and WooCommerce, Google Analytics 4, and email marketing apps like Mailchimp and Klaviyo.
How to connect The Trade Desk API to Whatagraph?
Whatagraph has a pre-built The Trade Desk connector, so you don’t have to purchase and configure third-party data connectors. Adding a new The Trade Desk source is simple:
1. Go to the Data Sources menu and locate The Trade Desk among the channels.
2. Click +Add new in the Accounts column.
3. Give your The Trade Desk account a name and enter the API key.
4. Click Add account. All done.
You have successfully created a new data integration to your The Trade Desk API, which allows you to use The Trade Desk data in your reports and dashboards.
Connecting The Trade Desk platform API to Whatagraph, you can organize your dynamic ad sets to target relevant audiences and streamline programmatic ad efforts into more personalized experiences. You can visualize data in various widgets and share the insights via automated email lists or live links for near real-time access.
What others think about Whatagraph
I made a switch from GDS and Sheets for reporting to Whatagraph, and I am saving literal hours each week on performance report creation. Our small firm actually managed to onboard 2 new clients as a result of all the time we saved on managing data and reporting. The customer service is also really helpful and easy to reach.

Capterra verified review by
Mindaugas S., Marketing Consultant
Having active customer support to help fix any issues was a big contributor, but we also really liked the ability to save templates and connect sources to multiple charts/widgets at once without having to edit them individually. And having the grid layout is much easier to stay consistent with than the free form setup that Data Studio has.

Capterra verified review by
Nico T., Media Planner
The system has standard templates that are easy and fast to use. Also you can build your own report with lightning speed. It is very easy to use, has a lot of integration, and let get started very fast.

Capterra verified review by
Rasmus Bernt K., External Senior Management Consultant
We love Whatagraph - we would definitely recommend and our account manager is great! I love how easy this tool is to use, everyone on the team finds it much more user-friendly than other dashboards. Integration was easy, we sent some example reports to the team who duplicated these for us. We literally had to log in and send it to our clients!

Capterra verified review by
Stephanie S., Digital Director
We are showing our clients the work that we're doing for them and this is incredibly important for our clients ROI. They want to see results and having a tool like Whatagraph that can show data from virtually every source we use is hugely important.

Capterra verified review by
John S., SEO Strategist
The tool is easy to use; you do not need to have development resources. Even my junior project managers are capable of making campaign reports in minutes. There are a lot of pre-made templates you can use as well as many pre-made widgets.

Capterra verified review by
Erman E., Marketing Specialist
Really easy to connect data sources within the tool. The library of report templates has been helpful. The customer support team has been responsive to all of our needs. Our team enjoys the simplicity of setting up the reports and how the data is presented.

Capterra verified review by
Brent N., Director of Operations
Easy to create really beautiful graphs and reports which can help other team members to understand the most important takeaways. I especially like the automated report function, so I don't have to check on the same thing repeatedly.

Capterra verified review by
Orsolya S., Online Marketing Manager