Reddit Ads Connector
Looking for an easy way to report on your Reddit Ads campaigns? Try our no-code Reddit Ads connector.
See all your key metrics on one dashboard and stay on top of your campaigns.
Share white-labeled reports with clients or the C-Suite. No third-party tools needed.
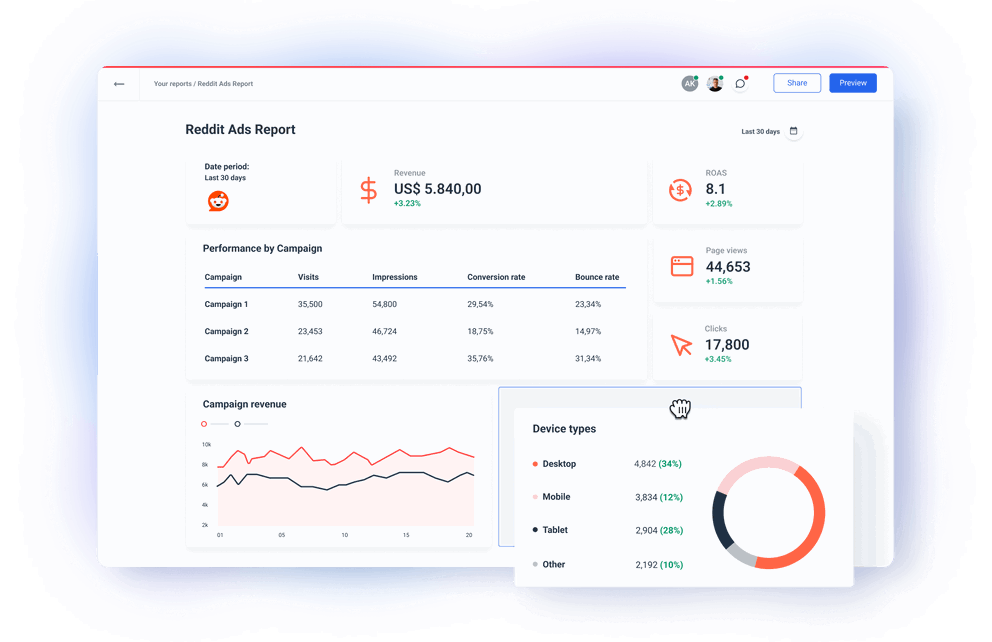


All-in-One Marketing Data Platform for Reddit Ads Data

Pull all Reddit Ads Metrics into your Reports and Dashboards
Reddit Ads metrics available instantly in Whatagraph
All
Reddit Ads (Campaigns)
23Reddit Ads (Ad Accounts)
8Reddit Ads (Ad Groups)
31Reddit Ads (Ads)
57Search...

Spend

Impressions

Clicks

Reach

Spend (micros)

eCPM

CTR

CPC

Purchase Conversions (Clicks)

Add to Cart Conversions (Clicks)

Add to Wishlist Conversions (Clicks)

Lead Conversions (Clicks)

Sign Up Conversions (Clicks)

Search Conversions (Clicks)

View Content Conversions (Clicks)

Page Visit Conversions (Clicks)

Purchase Conversions (Views)

Add to Cart Conversions (Views)

Add to Wishlist Conversions (Views)

Lead Conversions (Views)

Sign Up Conversions (Views)

Search Conversions (Views)

Page Visit Conversions (Views)

Purchase eCPA

Add to Cart eCPA

Add to Wishlist eCPA

Lead eCPA

Sign Up eCPA

Search eCPA

View Content eCPA

Page Visit eCPA

Add to Cart Average Value

Purchase Average Value

Add to Wishlist Average Value

Lead Average Value

Purchase Total Items

Add to Cart Total Items

Add to Wishlist Total Items

Purchase Total Value

Add to Cart Total Value

Add to Wishlist Total Value

Lead Total Value

Sign Up Total Value

Video Viewable Impressions

Video Fully Viewable Impressions

Video Plays With Sound

Video Plays Expanded

Video Watched 25%

Video Watched 50%

Video Watched 75%

Video Watched 95%

Video Watched 100%

Video Watched 3 Seconds

Video Watched 5 Seconds

Video Watched 10 Seconds

Cost Per View

Video Completion Rate
Check out related integrations:
Save Time on Monitoring and Reporting




Frequently Asked Questions
How easy is it to connect to Reddit Ads on Whatagraph?
It’s super easy, thanks to our home-built Reddit Ads integration. You don’t need any coding skills or third-party connectors to set up. With just a few clicks, you can connect your or your client’s Reddit Ads account, and that’s it.
Do I need Looker Studio to visualize my Reddit Ads data?
No, you don’t need Looker Studio to visualize your Reddit Ads data. Whatagraph is an all-in-one marketing data platform to connect, organize, visualize, and share all your data.
If you use two or three tools to get your data from sources to reports, you should definitely consider switching to a platform that does it all.
Having one platform to connect, organize, visualize, and share insights from your marketing data saves time and allows faster decision-making.
However, having options is even better. If you want, you can share organized Reddit Ads data with Looker Studio or any BI tool you want.
How can I create custom reports using data from Reddit Ads sources?
Creating custom reports with Reddit Ads data is easy if you use Whatagraph.
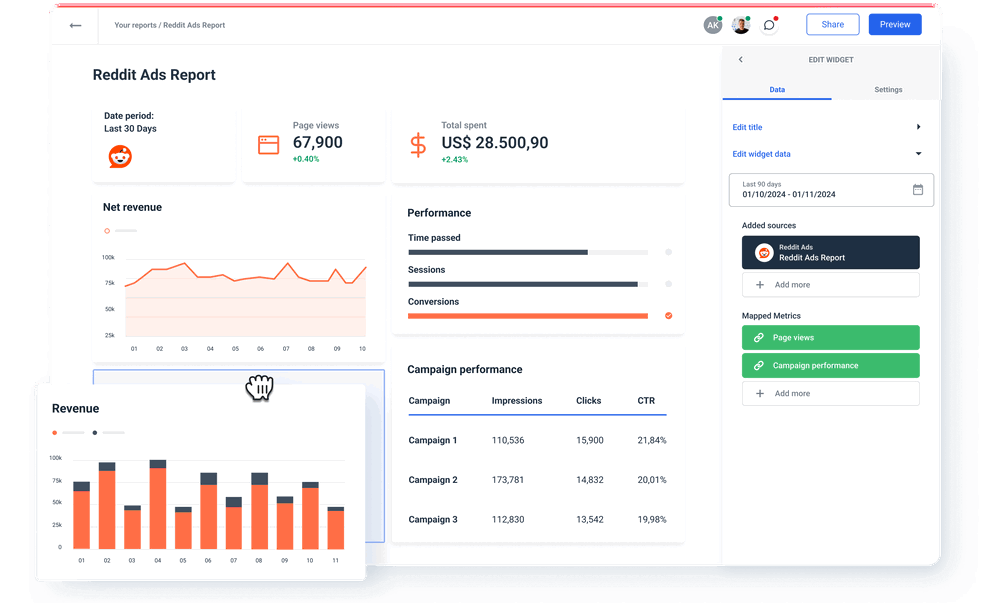
- Once you connect your Reddit Ads account, you get the pre-made metric widgets you can drag and drop to your report page.
- This way, you can present only those data points that you want to see. Apart from all metrics available from the Reddit Ads API, you can also create new metrics using simple formulas.
- You can also use our customizable goal widget to show the completion of the KPI goals you agree with your client.
- To make sure your clients understand what specific data means for their business, you can add custom text boxes with comments or next steps for each graph, table, or chart.
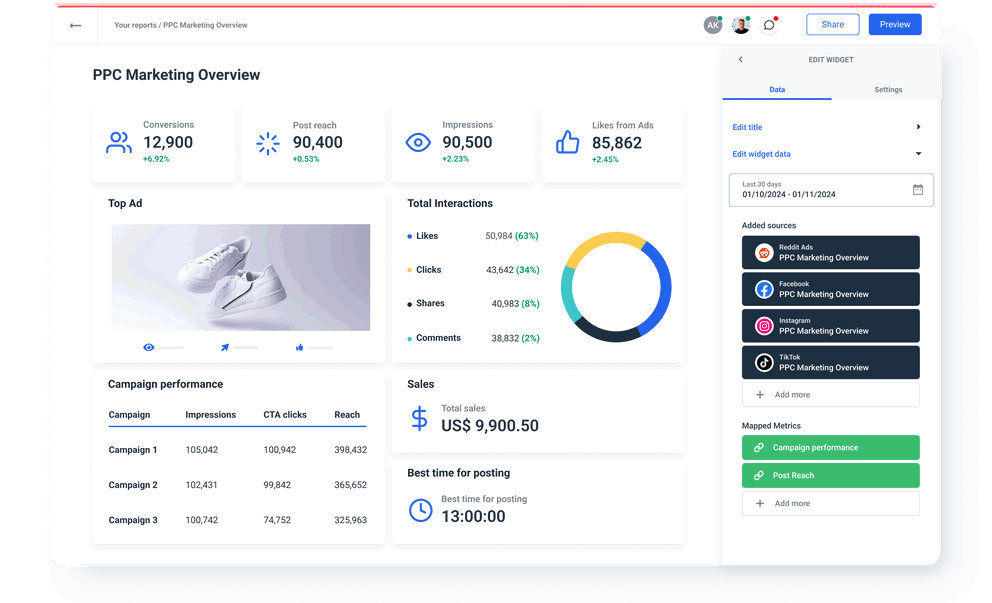
- If you choose to add data from other channels, you can also organize your reports using tabs for easier navigation.
- Finally, when you customize the content of your report, you can just as easily customize the looks.
- You can completely remove any mention of the Whatagraph brand and use your or your client’s logo and colors instead. You can even host the reports on a custom domain.
What metrics should I highlight on my Reddit Ads report?
The specific metrics will depend on each client or your internal needs, but those that you shouldn’t leave out are:
- Impressions: This metric shows how many times your ad was displayed to Reddit users. Although not a money metric, monitoring Impressions helps you see at what scale your ad is reaching potential customers.
- Clicks: An inevitable PPC metric that gauges user interest and engagement with your ad’s content. A starting point for optimizing your ad copy and visuals.
- Click-Through Rate (CTR): Calculated by dividing clicks by impressions, CTR helps you understand the relevance and appeal of your ads on a 1-100 scale.
- Cost per Click (CPC): CPC measures the cost of each click on your ad. Tracking CPC helps you assess cost efficiency and optimize your campaign budget, especially if you aim to lower the cost of each user interaction.
- Conversions: The number of desired actions (such as sign-ups, downloads, or purchases)completed by users after clicking on your ad. Tracking conversions is crucial for understanding how your campaign is good at driving specific business outcomes.
- Conversion Rate: The percentage of conversions divided by clicks gives a more palpable measure of your campaign’s success in driving users to desired actions.
- Cost per Conversion (CPA): This metric measures the cost to acquire each conversion. It’s crucial for determining the cost-effectiveness of your campaign in driving results.
- Spend: Tracking this metric lets you gauge your campaign from the financial perspective and adjust your strategy to keep it within budget limits.
- Return on Ad Spend (ROAS): A measure of revenue generated for each dollar spent on ads. ROAS gives you a glimpse into campaign ROI.
- Engagement Rate (Comments, Upvotes): The engagement rate on Reddit is especially important for brand awareness and sentiment. Higher engagement rates show that the ad resonates with Reddit users, driving conversations and boosting community interest.
- Video Views (for Video Ads): If your ad includes video content, video views help measure how many users watched the video. This metric tells you how engaging and relevant the video is to Reddit users.
- View-Through Conversions: This metric measures the number of users who didn’t click on the ad but converted later after seeing it. It’s valuable for assessing ad effectiveness in building brand awareness and influencing user actions over time.
Can I blend Reddit Ads data with other data?
Yes, you can blend Reddit Ads data with other data on Whatagraph. And the best part is…you don’t need any coding or data science knowledge to do it.
You can easily blend data sources together or create custom metrics and dimensions using a simple calculator on Whatagraph.
What others think about Whatagraph
I made a switch from GDS and Sheets for reporting to Whatagraph, and I am saving literal hours each week on performance report creation. Our small firm actually managed to onboard 2 new clients as a result of all the time we saved on managing data and reporting. The customer service is also really helpful and easy to reach.
Having active customer support to help fix any issues was a big contributor, but we also really liked the ability to save templates and connect sources to multiple charts/widgets at once without having to edit them individually. And having the grid layout is much easier to stay consistent with than the free form setup that Data Studio has.
The system has standard templates that are easy and fast to use. Also you can build your own report with lightning speed. It is very easy to use, has a lot of integration, and let get started very fast.
We love Whatagraph - we would definitely recommend and our account manager is great! I love how easy this tool is to use, everyone on the team finds it much more user-friendly than other dashboards. Integration was easy, we sent some example reports to the team who duplicated these for us. We literally had to log in and send it to our clients!
We are showing our clients the work that we're doing for them and this is incredibly important for our clients ROI. They want to see results and having a tool like Whatagraph that can show data from virtually every source we use is hugely important.
The tool is easy to use; you do not need to have development resources. Even my junior project managers are capable of making campaign reports in minutes. There are a lot of pre-made templates you can use as well as many pre-made widgets.
Really easy to connect data sources within the tool. The library of report templates has been helpful. The customer support team has been responsive to all of our needs. Our team enjoys the simplicity of setting up the reports and how the data is presented.


