Live Dashboards for Marketers
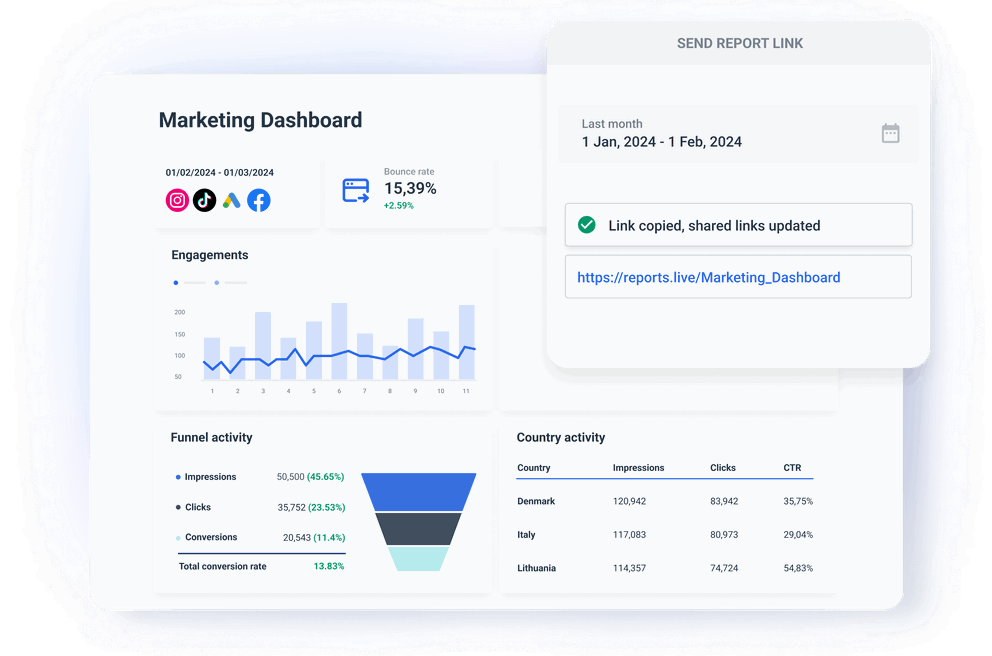
Present your marketing data in a user-friendly way and share links to live dashboards. The dashboards update automatically so your clients can always see the latest data. Unrestrained access to real-time data helps build trust while allowing stakeholders to make data-driven decisions fast. Tracking marketing goals has never been easier. Don’t bother with emails — share links to interactive dashboards in a few clicks.
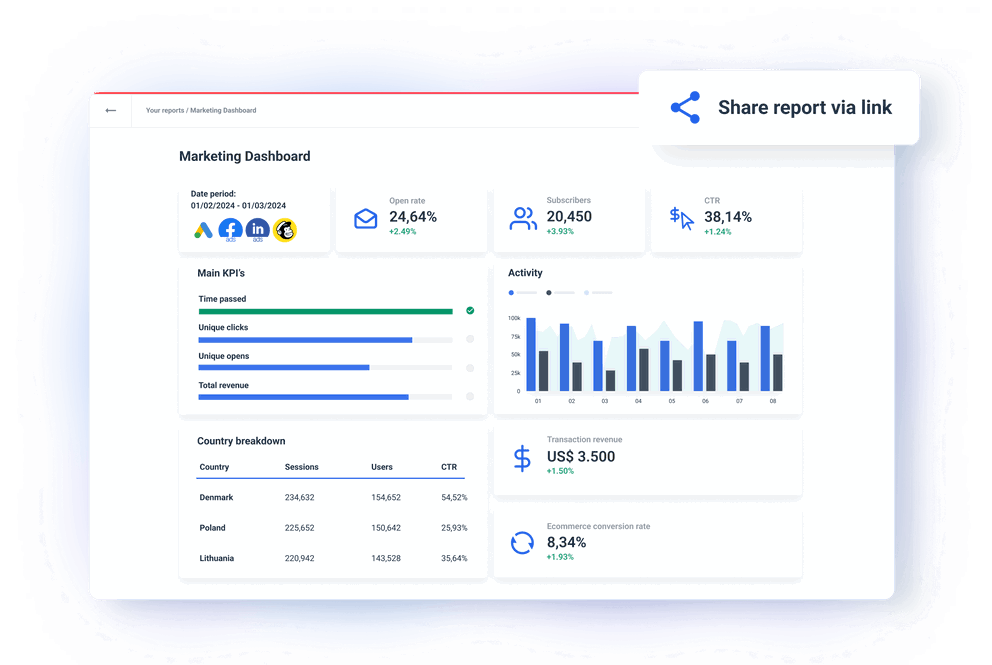
Quick and direct way to create and share live marketing dashboards
Live dashboards vs. static reports
Present your marketing data in a user-friendly way and share links to live dashboards. The dashboards update automatically so your clients can always see the latest data. Unrestrained access to real-time data helps build trust while allowing stakeholders to make data-driven decisions fast. Tracking marketing goals has never been easier. Don’t bother with emails — share links to interactive dashboards in a few clicks.
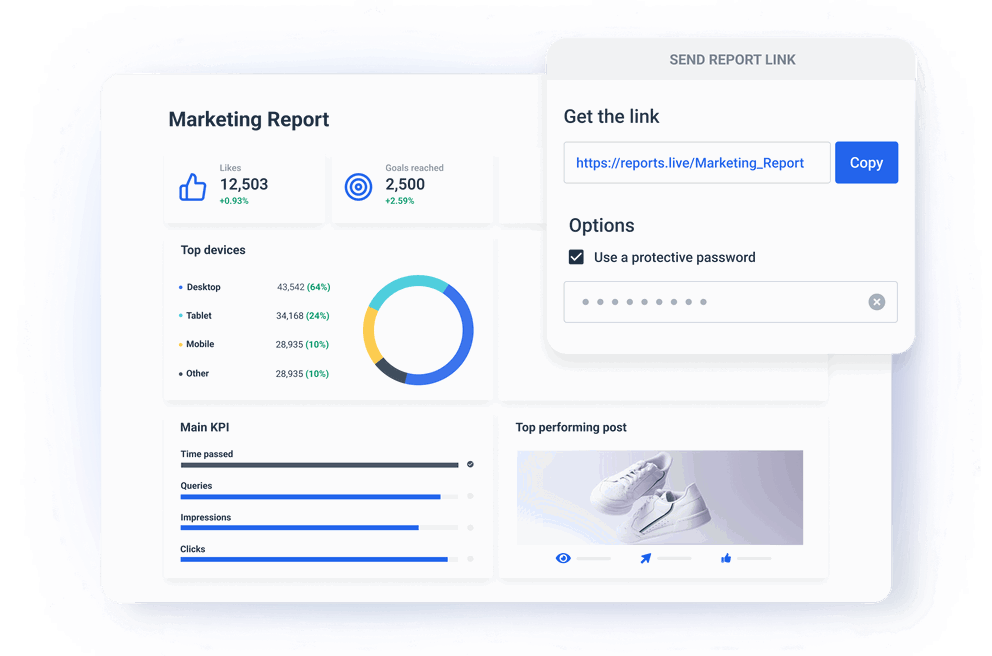
Stop worrying about report delivery and reviews
Manual report sharing often includes double-checking and sign-offs by account managers or higher-ups. Such a structured reporting process creates stress, delays, and uncertainties. Emails get buried among other updates or are never read. With direct access to data, you streamline the way you share insights. Once your marketing team agrees on the dashboard content, visuals, and layout, you can share it with your client and never worry about ad-hoc deliveries and approvals.

Build trust and transparency with your clients
An agency that provides access to key metrics from anywhere at any time has an edge in building better relations with its clients. Let clients change date ranges in shared dashboards and see how trends change over time. Hovering over individual graphs or tables reveals more detailed points under each graph or table. Sharing live dashboards speeds up both client-agency communication and decision-making. If a client wants to check the key performance indicators from a specific period, they don’t need to involve the account manager, and the account manager doesn’t need to involve anyone else in the agency.
Reduce opportunities for human error with live links
Preparing data, attachments, and emails to answer ad-hoc requests increases the chances of mistakes. Some errors lead to more time spent sorting things out, extra calls, or even a client churning. A live marketing dashboard eliminates chances for mistakes and out-of-the-blue questions from clients. The data in dashboards is fully automated, with values, dimensions, and metric names pulled directly from the connected marketing platforms. However, Whatagraph’s Organize functionality allows you to change those outputs into something more understandable or easier to read.
Create a new revenue stream by charging for on-demand dashboards
On-demand links to live data could be a new tier in your agency’s pricing offer. Automated emails with PDF attachments are not an ideal way of sharing information for all users. Emails can get lost in the spam folder, and people make errors, such as picking the wrong date range. Direct access to live dashboards removes all intermediaries between clients and their data. The end-readers can check the results of your marketing efforts at their convenience.
What others think about Whatagraph
I made a switch from GDS and Sheets for reporting to Whatagraph, and I am saving literal hours each week on performance report creation. Our small firm actually managed to onboard 2 new clients as a result of all the time we saved on managing data and reporting. The customer service is also really helpful and easy to reach.

Capterra verified review by
Mindaugas S., Marketing Consultant
Having active customer support to help fix any issues was a big contributor, but we also really liked the ability to save templates and connect sources to multiple charts/widgets at once without having to edit them individually. And having the grid layout is much easier to stay consistent with than the free form setup that Data Studio has.

Capterra verified review by
Nico T., Media Planner
The system has standard templates that are easy and fast to use. Also you can build your own report with lightning speed. It is very easy to use, has a lot of integration, and let get started very fast.

Capterra verified review by
Rasmus Bernt K., External Senior Management Consultant
We love Whatagraph - we would definitely recommend and our account manager is great! I love how easy this tool is to use, everyone on the team finds it much more user-friendly than other dashboards. Integration was easy, we sent some example reports to the team who duplicated these for us. We literally had to log in and send it to our clients!

Capterra verified review by
Stephanie S., Digital Director
We are showing our clients the work that we're doing for them and this is incredibly important for our clients ROI. They want to see results and having a tool like Whatagraph that can show data from virtually every source we use is hugely important.

Capterra verified review by
John S., SEO Strategist
The tool is easy to use; you do not need to have development resources. Even my junior project managers are capable of making campaign reports in minutes. There are a lot of pre-made templates you can use as well as many pre-made widgets.

Capterra verified review by
Erman E., Marketing Specialist
Really easy to connect data sources within the tool. The library of report templates has been helpful. The customer support team has been responsive to all of our needs. Our team enjoys the simplicity of setting up the reports and how the data is presented.

Capterra verified review by
Brent N., Director of Operations
Easy to create really beautiful graphs and reports which can help other team members to understand the most important takeaways. I especially like the automated report function, so I don't have to check on the same thing repeatedly.

Capterra verified review by
Orsolya S., Online Marketing Manager
Read more reviews on:


All live dashboard features your agency needs


Explore our stunning live marketing dashboards

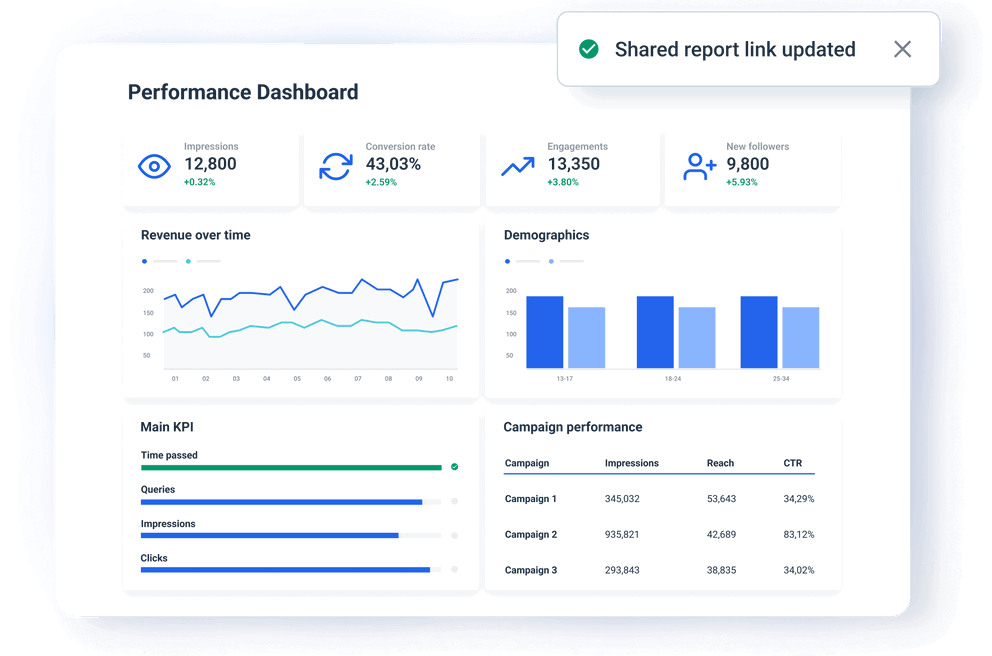
Performance Dashboard

Digital Marketing Dashboard
Frequently Asked Questions
How can I create a live marketing KPI dashboard in Whatagraph?
Creating a live KPI dashboard is easy and doesn't take longer than several minutes. Here are the basic steps:
Step 1:
Log in and go to the Data Sources menu to add the marketing channels you want to report on.
Step 2:
If you want to create a blend of two or more sources, you can do it in the Organize menu. Once you start building the dashboard, the blended sources will appear alongside other sources.
Step 3:
Select +New Report and choose to create a dashboard from a Template or Blank page. You can pick among pre-made marketing dashboard templates for different purposes, such as PPC, web analytics, search engine optimization, etc. If you choose to build a dashboard from scratch, you’ll get an empty dashboard page where you can drag and drop various data visualization widgets that stick to the grid. You can resize them, move them around, or change their report type, dimensions, metrics, filters, etc.
Step 4:
Whether you choose a template or a free build, you need to add sources to your dashboard. You can select any sources you connected in Steps 1 and 2. Each widget pulls data from a connected source, but you can also create multi-source widgets. You can create your own mix of single-value widgets that display conversion rate, page views, bounce rate, and graphs that show, for example, how website traffic changes over a set period.
Step 5:
Add custom messaging to your live dashboard — the headings, textual comments, explanations, etc. You can also swap Whatagraph’s logo to your agency’s own, and adjust the color scheme to match it.
Step 6:
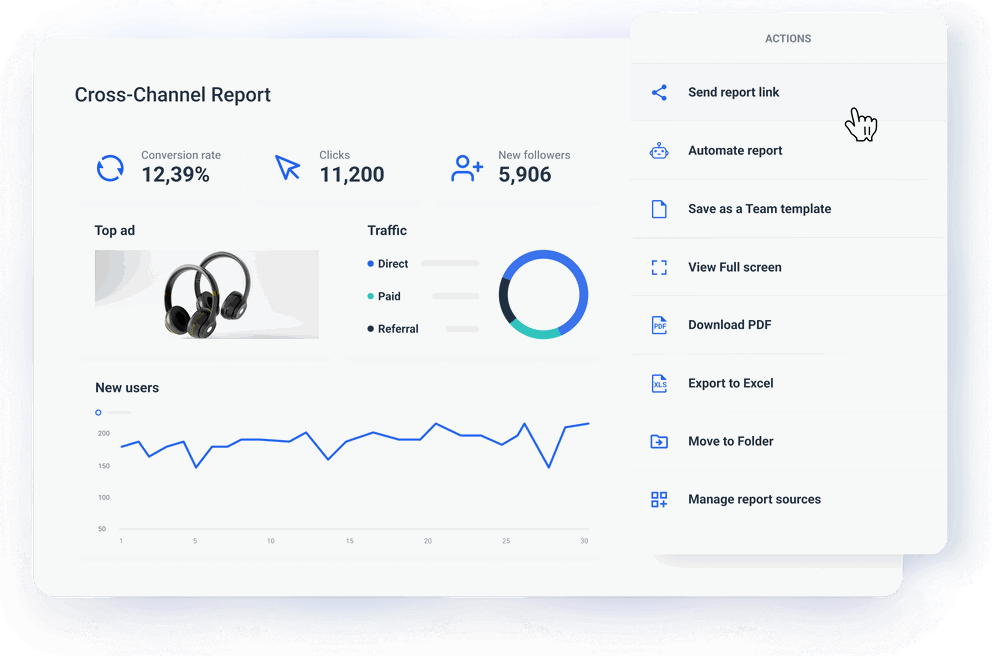
Once you’re happy with your dashboard, click Actions and Send Report Link. Your job is done.
What marketing channels can I connect to Whatagraph dashboard software?
You can connect over 45 popular online marketing data sources that allow you to present the results of your marketing strategy in different aspects — from website performance improvements to paid ads campaign performance to organic traffic and lead generation.
The platforms include Google Analytics 4, social media like Facebook and Instagram, PPC apps like Criteo, Google Ads (AdWords), and LinkedIn Ads, e-commerce, SEO, email marketing, and CRM tools.
You can connect any other source via a custom API, or by exporting data to Spreadsheets or BigQuery and adding them as a source.
Can clients export data from live reporting dashboards?
Clients can download the live dashboards as PDF or Excel files. The Excel export is convenient if clients want to further analyze data in another business intelligence tool.