Advertising Dashboard for Businesses & Agencies
Track and manage results from all your advertising channels in one intuitive advertising dashboard. Easily connect and aggregate data from Google Ads, Facebook Ads, and other social media, display, and paid search ad platforms. Visualize the most important marketing KPIs and share the insights with clients or stakeholders for fast and informed decision-making.


A complete advertising campaign dashboard for all your marketing data insights
Advertising dashboard that clients love and understand
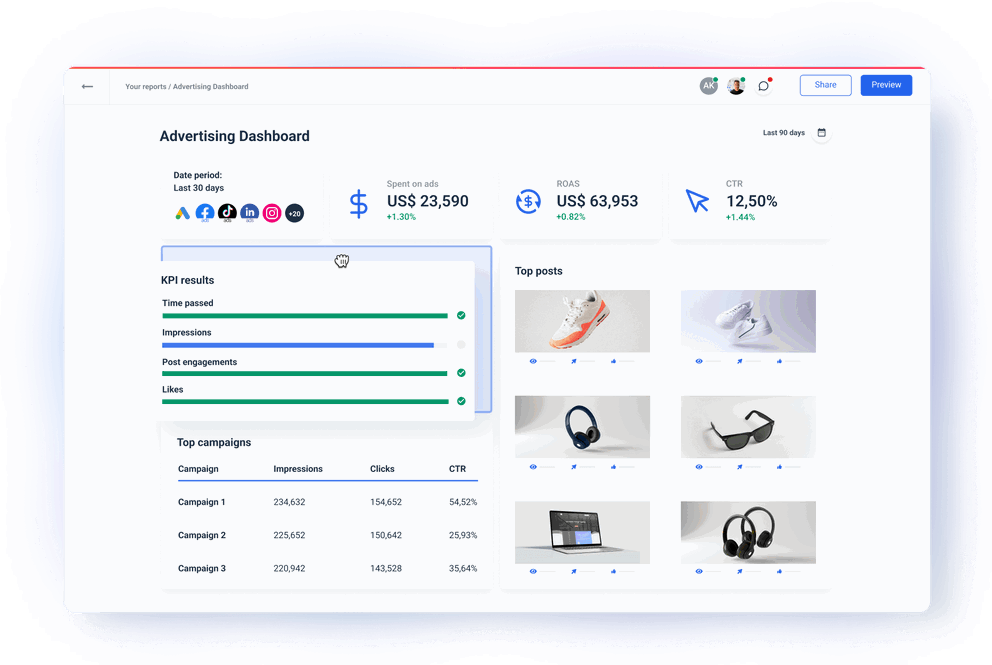
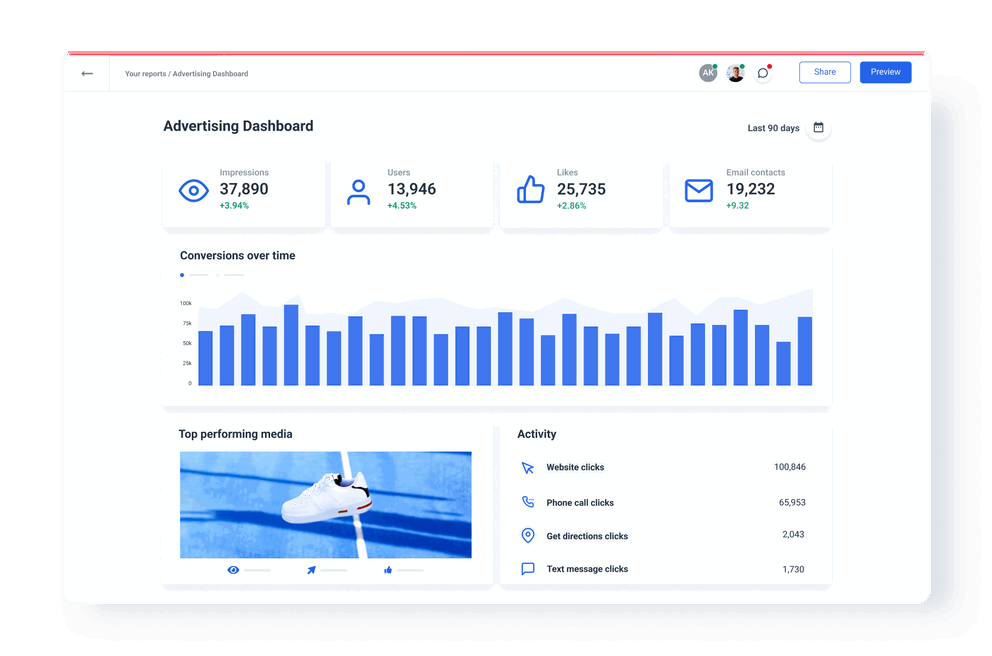
Present a top-level digital advertising dashboard that impresses and engages your clients or stakeholders. Include only the most relevant advertising KPIs and visualize them based on your preferences with lists, tables, charts, images, or comments. Filter out the marketing data stream so the end-readers only see the data that matters the most. Monitor ad campaign performance metrics to determine what ads resonate with your target audience.
All the essential ad integrations in one dashboard
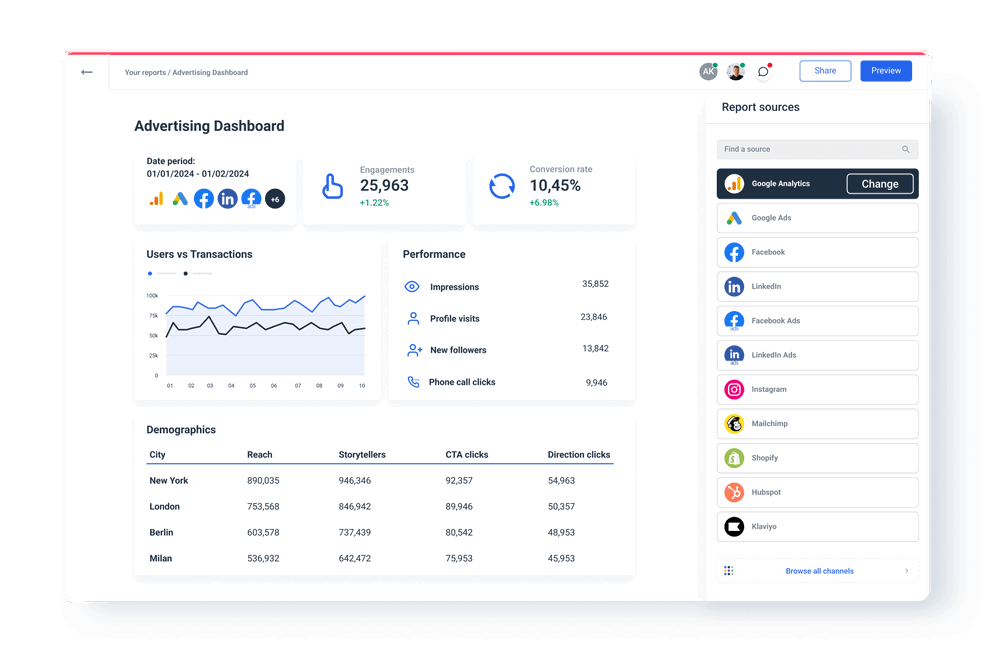
Connect all your advertising channels for effortless cross-channel insights. Compare ad performance from different channels or blend key metrics from multiple lead generation campaigns for a total view. Use custom formulas to calculate spend from several ad campaigns or easily add the agency markup.
Save time by automating advertising dashboards
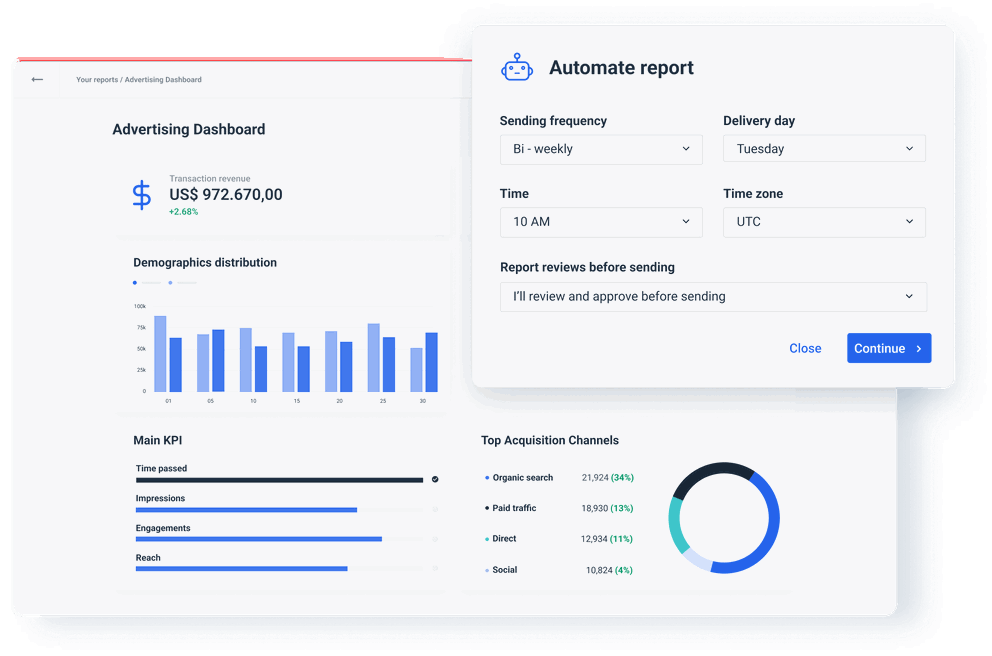
Keeping your clients or board up to date adds a few more hours of work every week. With Whatagraph automation features, you can save that time for more impactful things like developing new marketing strategies or acquiring new clients. Once you connect the sources and customize the dashboard, there’s nothing to manage or re-set. Share a live link for on-demand access so your stakeholders can always be on the same page with their marketing metrics.
All dashboard features your agency needs


What is an advertising dashboard?
An advertising dashboard is a digital marketing dashboard that allows marketers to combine data from multiple advertising and other digital marketing channels into one single interactive view in order to monitor and share the results of ad campaigns more clearly.


Created detailed reports and dashboards on you paid ads data
Find a dashboard for you
Facebook Ads Reporting Tool
Facebook Ads Dashboard Template

TikTok Ads Dashboard
Google Ads Reporting Tool

Amazon Ads Dashboard
PPC Reporting Tool

PPC Dashboard Template
Bing Ads Dashboard

Adroll Reporting Tool

Advertising Reporting Tool

Basis (Formerly Centro) Reporting Tool

Google Search Ads 360 Reporting Tool
Frequently Asked Questions
Can clients compare data of different time periods when viewing advertising dashboards created with Whatagraph?
Good news! All Whatagraph’s dashboards have interactive data visualization widgets. Whenever you send a dashboard (a link or an email) your clients can change the time periods and get real-time data. Readers can also hover over individual graphs or table fields to reveal more data underneath.
How many advertising dashboards can I create using Whatagraph?
All of our pricing plans include an unlimited number of dashboards. Create, edit, and send as many as needed. Apart from the advertising dashboard, you can easily connect different marketing channels and use the templates or pre-made widgets to create an online marketing dashboard, web analytics dashboard, or any KPI dashboard that helps you present the results of your marketing activities.
What are the benefits of using an advertising dashboard for an agency?
There are many ways to benefit from an advertising dashboard. Some of the most common advantages of using an advertising dashboard are:
- Advanced campaign insights in one place;
- No more manual reporting;
- Saving hours every week on creating reports;
- No more human errors while copying advertising data from different sources;
- Aggregated visual data in one place;
The same benefits also apply to in-house marketing teams in companies across all industries.
Can you export data from Whatagraph?
You can export data from Whatagraph as CSV files or Excel spreadsheets.
What marketing performance indicators should I track with an advertising dashboard?
Whatagraph allows you to customize your advertising dashboard any way you like, but these are the key performance indicators and metrics you should consider:
1. Impressions: The number of times your ad is displayed.
2. Click-Through Rate (CTR): The percentage of people who click on your ad after seeing it.
3. Cost per Click (CPC): The average cost you pay for each click on your ad.
4. Conversion Rate: The percentage of ad clicks that result in a desired action, such as signing up for a demo or downloading a resource.
5. Bounce Rate: The percentage of visitors who land on a website or landing page after clicking on an ad, but then leave without interacting further with the site.
6. Cost per Conversion (CPA): The average cost you pay for each desired action or conversion.
7. Return on Ad Spend (ROAS): The revenue generated from your advertising campaigns divided by the cost of those campaigns, expressed as a ratio or percentage.
8. Ad Spend: The total amount of money spent on advertising campaigns within a specific timeframe.
9. Ad Placement: Track which placements (e.g., websites, social media platforms) perform best for your ads.
10. Quality Score: For platforms like Google Ads, evaluate the quality and relevance of your ads, keywords, and landing pages, which can affect ad performance and cost.
By tracking these KPIs and metrics in your advertising dashboard, you can effectively monitor the performance of your ad campaigns, optimize your marketing efforts for better results, and allocate ad spend more efficiently.
It’s good to be loved! Our clients are not shy about expressing it.
I made a switch from GDS and Sheets for reporting to Whatagraph, and I am saving literal hours each week on performance report creation. Our small firm actually managed to onboard 2 new clients as a result of all the time we saved on managing data and reporting. The customer service is also really helpful and easy to reach.

Capterra verified review by
Mindaugas S., Marketing Consultant
Having active customer support to help fix any issues was a big contributor, but we also really liked the ability to save templates and connect sources to multiple charts/widgets at once without having to edit them individually. And having the grid layout is much easier to stay consistent with than the free form setup that Data Studio has.

Capterra verified review by
Nico T., Media Planner
The system has standard templates that are easy and fast to use. Also you can build your own report with lightning speed. It is very easy to use, has a lot of integration, and let get started very fast.

Capterra verified review by
Rasmus Bernt K., External Senior Management Consultant
We love Whatagraph - we would definitely recommend and our account manager is great! I love how easy this tool is to use, everyone on the team finds it much more user-friendly than other dashboards. Integration was easy, we sent some example reports to the team who duplicated these for us. We literally had to log in and send it to our clients!

Capterra verified review by
Stephanie S., Digital Director
We are showing our clients the work that we're doing for them and this is incredibly important for our clients ROI. They want to see results and having a tool like Whatagraph that can show data from virtually every source we use is hugely important.

Capterra verified review by
John S., SEO Strategist
The tool is easy to use; you do not need to have development resources. Even my junior project managers are capable of making campaign reports in minutes. There are a lot of pre-made templates you can use as well as many pre-made widgets.

Capterra verified review by
Erman E., Marketing Specialist
Really easy to connect data sources within the tool. The library of report templates has been helpful. The customer support team has been responsive to all of our needs. Our team enjoys the simplicity of setting up the reports and how the data is presented.

Capterra verified review by
Brent N., Director of Operations
Easy to create really beautiful graphs and reports which can help other team members to understand the most important takeaways. I especially like the automated report function, so I don't have to check on the same thing repeatedly.

Capterra verified review by
Orsolya S., Online Marketing Manager