


What is a PPC report generator?
If you’re a marketing agency with 10+ clients, you know managing, tracking, and reporting on campaign performance can be excruciating.
You need to log on to multiple disparate platforms, copy and paste numbers onto a spreadsheet, analyze the data, transfer it to a visualization tool…the list goes on.
What’s worse, you’ve got to repeat this process for all your clients. This can quickly snowball into hundreds of hours on creating reports every month, putting strain and pressure on your account managers.
A PPC report generator eliminates these pains.
Instead of spending hours manually pulling data from Google Ads, Facebook Ads, and other PPC platforms, this tool consolidates all key metrics on a single, easy-to-read report.
For marketing agencies, this means:
- less time on manual and repetitive tasks
- more time on strategizing, building client relationships, and onboarding new clients
What should you look for in the best PPC report generator?
Not all PPC report generators are created equal, however. Some are slow and a pain to set up, while others are more plug-and-go.
To create truly impactful reports and streamline reporting, we recommend you look for that tool that is:
1. Easy to set up and use
For agencies, time is money.
A PPC reporting tool that's easy to set up and use means less time spent on figuring out complex software and more time delivering results for clients (and onboarding new ones!).
Look for a reporting tool with:
- Automated data connections that you can set up in a few clicks
- Intuitive interface that requires little to no training
- Drag-and-drop widgets, charts, and graphs to build reports
- Extensive library of reporting examples
- Simple but powerful customization options (but not too much that will overwhelm you
- Excellent customer support to troubleshoot issues
All this means you can put your reporting process on autopilot. You or your team can now generate compelling reports in less than an hour without having to set up complex data integrations or hire a data scientist.
Plus, an easy-to-use tool means it’s easier and faster to onboard new team members and clients, and you can use that time saved to do other value-adding tasks.
2. Highly customizable
Different clients have different campaign goals and channels, and it’s really important that the PPC reporting software allows you to choose which metrics you want to highlight on reports.
For instance, on Whatagraph, you can pick and choose which metrics/KPIs you want to highlight for each channel using drag-and-drop widgets.
This means anyone on your team can easily build marketing reports without having to spend 1000s of dollars on a data scientist or an implementation partner.
You can also create any kind of customer dimensions and metrics by blending data or channels together.
On the reporting side of things, you can:
- Upload your logo or your client’s logo to the report
- Create color schemes that fit your brand colors
- Add text, headers, and footers
This means you get professional and white-labeled reports, without overwhelming your team with complex customization set ups.
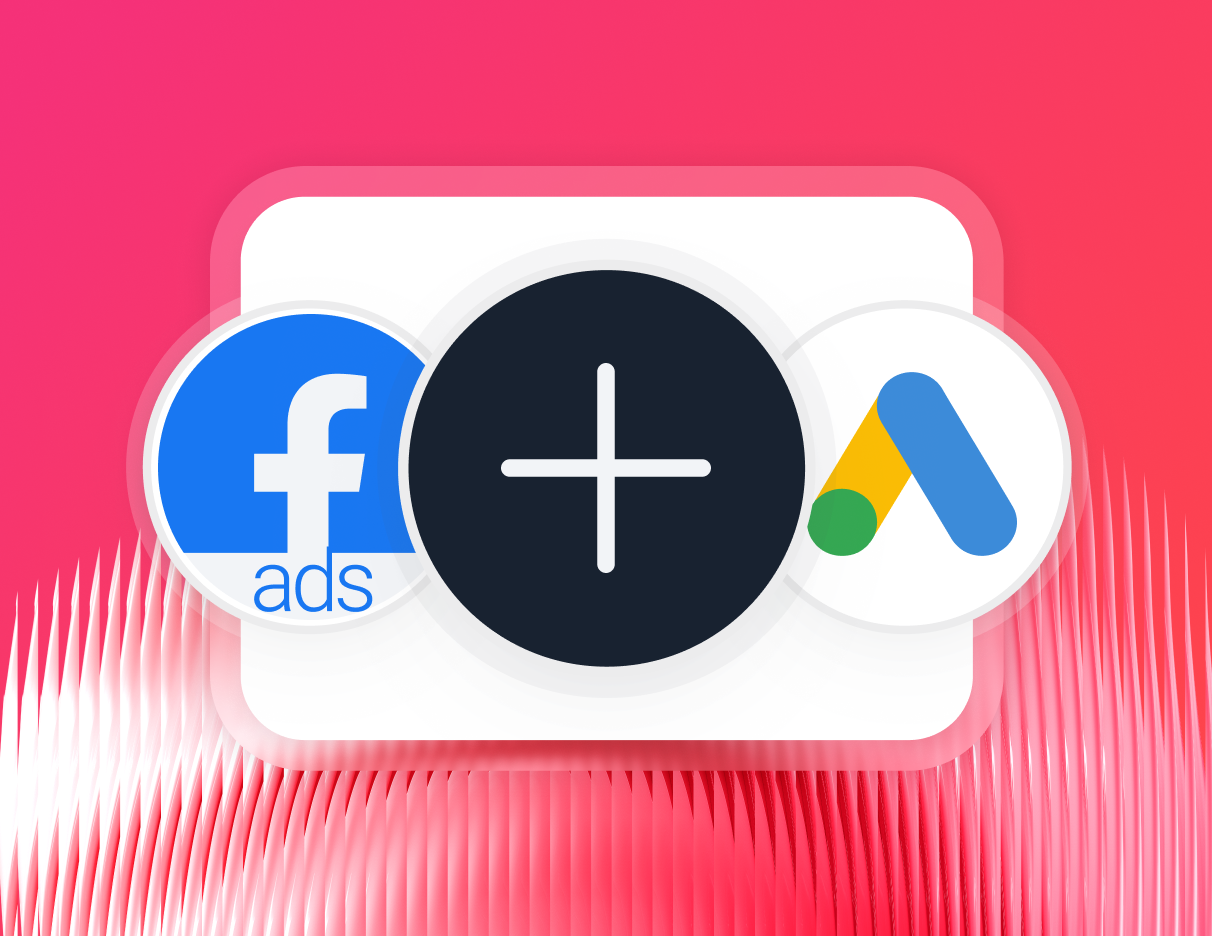
3. Easy to integrate with all PPC platforms
The main point of ad reporting tools is to bring in data from disparate ad channels and consolidate all key metrics on one platform.
To do this effectively, the tool should easily integrate with all the major PPC channels, like:
- Google Display and Video 360
- Google Ads
- Facebook Ads
- LinkedIn Ads
- TikTok Ads
- Pinterest Ads
- Twitter Ads
- Amazon Advertising
- Google Analytics
(Psst. On Whatagraph, you can connect with all of these platforms and more in just a few clicks.)
4. Stable and Reliable
It’s not just about how many integrations are available or how easy they are, but also how stable each integration is.
Most PPC tracking software will use third-party connectors to pull data, but they can be unstable due to:
- API limitations and changes
- Data compatibility issues
- Rate limits
- Authentication problems
- Network and latency issues
On Whatagraph, the integrations we provide are fully-managed. This means they’re more reliable, seamless, and regularly maintained by our dedicated Product team members.
These integrations pull data from multiple sources automatically and normalize it into consistent, usable formats that are ready for accurate reporting. No manual cleaning or prepping needed.
Fully-managed solutions also allow you to blend data from different sources to create custom metrics and dimensions for more comprehensive reporting.
Most importantly, with fully-managed integrations, our Product team can resolve bugs faster without having to get a third-party company involved. This brings us to the next point.
5. Dedicated to Customer Success
No matter how easy an online PPC reporting tool is, there might be times when you need help from a real person to get you through things.
At times like this, it’s crucial that you can contact your reporting software provider and get help quickly.
At Whatagraph, you can reach out to us via live chat on our website or email. And our amazing Customer Support team will get back to you within 34 seconds to 4 minutes, and resolve issues within 5 to 24 hours.
What are the best PPC report generators?
There are plenty of PPC report tool options out there, but not all are built for agencies managing multiple clients and campaigns. Here's a quick breakdown of the top six:
1. Whatagraph: The best PPC reporting platform for agencies and performance marketing teams. Connect 60+ channels, build reports with AI, automate delivery, and white-label everything. No data analyst required.
With Whatagraph, agencies like Maatwerk Online are saving 100 hours a month on reporting.
Hear from Lars Maat, Co-Founder of Maatwerk Online:
Whatagraph has also launched an MCP that lets you connect your data to Claude or ChatGPT and analyze your data there.
2. Looker Studio: Google's free PPC multi-channel dashboard tool. Works well for Google-only campaigns, but you'll need paid third-party connectors for Meta, LinkedIn, or TikTok data — and those connectors break.
3. DashThis: Simple and easy to pick up, great for freelancers and small businesses. Limited data organization and no AI insights.
4. ReportGarden: Good for small agencies with basic PPC reporting needs. Lacks advanced data blending, custom metrics, and agency-level performance dashboards.
5. AgencyAnalytics: User-friendly with solid multi-client management and AI features. Can be glitchy and lacks advanced data calculations.
6. Swydo: Clean UI, smooth report automation, good templates. Missing data blending and custom dimensions — limiting for full-service agencies.
Want a detailed breakdown of features, pricing, and real user reviews? Read our full guide to the 6 best PPC reporting tools.
How agencies are winning with Whatagraph PPC reporting for clients
Agencies don't just use Whatagraph to build prettier reports. They use it to save hundreds of hours, retain clients, and scale without adding headcount. Here are three real stories.
Maatwerk Online: 100 hours saved per month
Challenges
Maatwerk Online, one of the Netherlands' top PPC agencies, was running their reporting on a Frankenstack of Supermetrics and Looker Studio. Dashboards were slow to load, connectors kept breaking, and reports were bloated with metrics that clients never looked at. The bigger the dashboard got, the more unreliable it became.
Solution
They switched to Whatagraph and built four reusable pillar templates covering eCommerce, leadgen, branding, and B2B. For 90% of clients, reports were ready with minimal customization needed.
They also rolled out Whatagraph IQ so specialists could build widgets and answer client questions on the spot, without digging through dashboards. This automated PPC reporting software gave the whole team an energy boost.
Results
Maatwerk Online now saves over 100 hours per month on reporting. They eliminated their €4,000 annual Supermetrics bill and broke even on Whatagraph's cost entirely by introducing report licensing fees for clients.
Whatagraph saves time and energy, and the hours we're saving is just pure profit. We now have the time to focus on more strategic things that help both our agency and our clients grow. - Lars Maat, Co-Founder at Maatwerk Online
Read the full case study here.
Peak Seven: 63 hours saved per month, clients retained
Challenges
Peak Seven is a Florida-based advertising agency managing over 100 ad campaigns for 25 franchise clients.
Their reporting on Looker Studio and Supermetrics was a constant source of pain. Data wouldn't pull through correctly, connections broke regularly, and building a single report from scratch took their Digital Marketing Specialist up to 40 hours the first time around.
Solution
They replaced the entire stack with Whatagraph as their single PPC monitoring software for both clients and internal teams. Their specialist built a master PPC dashboard for franchise clients, swapping out data sources instead of rebuilding reports from scratch every month.
Custom formulas let her combine data across channels into one accurate cross-channel view. When clients had questions on calls, she could pull up a graph in real time without ever leaving the platform.
Results
Whatagraph’s agency reporting tool cut their report time from 4 hours to 1.5 hours per report. Across 25 monthly reports, that adds up to 63 hours saved every month, worth $9,450 in client time. Reports that once looked broken and muddled now help Peak Seven retain clients they were on the verge of losing.
Whatagraph took us to the next level with our clients and within our team. With Looker Studio, everything was muddled. But Whatagraph has opened up transparency and communication. It's now our Bible, both for our clients and our team.- Kim Strickland, Digital Marketing Specialist at Peak Seven
YourFellow: 50% less time on reporting, 65% cost savings
Challenges
YourFellow is a performance marketing agency based in the Netherlands, managing 35 to 40 clients across Google Ads, Meta, SEO, and CRO. They ran their reporting through a combination of Funnel and Looker Studio.
The setup was complex, dashboards took 15 minutes to load due to constant rate limits, and all the dashboarding work piled onto one person. Their Online Marketing Consultant, Linda van Baal, was spending one full day every week just maintaining reports for colleagues, on top of managing her own clients.
Solution
They migrated all 35 clients to Whatagraph in under two months. Linda built two core templates covering eCommerce and lead generation clients, then ran a team-wide dashboard-building session so every consultant could create and manage their own reports independently.
Whatagraph's support team responded to queries in under 30 minutes throughout the migration. A custom BigQuery export also preserved their existing Google Sheets product feed workflow without any disruption.
Results
Reporting time dropped by 50%, saving 16 hours per month. Dashboard load times went from 15 minutes to under 2 minutes. By replacing Funnel with Whatagraph, the agency cut reporting tool costs by up to 65%, freeing up budget to reinvest in growth.
Whatagraph saves me at least half a day a week, maybe even more. The biggest advantage is that everything is now in one tool and the dashboards look way cleaner and more customized to our own brand. - Linda van Baal, Online Marketing Consultant at YourFellow
How do you track PPC performance?
The easiest way to track PPC performance is to use dedicated reporting software. For instance, on Whatagraph, you can start tracking and reporting performance in four simple steps:
Step 1. Connect to your data sources.
The first thing you want to do is connect to the PPC channels you want to pull data from. You can do this in a few clicks on Whatagraph.
If you’d like a custom integration, you can also build it easily using our Custom API.
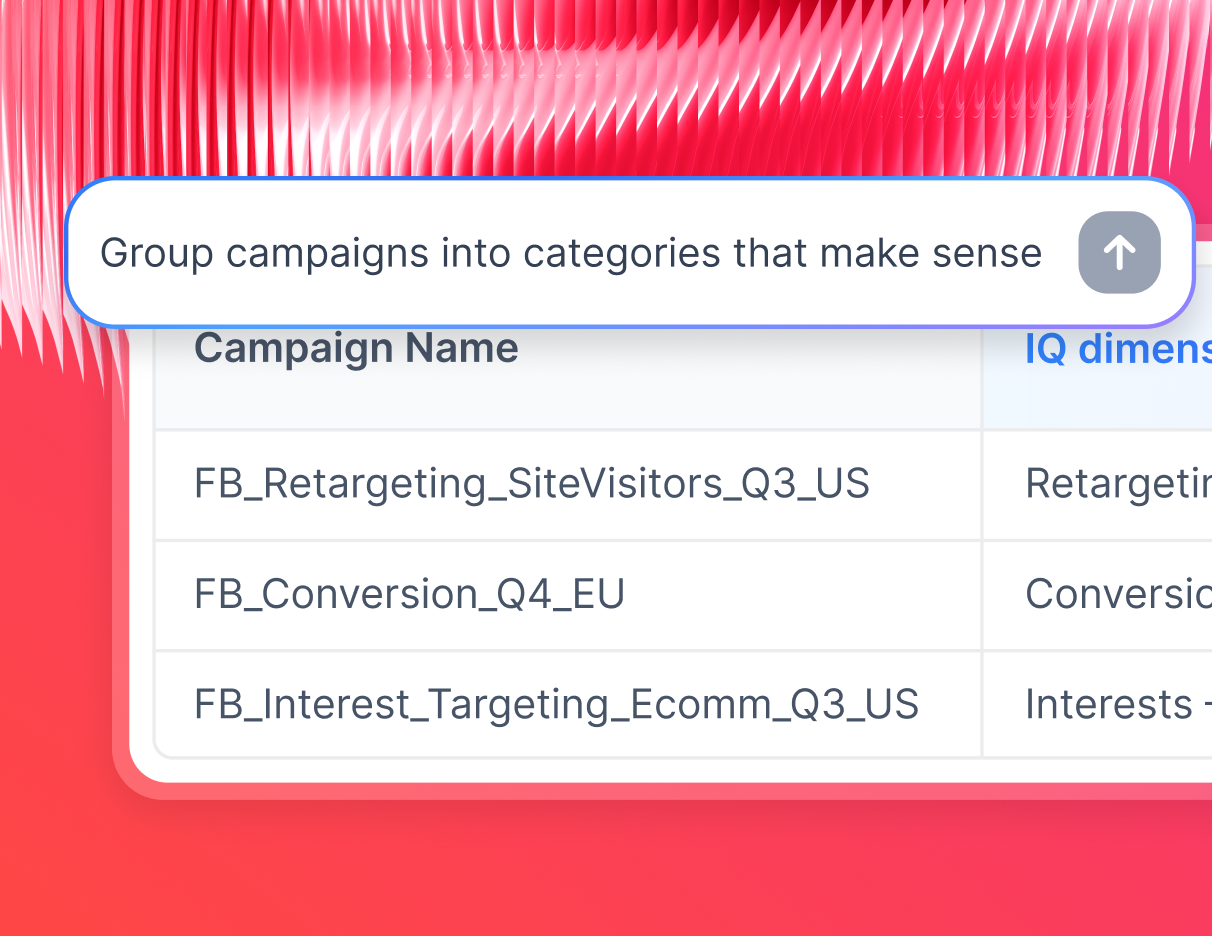
Step 2. Organize your data.
Once your data sources are connected, the next step is to organize your data in a way that is easy to digest for your team and clients.
Organizing your data helps with:
- Creating data blends from different sources
- Unifying dimension names
- Standardizing campaign names
- Matching metric names
- Segmenting data by specific demographics or geographics
The result is standardized, unified PPC reports that both your teammates and clients can easily understand. And the benefits of this are:
- Fewer back-and-forth questions about the data on reports
- Less data discrepancies
- More comprehensive view of performance
Step 3. Visualize the data.
You’ve got all your data sources connected and your data prepped. It’s time to visualize it in a report.
There are three ways to do so:
- Use Whatagraph IQ to build a full PPC ad performance report instantly from a single prompt
- Grab one of our PPC report templates co-created with top performance marketers
- Start from a blank canvas and drag-and-drop widgets
With IQ Report Creation, just type what you need - "create a PPC report for my client with spend and conversions across Google Ads and Meta" — and Whatagraph generates the full report with the right charts, tabs, and KPIs automatically.
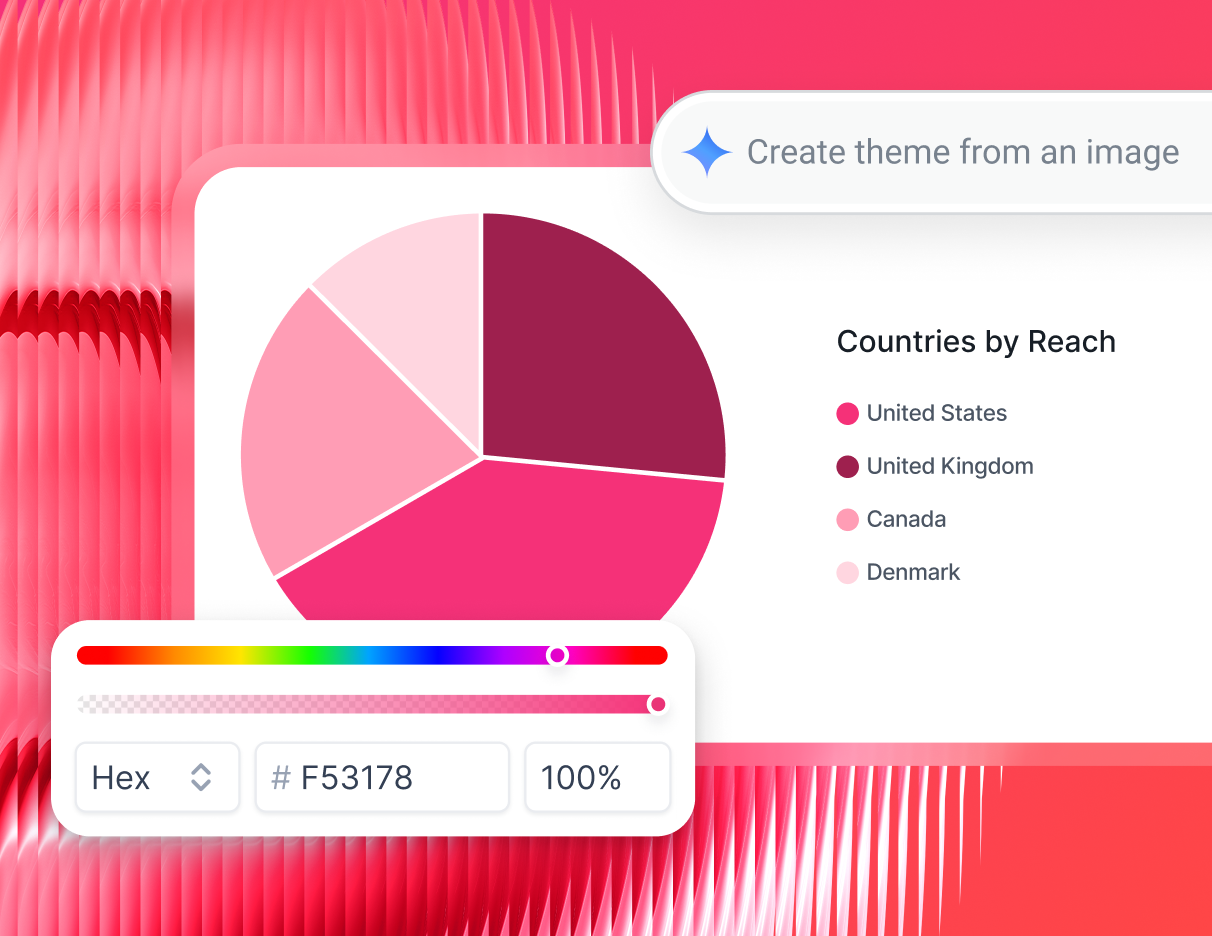
Want it branded for a specific client? Use IQ Themes. Upload a logo or screenshot of a brandbook and Whatagraph automatically applies the right colors, fonts, and style across the entire report in seconds. No manual formatting needed.
Here’s how Whatagraph IQ works:
Step 4. Analyze your data with AI
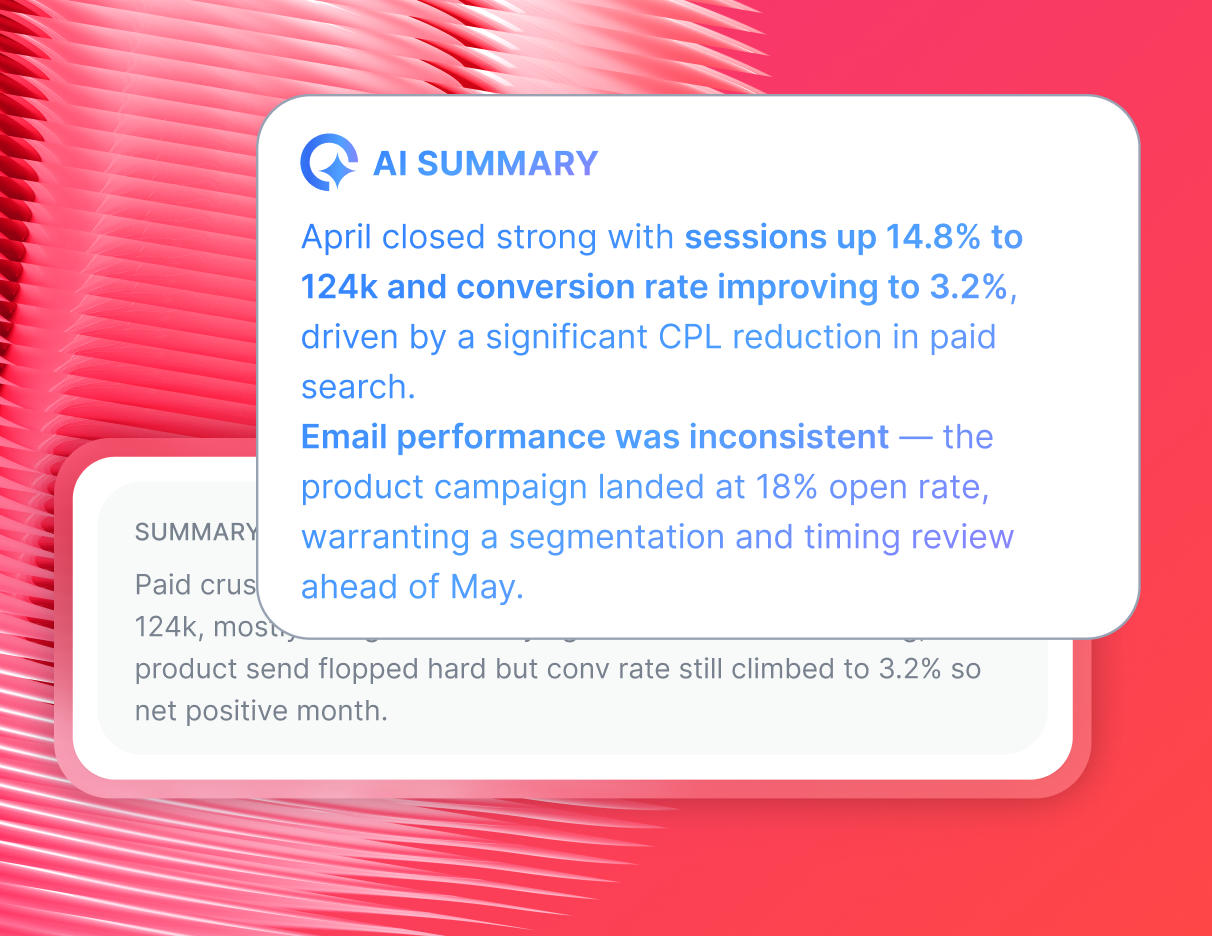
Clients don't want a wall of graphs. They want to know what happened, why it happened, and what to do next. That's exactly what Whatagraph IQ delivers.
IQ Summaries automatically write plain-language performance summaries based on the actual data in your report. You can use them as-is or tweak them for that human touch. No more staring at a blank text box before a client call.
IQ Chat lets you and your team ask questions about campaign performance in plain English and get instant answers. Ask things like "which campaign drove the highest ROAS last month?" or "show me total ad spend across Google Ads and Facebook Ads" and get a direct, accurate answer grounded in your actual data. It's like having a data analyst on call, without the overhead.
Step 5. Share the reports
The last step of this reporting journey is to share your reports with your clients or team.
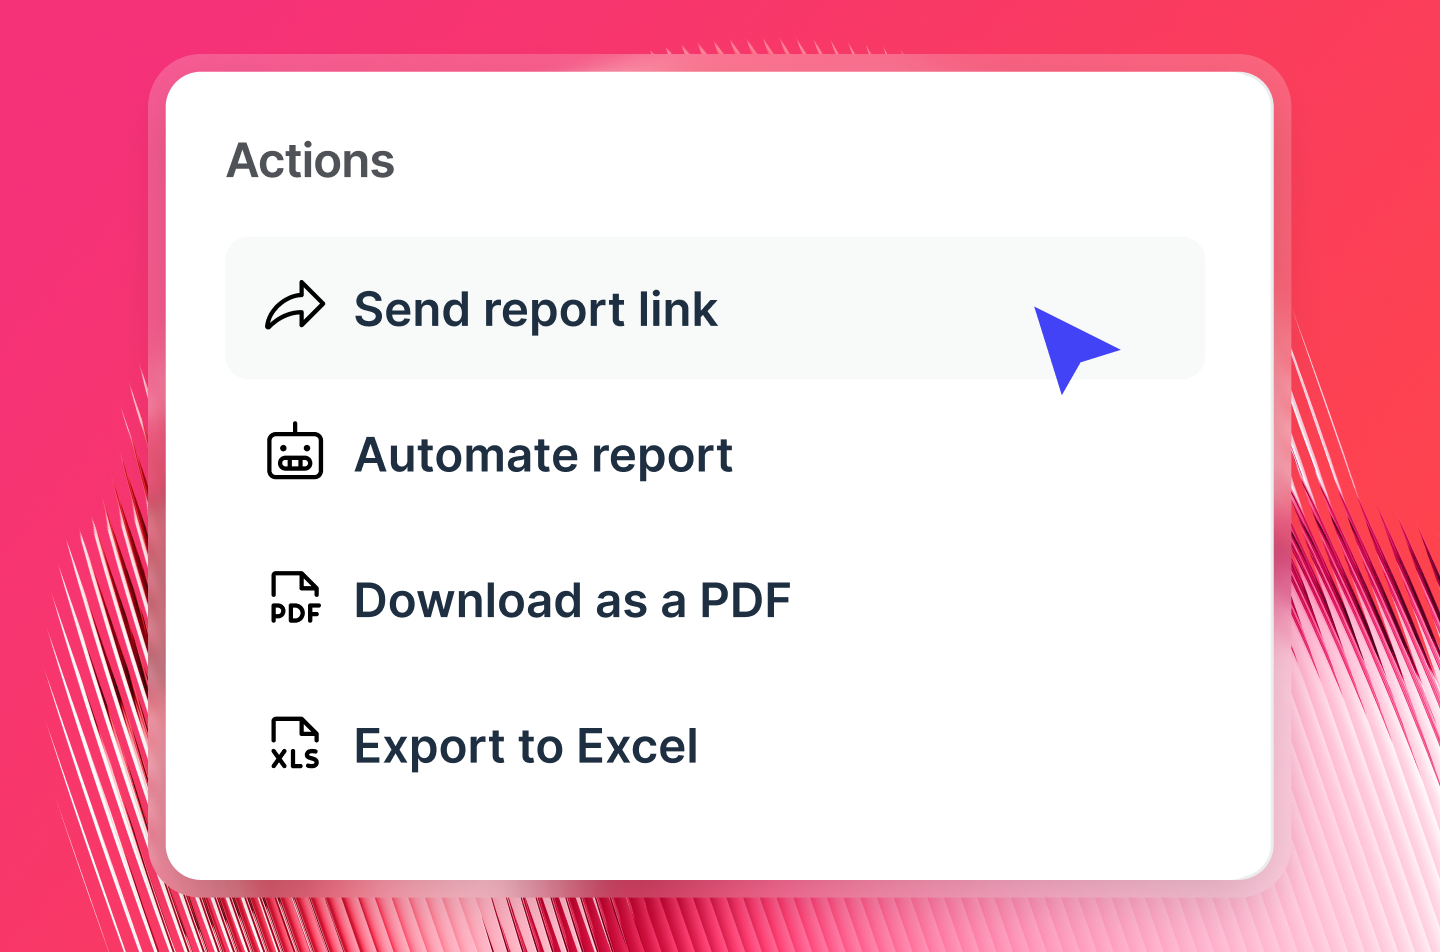
You can do this on Whatagraph in three main ways:
- Share report links with anyone you’d like
- Send white-labeled, automated emails on a regular cadence (e.g. every month) - best to automate PPC reports for all your clients every month
- Export as Excel or CSV
These are the most useful for agencies, but you can also transfer data to BigQuery on Whatagraph.
What should be included in a PPC report?
Based on thousands of PPC reports created by marketers on Whatagraph, we built this PPC campaign report template that you can use for free with your data.
It’s divided into five different tabs (yes, tabs - not pages), and here’s what each of them includes:
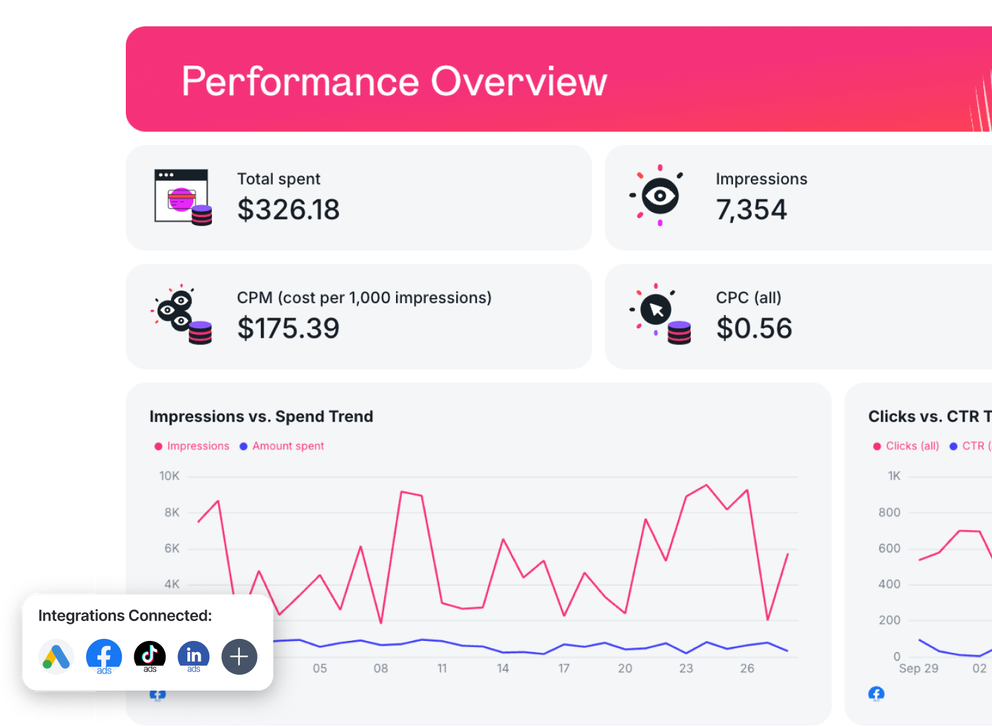
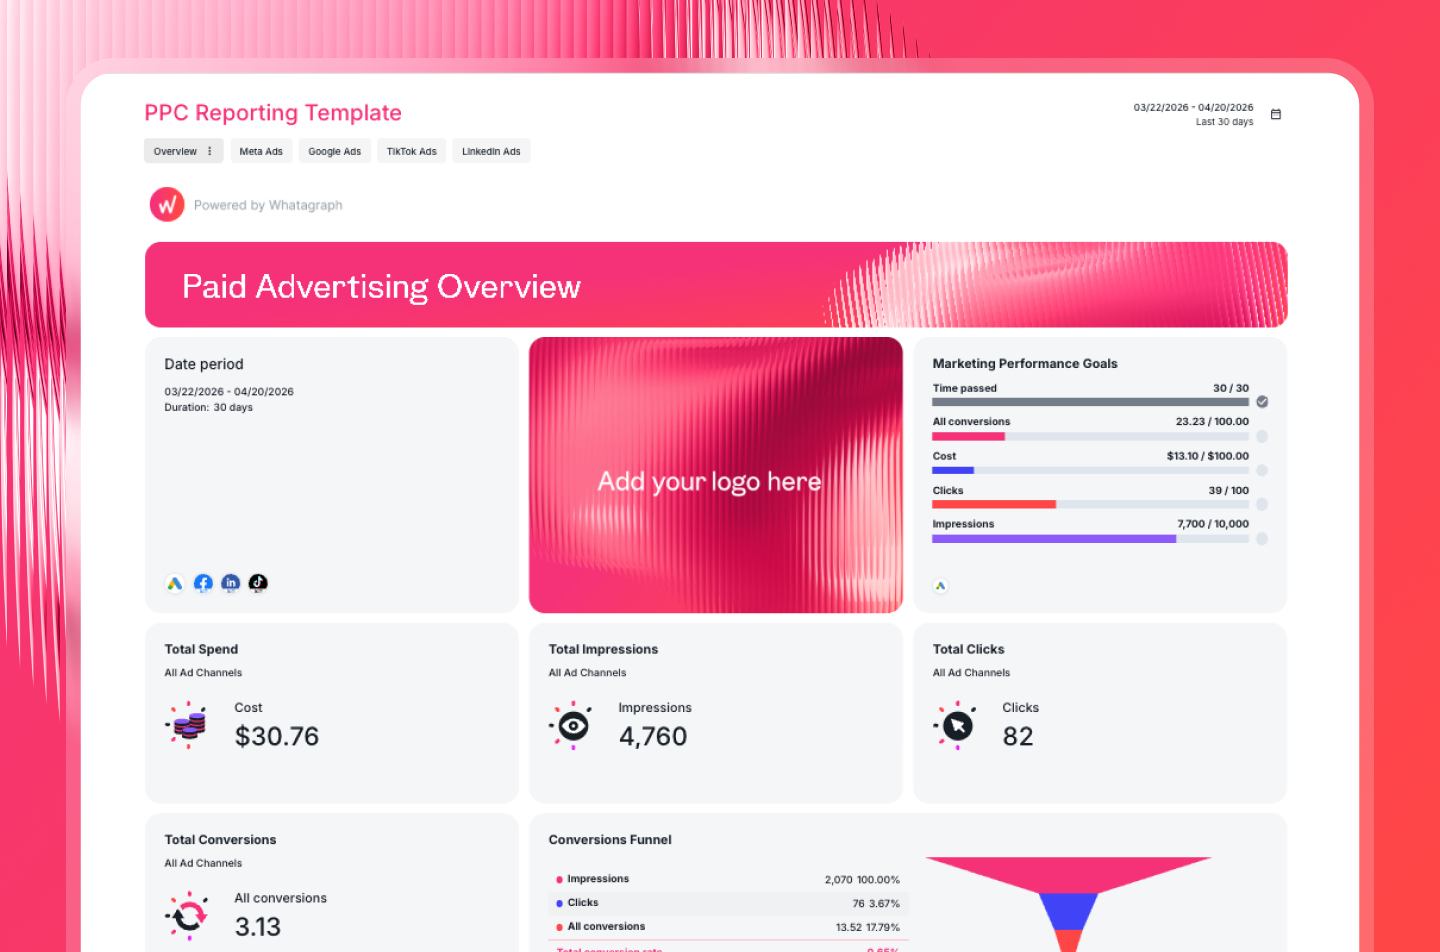
Overview tab
The overview is where the full picture lives. At the top, goal-tracking widgets show progress against targets for spend, conversions, clicks, and impressions, so you know immediately if you're on track.
Below that, aggregated KPI widgets display total spend, total impressions, total clicks, and total conversions across all channels. A daily conversions line chart and a conversions funnel (impressions → clicks → conversions) give you the top-level performance story.
Then comes the channel breakdown: a table showing spend, conversions, impressions, and clicks by channel (Google Ads, Meta, LinkedIn, TikTok).
The tab ends with an AI-generated summary and recommendations: what worked, what didn't, and what to do next.
2. Google Ads tab
This tab opens with a performance summary and goal widgets (clicks, cost, conversions), followed by headline KPIs: cost, impressions, clicks, average CPM, CTR, and average CPC.
Dual line charts track impressions vs. cost and clicks vs. spend over time. A Google Ads conversions widget and conversion funnel (impressions → active view → clicks) sit alongside a conversions trend chart.
The campaign and ad performance section includes:
- Campaign performance table: cost, conversions, impressions, CPM, clicks, CPC, and CTR per campaign
- Ad network performance table: breaking down results by Google Search, Display, and other networks
- Ad performance breakdown table: by individual ad creative
- Ad format performance table: comparing performance across format types
- Ad creative carousel: showing top-performing ads visually with impressions, clicks, conversions, and spend per creative
The tab closes with a keyword performance breakdown and landing page performance table, so you can see exactly which keywords and pages are driving conversions and where to optimize.
3. Meta Ads tab
This tab opens with headline KPIs - total spend, CPM, CPC, CTR - followed by dual line charts for impressions vs. spend and clicks vs. CTR over time.
- Ad placement performance table: spend, impressions, CPM, clicks, and CTR by publisher platform
- Campaign performance table: full metrics per campaign
- Ad performance carousel: top ads displayed with individual spend, impressions, and conversion metrics
- Video views section: total views, 2-second views, 6-second views, and completion rates at 25%, 50%, 75%, and 100%, plus an ads by video views carousel
- Demographics breakdown: conversions and clicks by age group and gender
4. LinkedIn Ads tab
This tab tracks spend, qualified leads, impressions, clicks, and follows - with goal widgets for each. Line charts show spend, clicks, and follows over time. A conversion funnel (impressions → engagements → follows) sits alongside a conversions over time chart.
- Top performing campaigns table: cost, impressions, landing page clicks, CTR, and conversions
- Top performing ads carousel: spend, impressions, engagements, follows, and external conversions per ad group
- Audience engagement breakdowns: by seniority, job title, job function, and country
5. TikTok Ads tab
This tab opens with headline KPIs - total cost, impressions, clicks, CTR, CPM, and CPC - followed by views vs. spend and clicks vs. spend trend charts.
An engagement breakdown section tracks profile visits, paid likes, paid comments, paid shares, paid follows - with trend charts for paid engagement and total engagement over time.
A dedicated reach breakdown covers reach, cost per 1,000 people reached, result rate, real-time result, and real-time cost per result - with line charts tracking each metric over time.
- Campaign performance breakdown table: cost, result, conversions, impressions, CPM, clicks, CPC, and CTR per campaign
- Ad performance carousel: top ads displayed visually with their individual metrics
- Ad type performance table: comparing results across different ad formats
- Video views section: total views, 2-second views, 6-second views, and completion breakpoints at 25%, 50%, 75%, and 100%, plus an ads by video views carousel
- Demographics breakdown: conversions and clicks by age group and gender, with pie charts for both
Want more PPC report examples? Check out this article: 10 best PPC reporting examples.
Which KPIs and metrics should you highlight on your PPC report?
The KPIs and metrics you report on will depend on what your campaign goals are. Here are the most common ones that we’ve seen Whatagraph users add to their reports:
Click-Through Rate (CTR):
This shows how compelling your ad is to your target audience. A high CTR means your ad copy and creative are resonating well.
Cost Per Click (CPC):
Essential for understanding how much you're paying for each click. Tracking CPC helps you keep campaign costs under control while balancing the quality of clicks.
Conversion Rate:
This is the percentage of clicks that result in conversions (form fills, purchases, etc.). It’s the best way to measure how well your ads and landing pages are performing together.
Return on Ad Spend (ROAS):
Shows how much revenue you’re generating for every dollar spent on PPC. A key metric for proving the overall value of your campaigns.
Add to Cart:
Especially relevant for eCommerce clients, tracking how many users add products to their cart after clicking on an ad gives deeper insight into purchase intent. It helps you assess the effectiveness of product page design and pricing.
View-Through Conversions:
This tracks users who saw your ad but didn’t immediately click, yet later converted through another channel. It’s great for understanding the full impact of your PPC efforts, especially in multi-touch customer journeys.
Time on Site/Session Duration:
A high click-through rate with low time on site can signal that your landing page isn’t matching the intent of your ads. Tracking session duration shows how engaged users are once they land on your site.
Engagement Rate (for Video Ads):
For campaigns with video content, measuring how long users watched a video or whether they completed it provides deeper insight into ad engagement beyond just clicks.
Assisted Conversions:
This metric tracks conversions where your PPC ad was part of the user’s path to purchase but wasn’t the final touchpoint. It helps show the value of PPC in a broader marketing funnel.
Scroll Depth:
For landing pages, tracking how far users scroll after clicking an ad can provide insight into whether your content is engaging enough to keep users interested. If they’re dropping off quickly, it could indicate that the page needs optimization.
First-Time vs. Returning Visitors:
Highlighting how many of your clicks come from new vs. returning users can provide insight into brand awareness efforts. For example, a higher percentage of returning visitors may indicate strong ad recall or interest from previous campaigns.
Top Performing Demographics or Geo-locations:
Break down your campaign performance by age, gender, or location to see where your ads are resonating most. This allows for more targeted optimization efforts.