Amazon Ads Integration
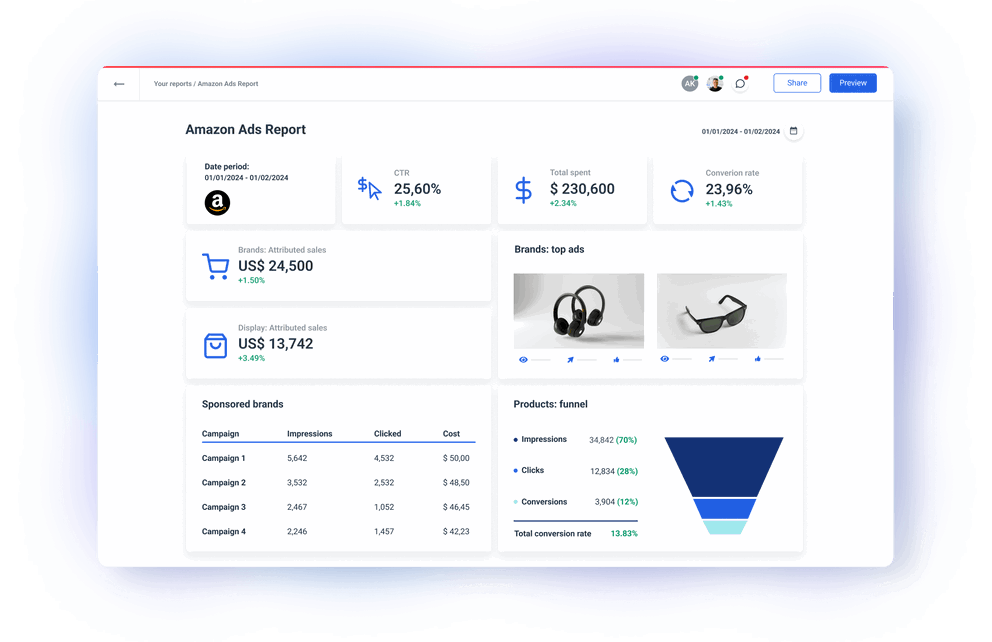
Combine the power of Whatagraph and your Amazon Ads data to analyze and share the performance of your Amazon Ads campaigns. A fully managed Amazon Ads integration pulls data directly from your Amazon Ads account to our stunning reports. Blend and organize data before visualization to present only the most impactful metrics. Automate report sharing and use the extra time more productively.


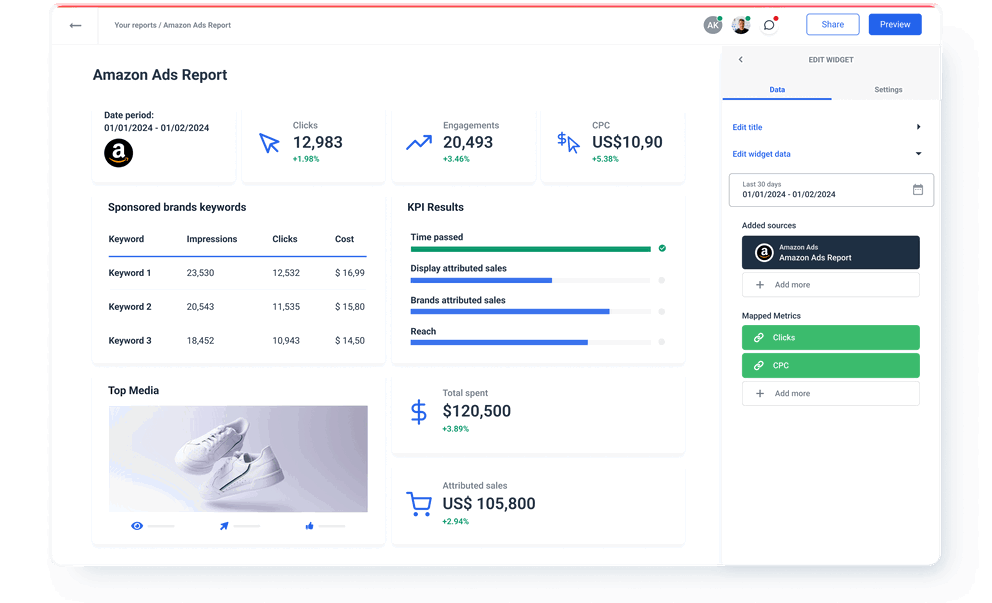
Add your Amazon Ads source and start managing your data

Pull your ads performance data directly using a no-code Amazon Ads connector
Amazon Ads metrics available instantly in Whatagraph
All
Amazon Ads Sponsored brands
19Amazon Ads Sponsored display
35Amazon Ads Sponsored products
26Search...

Impressions
Total ad impressions
Clicks
Cost
Conversions to ad click-throughs within 14 days
Sales within 14 days after ad click
Sales with same SKU within 14 days after ad click
Conversions within 14 days after ad click
Conversions within 30 days after ad click
Conversions with same SKU within 14 days after ad click
First-time orders within the brand
Percentage of total orders that are new-to-brand orders
New-to-brand orders relative to clicks
Total sales of new-to-brand orders
Percentage of total sales of new-to-brand orders
Number of units from first-time orders
Percentage of total units that are new-to-brand orders
Units sold within 14 days after ad click
Page views within 14 days after ad click
Sales within 24 hours after ad click
Sales within 7 days after ad click
Sales within 30 days after ad click
Sales with same SKU within 24 hours after ad click
Sales with same SKU within 7 days after ad click
Sales with same SKU within 30 days after ad click
Conversions within 24 hours after ad click
Conversions within 7 days after ad click
Conversions with same SKU within 24 hours after ad click
Conversions with same SKU within 7 days after ad click
Conversions with same SKU within 30 days after ad click
Units orders within 24h of ad click
Units orders within 7d of ad click
Units orders within 14d of ad click
Units orders within 30d of ad click
Number of other ASIN (SKU) units sold within 1 day
Number of other ASIN (SKU) units sold within 7 days
Number of other ASIN (SKU) units sold within 14 days
Number of other ASIN (SKU) units sold within 30 days
Sales for other ASIN (SKU) within 1 day
Sales for other ASIN (SKU) within 7 days
Sales for other ASIN (SKU) within 14 days
Sales for other ASIN (SKU) within 30 days
Page views within 14 days of ad click
Units sold within 14 days of ad click
ACOS
ROAS
Units with the same SKU ordered within 24 hours of ad click
Units with the same SKU ordered within 7 days of ad click
Units with the same SKU ordered within 14 days of ad click
Units with the same SKU ordered within 30 days of ad click
Kindle pages read within 14 days of ad click
Royalties of kindle pages read within 14 days of ad click
Purchases within 1 day after ad click
Purchases within 7 days after ad click
Purchases within 14 days after ad click
Purchases within 30 days after ad click
Purchases with same SKU within 24 hours after ad click
Purchases with same SKU within 7 days after ad click
Purchases with same SKU within 14 days after ad click
Purchases with same SKU within 30 days after ad click
Sales within 1 day of ad click
Sales within 7 days of ad click
Sales within 14 days of ad click
Sales within 30 days of ad click
Cost per click
Click through rate
Check out related integrations:


Explore marketing automation and custom report features


Frequently Asked Questions
What Amazon Ads metrics can I track with Whatagraph?
When running Amazon Ads campaigns, it's crucial to monitor key metrics to assess the performance of your ads and optimize your strategy. Our Amazon Ads integration allows you to pull all the metrics available from Amazon Ads API, but here are essential Amazon Ads metrics you should pay attention to:
Impressions: The total number of times your ad is displayed on Amazon.
Click-Through Rate (CTR): The percentage of users who click on your ad after seeing it. Calculated as (Clicks / Impressions) * 100.
Clicks: The total number of times users click on your ad.
Conversion Rate: The percentage of users who complete a desired action (e.g., make a purchase) after clicking on your ad. Calculated as (Conversions / Clicks) * 100.
Conversions: The total number of times users take the desired action, such as making a purchase.
Cost-Per-Click (CPC): The average cost you pay for each click on your ad.
Cost of Sale (COS) or Advertising Cost of Sale (ACoS): The ratio of advertising spend to sales. Calculated as (Ad Spend / Sales) * 100. A lower ACoS is generally more desirable.
Return on Ad Spend (ROAS): The ratio of revenue generated to advertising spend. Calculated as (Sales / Ad Spend).
Total Sales: The overall sales generated through your Amazon Ads campaigns.
Attributed Sales: The sales directly attributed to your advertising efforts.
Average Cost of Sale (ACoS) by SKU: ACoS calculated on a per-SKU basis to evaluate the performance of individual products.
Regularly analyze these metrics to make informed decisions about your Amazon Ads strategy. Adjust your campaigns, bids, and keywords based on the performance data to optimize for your specific goals, whether it's maximizing sales, minimizing ACoS, or achieving other business objectives.
What is the advantage of Whatagraph over native Amazon Ads reports?
For one, pulling data from Amazon Ads natively is not as user-friendly. Since the Amazon Ads API is asynchronous, there are three calls you need to make to create a report: 1) Request a report, 2) Wait for the report to generate, 3) Download the report.
A similar process is required to create reports in Amazon DSP (Demand Side Platform) as well.
All in all, to make the report call, you need some coding and data knowledge, and the process can take up to 3 hours!
Whatagraph can give you near real-time insights in just a few clicks.
Once you connect your Amazon Ads account, you can instantly pull your data and populates already-loaded widgets.
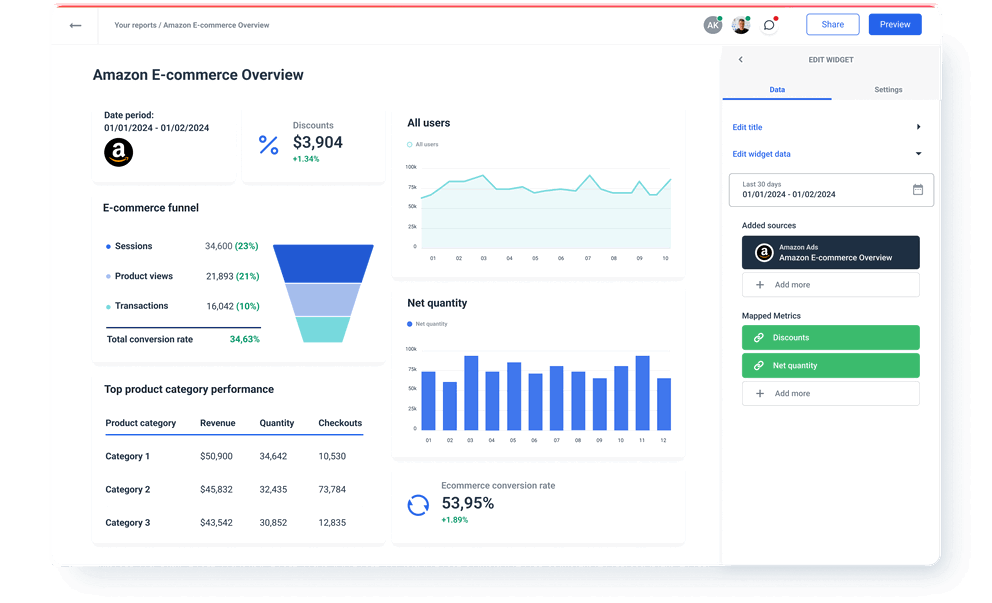
Also, you can just as effortlessly connect other data sources and get cross-channel insights. Apart from Amazon Ads connector, Whatagraph has fully managed integrations with 45 more social media, PPC, web analytics, e-commerce, email marketing apps, search engine optimization, and CRM platforms.
The ability to organize the connected data and visualize it in the same environment, as well as automate sharing, makes Whatagraph a one-stop marketing data platform for agencies and in-house teams.
Is Whatagraph easy to master?
Yes, Whatagraph is easy to master because we built it to be user-friendly even for teams with no prior data and technical experience. Once you sign up for a free trial, you get a personalized onboarding call where your account managers show you how to connect data, organize it in the same platform, visualize, and finally automate the report sharing.
Effortlessly create reports and dashboards


What others think about Whatagraph
I made a switch from GDS and Sheets for reporting to Whatagraph, and I am saving literal hours each week on performance report creation. Our small firm actually managed to onboard 2 new clients as a result of all the time we saved on managing data and reporting. The customer service is also really helpful and easy to reach.

Capterra verified review by
Mindaugas S., Marketing Consultant
Having active customer support to help fix any issues was a big contributor, but we also really liked the ability to save templates and connect sources to multiple charts/widgets at once without having to edit them individually. And having the grid layout is much easier to stay consistent with than the free form setup that Data Studio has.

Capterra verified review by
Nico T., Media Planner
The system has standard templates that are easy and fast to use. Also you can build your own report with lightning speed. It is very easy to use, has a lot of integration, and let get started very fast.

Capterra verified review by
Rasmus Bernt K., External Senior Management Consultant
We love Whatagraph - we would definitely recommend and our account manager is great! I love how easy this tool is to use, everyone on the team finds it much more user-friendly than other dashboards. Integration was easy, we sent some example reports to the team who duplicated these for us. We literally had to log in and send it to our clients!

Capterra verified review by
Stephanie S., Digital Director
We are showing our clients the work that we're doing for them and this is incredibly important for our clients ROI. They want to see results and having a tool like Whatagraph that can show data from virtually every source we use is hugely important.

Capterra verified review by
John S., SEO Strategist
The tool is easy to use; you do not need to have development resources. Even my junior project managers are capable of making campaign reports in minutes. There are a lot of pre-made templates you can use as well as many pre-made widgets.

Capterra verified review by
Erman E., Marketing Specialist
Really easy to connect data sources within the tool. The library of report templates has been helpful. The customer support team has been responsive to all of our needs. Our team enjoys the simplicity of setting up the reports and how the data is presented.

Capterra verified review by
Brent N., Director of Operations
Easy to create really beautiful graphs and reports which can help other team members to understand the most important takeaways. I especially like the automated report function, so I don't have to check on the same thing repeatedly.

Capterra verified review by
Orsolya S., Online Marketing Manager