


TL:DR
AgencyAnalytics is a reporting and dashboard platform designed for marketing agencies to track performance across multiple clients and channels in one place.
Who it’s best for:
Boutique marketing agencies focused primarily on SEO/PPC that don’t need deep customization or advanced data workflows.
Key features at a glance:
| Feature | AgencyAnalytics |
| Integrations | 80+ native integrations, Google sheets integration available |
| Stable connections | Prone to disconnects and delays |
| Ease of use | Easy for basic reporting |
| Data organization | Basic data aggregation, custom metrics, and widget-level available |
| Customizable reports | Limited customization |
| Report sharing & automation | Email sharing, white-label PDFs |
| Security | MFA, Enterprise SSO, Granular user access and customization |
Pros ✅
- Simple and fast setup
- SEO tools built-in
- White-label reports
- Affordable starter plans
Cons ❌
- Unstable connections that frequently break
- Lack of deeper data filtering and blending
- Rigid report layouts and limited customization
- Can’t scale well with multiple clients
Why You Can Trust This Review
There are so many automated reporting tools shouting for your attention, it’s easy to get overwhelmed just trying to figure out which one is actually the best fit for how you work.
Our goal here is simple: cut through the noise and give you a clear, honest review you can actually use.
At Whatagraph, we live and breathe marketing data and reporting every day. So, we understand what agencies really need from their software.
Here’s how we approach reviews like this one:
- Looking closely at features: How does it work day-to-day? We want to see how features perform in practice, not just how they sound on a sales page.
- Focus on critical agency requirements: Our evaluation is systematically centered on the criteria we know are key for successful agency operations. This includes integration stability and breadth, the depth of customization and white-labeling, automation reliability, overall usability, and the quality of customer support.
- Being real about strengths and limits: We’ll tell you where a tool shines. But we’ll also point out, factually, where it might not quite hit the mark for everyone. We don’t call these 'flaws'—it's more about finding the right match for you.
- Hearing from real users: We pay attention to what actual users are saying out there in forums, review sites, and communities.
We want you to walk away feeling informed and ready to make a smart, confident decision that benefits your team and your clients.
AgencyAnalytics Pricing
Alright, let's talk investment. AgencyAnalytics' pricing model is tiered, primarily based on the number of clients you manage under the platform.
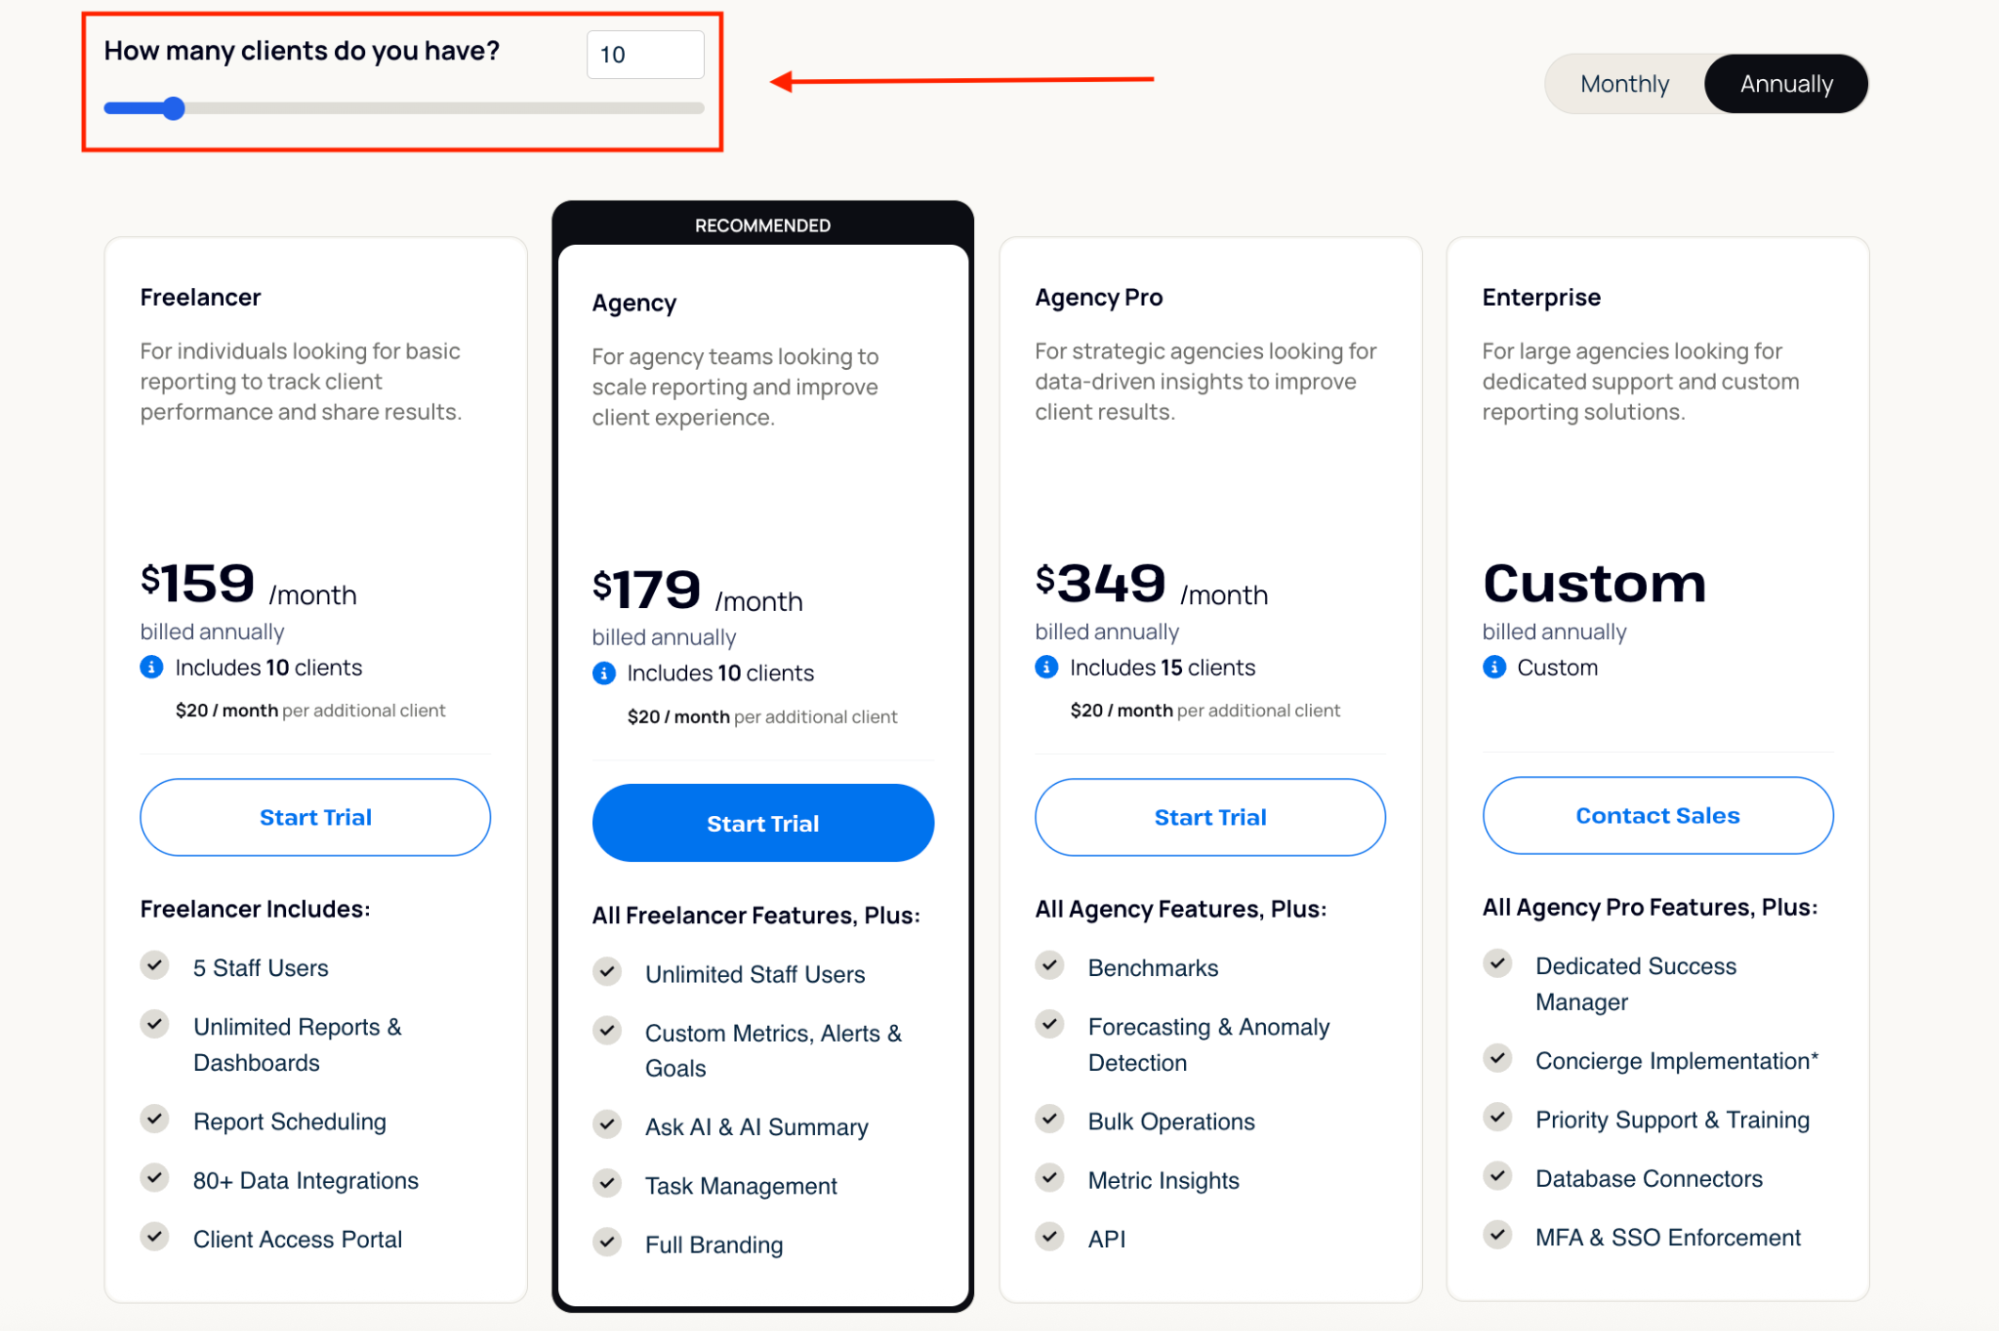
I’ve adjusted the slider on their pricing page to 10 clients, because that’s about the point where a growing agency or team usually finds themselves.
And here’s the breakdown as of September 2025:
| Plan | Base Price (Billed Annually) | Included Clients | Cost Per Additional Client | What’s Included |
| Freelancer | $159/month | 10 | $20/month |
|
| Agency | $179/month | 10 | $20/month |
|
| Agency Pro | $349/month | 15 | $20/month |
|
| Enterprise | Custom | Custom | Custom |
|
Want a deeper dive? Check out this guide to AgencyAnalytics pricing.
Heads-up: The per-client surcharge is now $20/month across all tiers, up from $10/month in May 2025. So even though the slider looks neat at 10 clients, the moment you grow beyond that, your costs start climbing.
They do offer a 14-day free trial, which is a good way for you to get a feel for the platform before committing.
Key takeaways for your budget
- Your main cost driver is the number of clients you need reports for: The base price looks fine at 10 clients, until you add extras. At 20 clients on the Agency plan: $179 + (10 × $20) = $379/month (billed annually).
- The “Freelancer plan” is only $59 if you manage ≤5 clients: At 6 clients, it jumps to $79/month. At 7 clients, it’s $99/month. And it keeps climbing from there. Meanwhile, the other plans stay flat until you hit their “included clients” cap.
That means the barrier to entry is surprisingly high for individuals and small agencies—ironically, the very audience this plan is supposed to serve.
Real User Reviews: What are Customers Saying About AgencyAnalytics?
We analyzed recent reviews and discussions from independent platforms like G2, Capterra, SoftwareAdvice, and relevant Reddit communities (like r/DigitalMarketing) to identify the major themes—both positive and negative—in user feedback.
AgencyAnalytics pros: What users love
✅ Ease of use and setup
A major recurring point is how simple and intuitive the platform is to get started with. Users mention easy setup, straightforward integrations, intuitive dashboards, and smooth daily operations.
✅ Excellent and responsive customer support
This stands out strongly across multiple reviews. Users describe the support team as "incredible," "quick to respond," even at odd hours, and proactive in logging feature requests.
Rakan W. on G2 gives it "500 out of 5 stars."
✅ Major workflow efficiency and time savings
Users like Adam C. feel that AgencyAnalytics tackles the "chaos" of juggling multiple digital marketing tasks. The core benefit identified is centralization—having data from various platforms (SEO, ads, etc.) accessible in “one place.”
✅ Improved client communication and professionalism
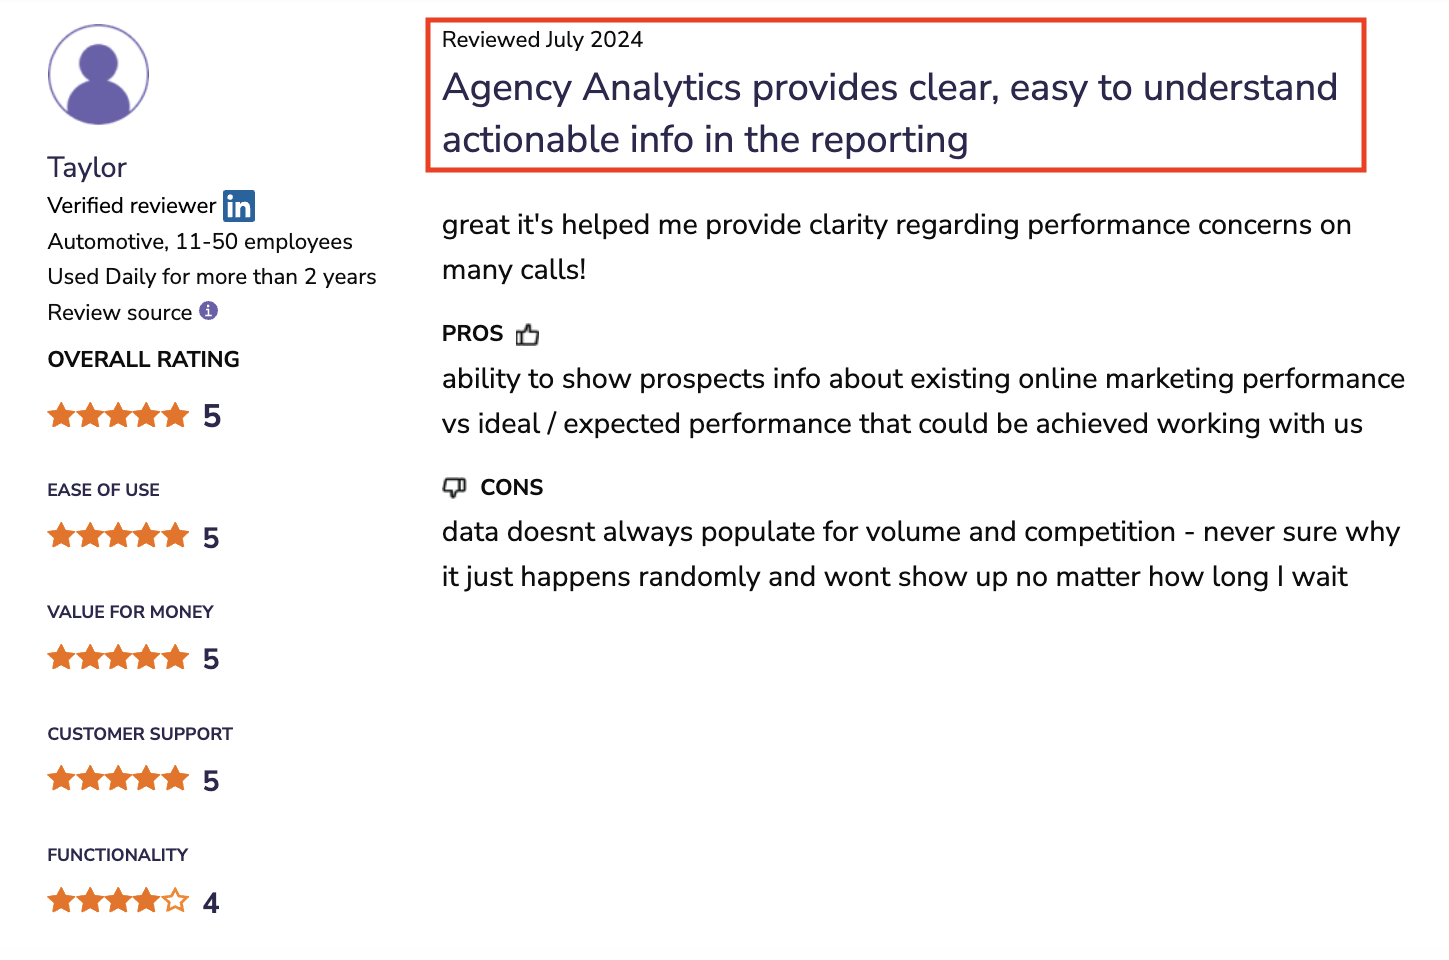
A key value proposition highlighted is the ability to generate reports that are not only data-rich but also clear, professional-looking, and easy for clients to understand. This clarity extends to addressing specific client concerns, with one user finding it helpful for providing "clarity regarding performance concerns on many calls."
Agency Analytics cons: Where users get frustrated
❌ Unstable connections and inaccurate data on reports
The biggest disadvantage of AgencyAnalytics is that their integrations are unstable—they break often or are slow at bringing in data from source platforms. This means the data on your reports are either late or inaccurate.
For example, one former AgencyAnalytics user told us it can take 2–3 days for their reports to fetch data, which is too slow for their daily reporting needs. Even then, the data isn’t always up-to-date by the time reports need to go out.
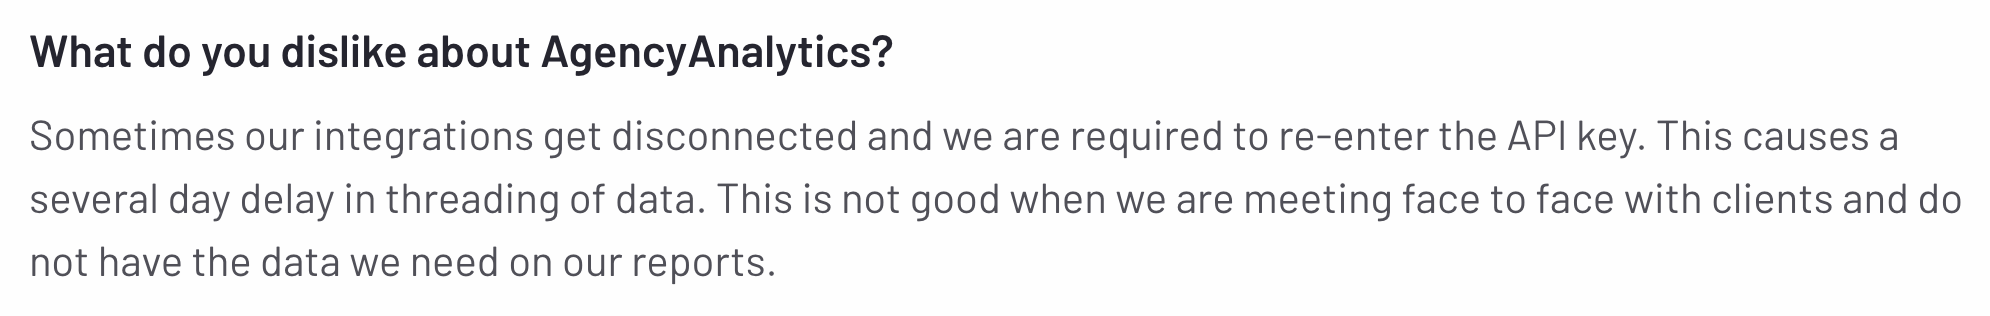
Also, this user on G2.com reports that when connections break, they need to manually reconnect them which causes a “several day delay in threading data”.
This means with AgencyAnalytics, your “automated reports” are not really automatic. You’ll need to manually check whether the integrations are working properly and if the data on your reports are accurate before they can be sent to your clients.
And if you have dozens of clients? This can become a “part-time” job on its own.
❌ Limited customization and flexibility (beyond basics)
This isn't just a minor hiccup; users express significant frustration with the inability to tailor reports and dashboards beyond the standard templates on AgencyAnalytics.
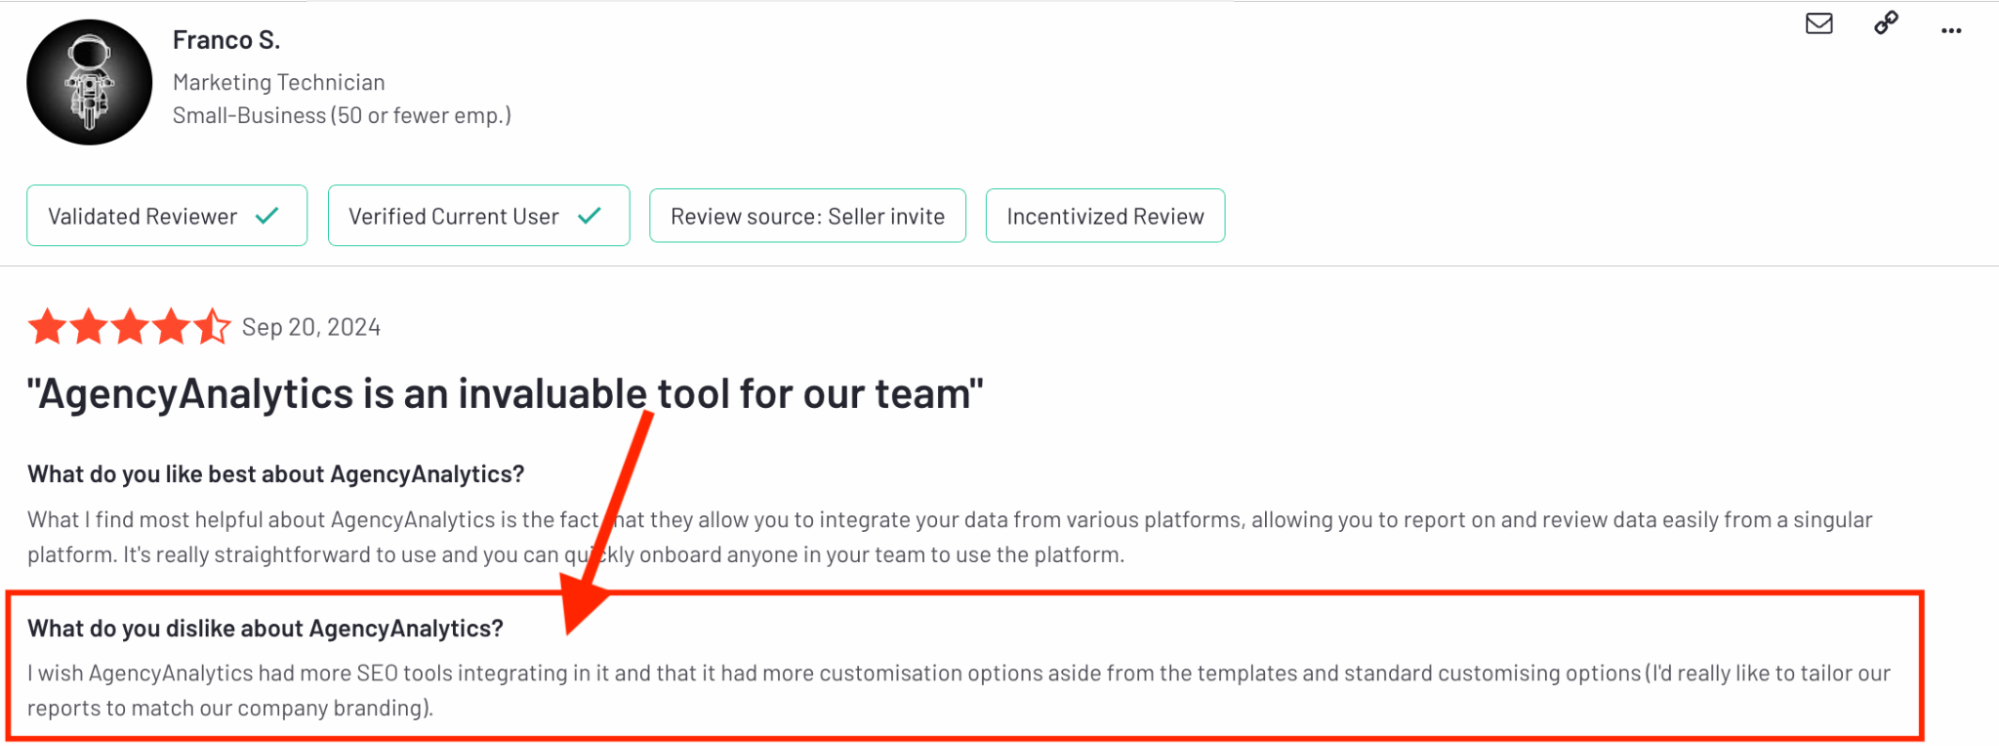
For instance, Franco S. on G2.com wishes they could “tailor their reports to match their company branding.” But this isn’t available on the Freelancer plan—you’ll need to opt for more expensive plans like Agency and Agency Pro.
If highly bespoke or uniquely branded reports are important for your client relationships, this limitation is critical to consider.
❌ Lack of depth in data analysis and insight
Agencies looking to perform sophisticated analysis often hit a wall. Users specifically cite the inability to create custom metrics that require advanced filtering or segmentation.
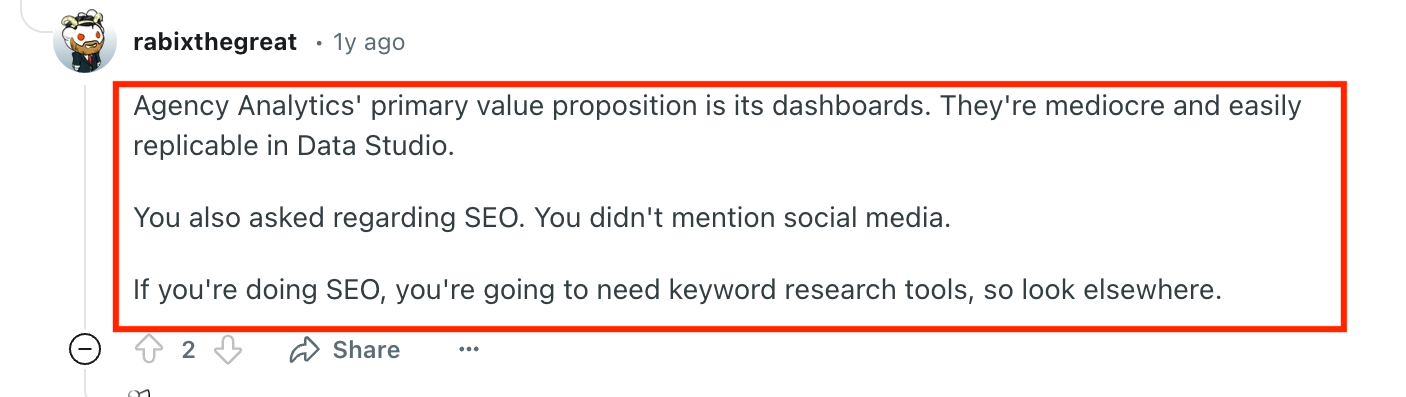
The dashboards themselves have been described as "mediocre" and potentially no better than what could be built for free in tools like Looker Studio, questioning the core value proposition if deep analysis is needed.
 ❌ Problematic pricing structure and perceived value
This is a big one. Agencies need predictable and fair pricing, but users have reported finding AgencyAnalytics' pricing "unclear."
More specifically, a detailed analysis by Adam R. on G2 suggests the upgrade path between tiers (e.g., Freelancer to Agency) lacks proportional value, meaning you might pay significantly more per client or per feature as you scale, unlike typical SaaS models.
This structure could make it economically challenging to grow your agency on the platform.
❌ Inconsistent or unsatisfactory customer support and service
While some users praise support, a significant number report negative experiences, suggesting inconsistency.
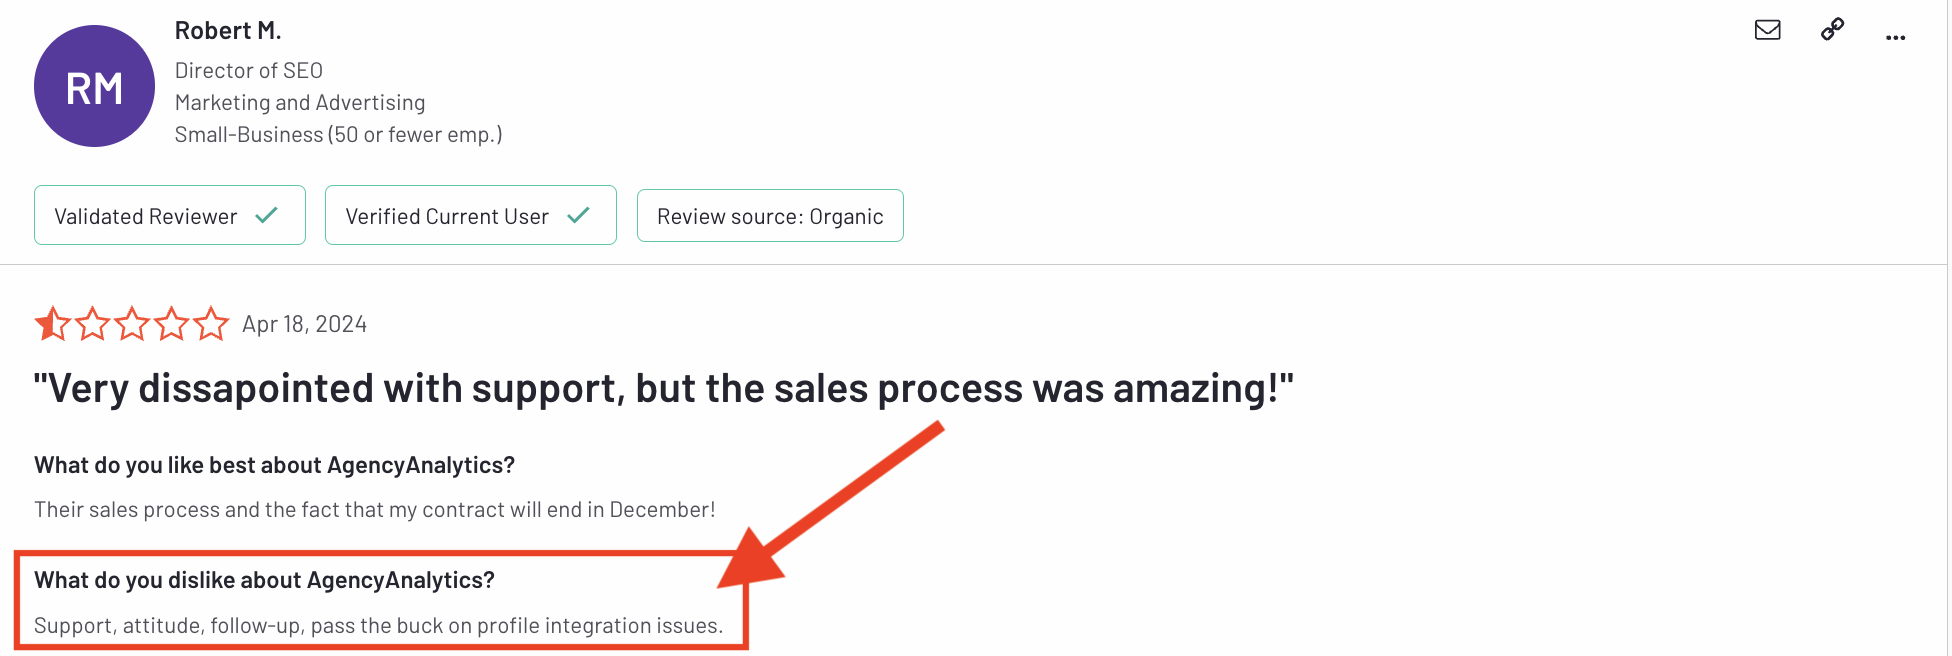
Criticisms include slow response times ("almost an hour"), poor attitude, lack of follow-up, and a tendency to deflect responsibility ("pass the buck"), especially regarding technical issues like problematic integrations.
Robert M., Director of SEO, says what he likes best about AgencyAnalytics is that his “contract will end in December!”
Another verified user says that although he’s satisfied with the customer support, the “lack of contact with client success manager is bad.”
The Whatagraph advantage: You never have to wait in the support void. Every plan comes with live chat that replies in under 4 minutes, and when you’re on “Boost” or “Max,” you also get a dedicated Customer Success Manager. That means fast fixes when you need them—and strategic guidance once you’re ready to scale. That's partnership, built-in.
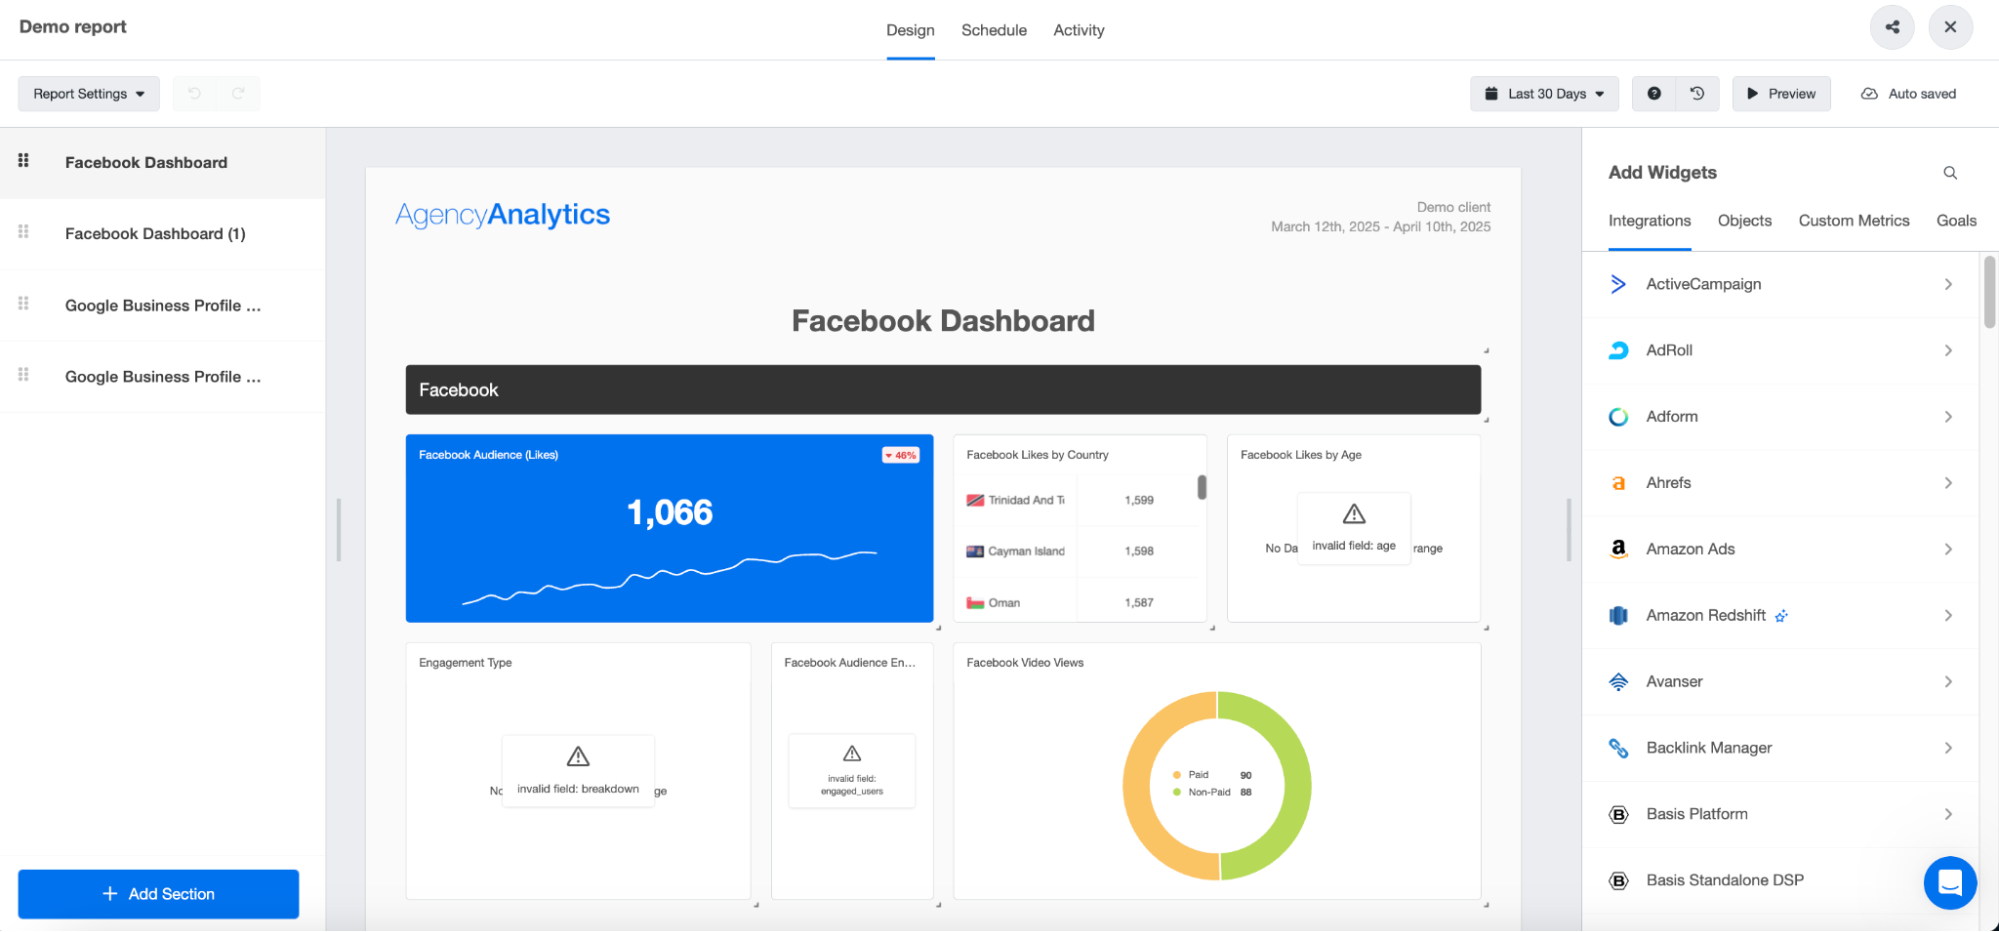
AgencyAnalytics Ease of Use
When you're evaluating reporting software, "ease of use" is often high on the list.
But what does that actually mean in practice for your agency day-to-day? Let's break down AgencyAnalytics in this area.
Are there ready-to-use templates and drag-and-drop features?
Yes, AgencyAnalytics offers ready-made templates to get you started quickly, and it features a drag-and-drop interface for adding widgets to your reports and dashboards.
This definitely contributes to its reputation for being easy to learn initially. If you need standard reports without heavy customization, you can get them built relatively fast.
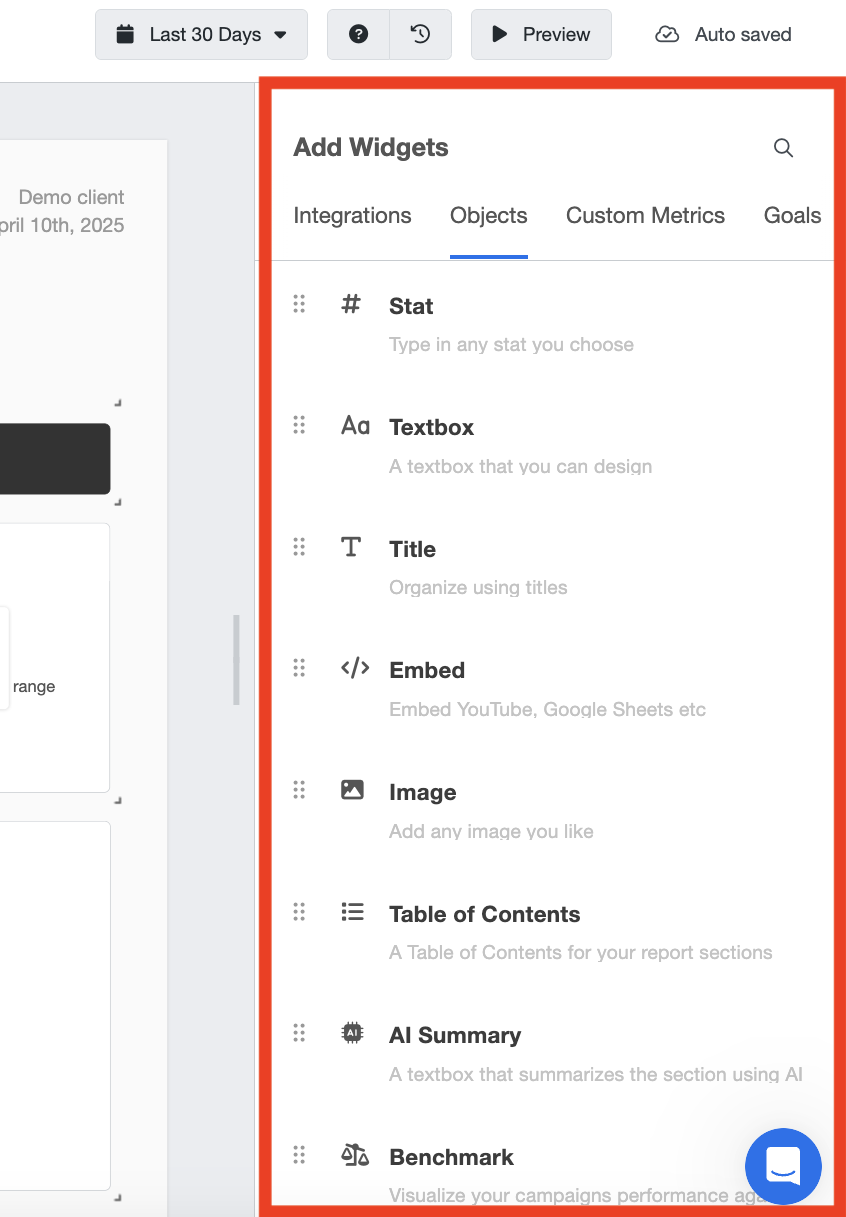
However, note that they only have about eight widget options for visualizing data.
Want a deeper dive? Check out this guide to AgencyAnalytics dashboards.
With Whatagraph IQ though, you don’t even need to worry about templates or drag-and-drop widgets (although we still have them).
You can just ask AI to create a full-on report—with widgets, metrics, and filters you need—in seconds.
Want to add a widget or edit an existing one? Just type in your prompt and let AI do it for you.
You can also ask AI to create separate tabs within a single report for different channels, locations, or brands, without making your readers scroll through a 10-page report.
That’s not all. To style your reports, you can simply upload a screenshot of your brandbook or type in a prompt and—guess what—we’ll automatically detect and apply the fonts and logos to your reports instantly.
You can still fine-tune the details yourself and once you’re satisfied, save the style as a “Global theme” and re-use it across all your existing and new reports.
Marketers like yourself are loving this about Whatagraph. Ben Goodey, Founder of Spicy Margarita, says “Looooove how quick this makes things.”
Start free today with Whatagraph.
Is everything housed in one reporting environment?
The interface generally keeps you within a reasonably unified environment for basic tasks like viewing dashboards or building simple reports using templates.
However, if you need to deeply configure specific integration settings or manage complex client setups, you might find yourself navigating different sections.
How easy and fast is editing dozens of reports?
This is where a major ease-of-use challenge arises, especially as your agency scales.
AgencyAnalytics lacks master templates or linked reporting functionality. This means if you need to make a change—add a new KPI, update a metric's definition, adjust a date range—across reports for 10, 20, or 50+ clients, you have to open and edit each report individually.
This manual, repetitive process eats up significant time and increases the risk of errors.
(Side note: “Bulk operations” is available on the most expensive AgencyAnalytics pricing plan, but this doesn’t actually include editing the dashboards in bulk.)
Whatagraph, for example, addresses this specific pain point directly with features like linked report templates. You only need to edit the “Master” report once, and the changes will automatically sync across all the other linked reports. This saves you massive time and energy.
AgencyAnalytics is easy enough for basic reporting. But if you need speed, more pre-made templates and widgets, and flexibility—it can be limited.
AgencyAnalytics Integrations
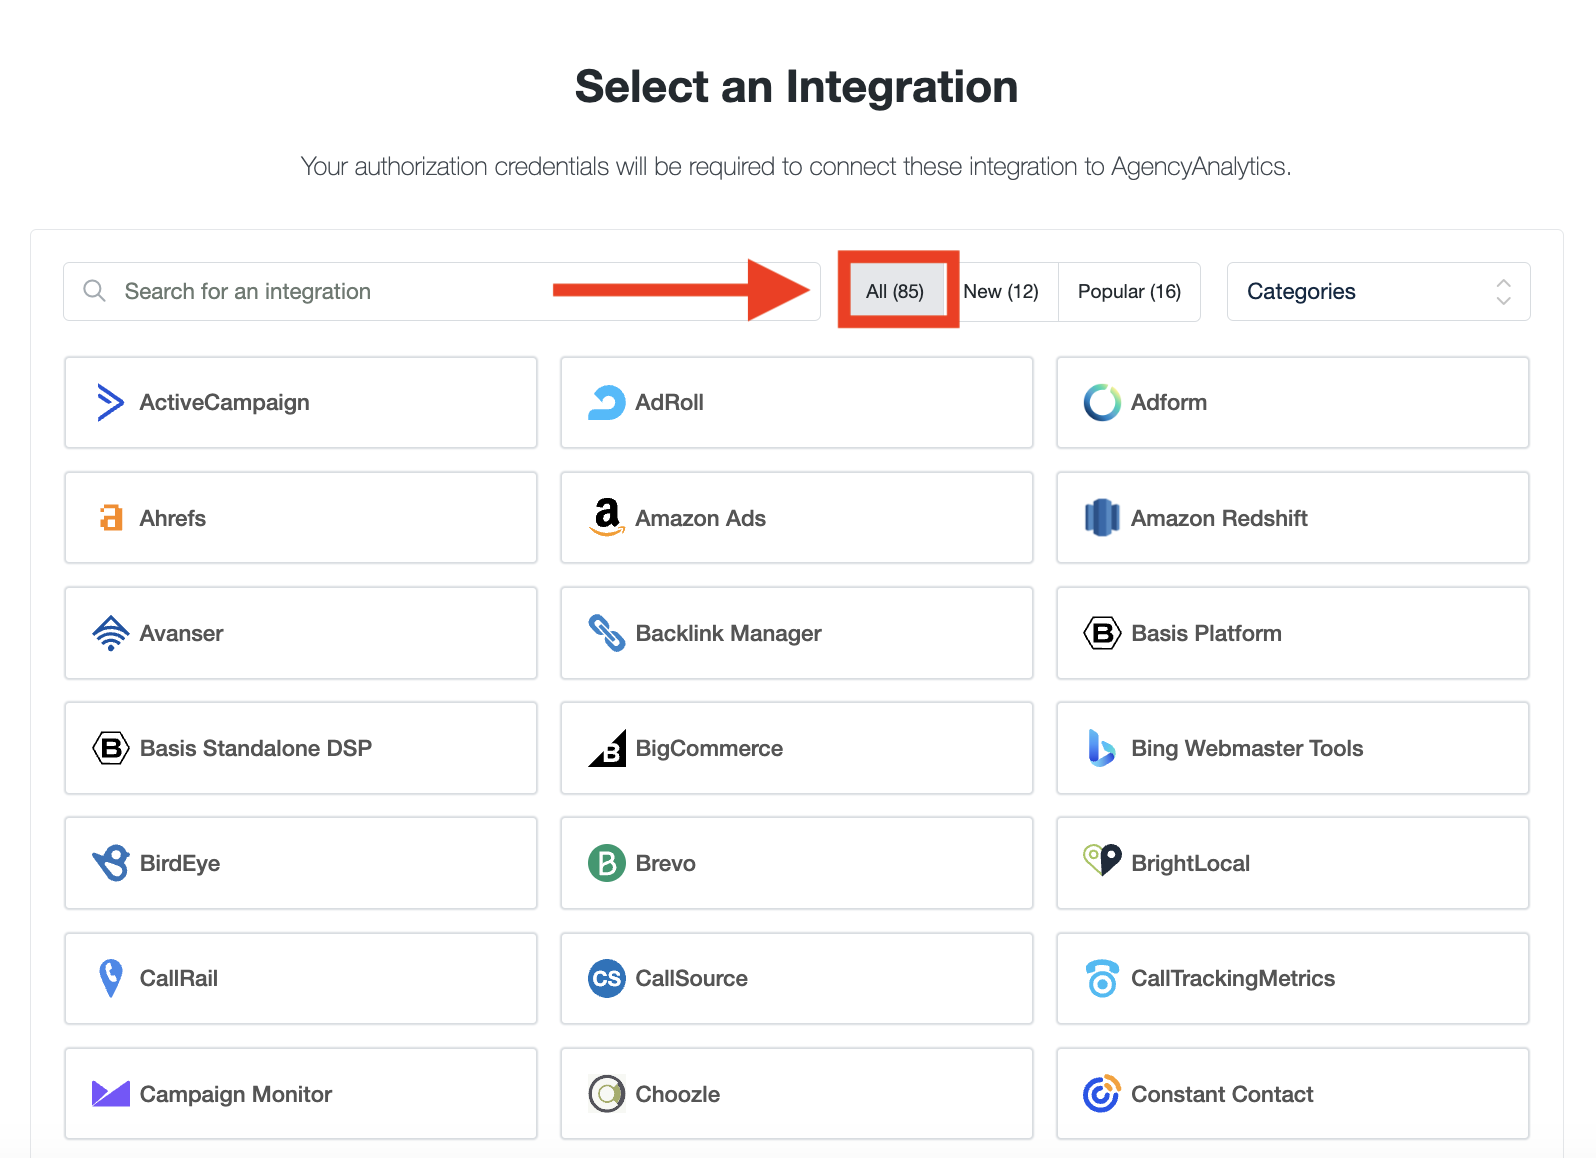
AgencyAnalytics offers 85 out-of-the-box integrations covering essential agency categories like SEO, PPC, social media, email, and CRM. For a full breakdown of what they are, check out this article on AgencyAnalytics integrations.
But it’s important to note that more niche integrations, like SE Ranking for SEO, Reddit Ads, and AppsFlyer are not available. (But they are available on Whatagraph.)
Can you connect custom APIs or upload offline data?
AgencyAnalytics does offer an API, but it’s not meant for pulling in third-party data according to this documentation. Instead, it’s more for internal platform automation like syncing your CRM with client dashboards or bulk-generating reports.
You can, however, upload offline data using their Google Sheets integration.
How reliable are these connections day-to-day?
This is arguably the most critical question, and user feedback raises red flags. While many integrations exist, their stability seems inconsistent.
Are you prepared for connections frequently breaking? Users cite the "frequency at which integrations require reconnections" as a major annoyance, forcing your team into constant troubleshooting.
Does the data arrive on time? Maybe not. Users report integrations "occasionally broken," causing missed data, and more alarmingly, potentially significant delays (2-3 days) in data populating reports, rendering them outdated.
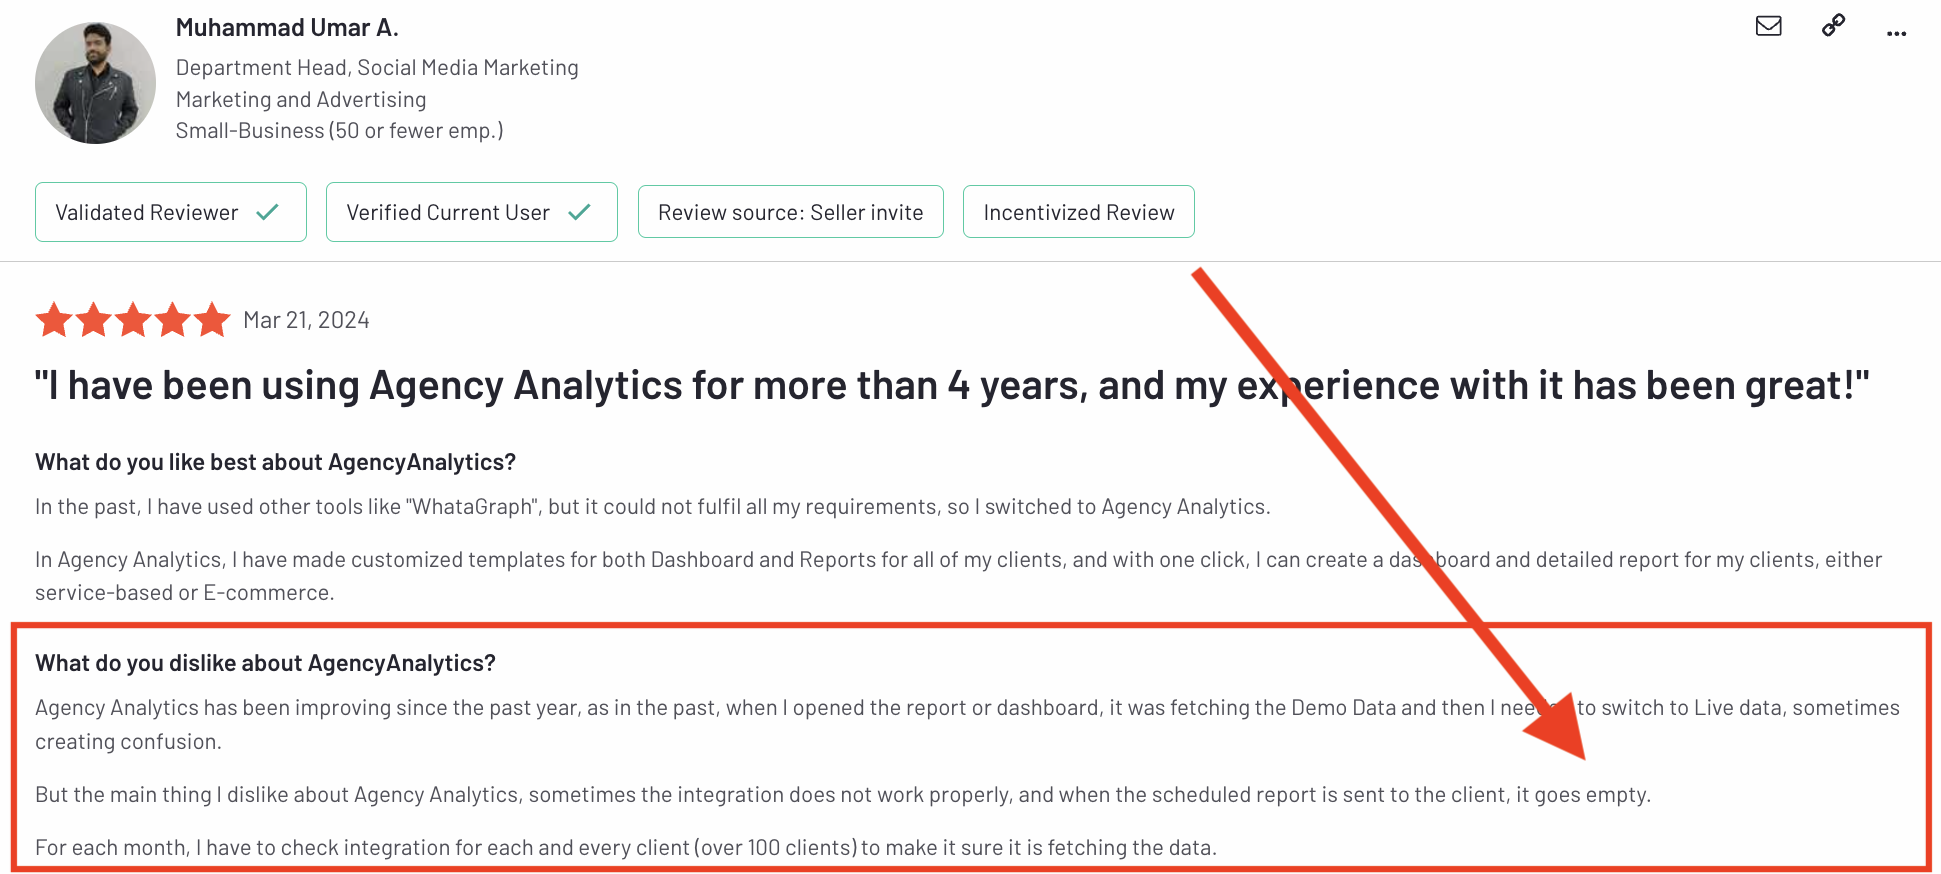
But more importantly, broken integrations can lead to your reputation taking a hit. For example, Muhammad Umar A. says on G2 that “sometimes the integration does not work properly, and when the scheduled report is sent to the client, it goes empty.”
 At Whatagraph, reliability is our North Star. One of our customers says:
We don’t have any connection issues on Whatagraph at all. We just connected the platforms once, and that was it. It's also very quick when loading the data.
Lots of integrations listed, but expect connection drops, multi-day data delays, inconsistent access, and major headaches getting custom or bulk data in. Reliability is a real concern.
Data Organization, Filtering, and Blending on AgencyAnalytics
Once your data flows into AgencyAnalytics, how can you organize and clean it so your reports will show an accurate and holistic view of performance? Let’s take a look.
Can you blend data or create custom metrics and dimensions?
AgencyAnalytics offer a form of data blending called “Data aggregation” on the most expensive plan—Agency Pro. This is not available on the Freelancer and Agency tiers.
“Data aggregation” means you can view and compare performance across multiple integrations and clients, all from one table.
Using the Client table in list view, you’ll see combined metrics if a client has multiple accounts under one integration—for example, if they’re running several Google Ads or Facebook Ads accounts.
From there, you can filter by specific clients or client groups, select up to 25 metrics to display, and even enable historical comparisons to see performance changes over time.
There’s also an optional “Health Score” you can add, which benchmarks client performance.
That said, you won’t be able to aggregate data from ALL your data sources. It’s only available for:
- Facebook Ads
- Google Analytics 4
- Google Ads
- Google Business Profile
- Google Search Console
- LinkedIn Ads
- Microsoft Ads
- X (Twitter) Ads
Apart from “Data aggregation”, AgencyAnalytics also allows you to create custom metrics where you can combine up to 15 metrics together. This is useful for creating metrics like:
- Total ad spend
- ROAS
- Average cost per lead
This is great, but on Whatagraph, you can just simply ask us to create custom dimensions for you, and we'll do it for you. No need to manually figure out codes or formulas.
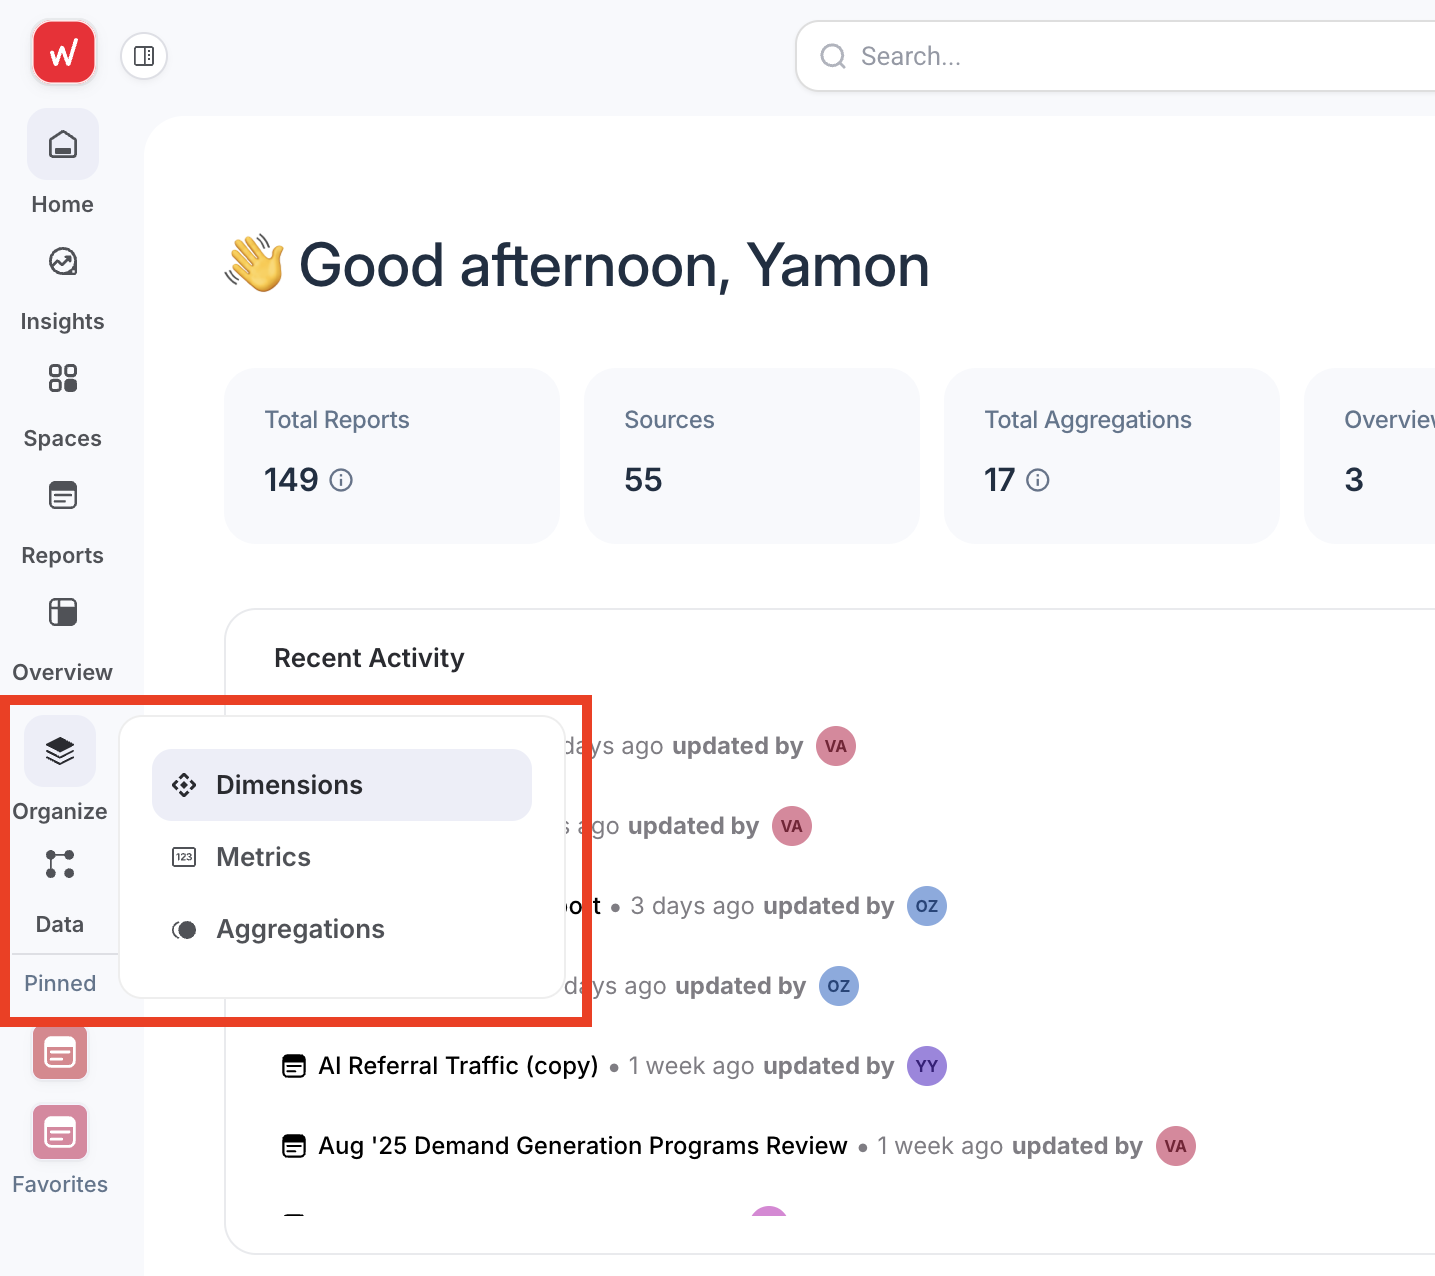
Plus, you'll get a dedicated space to find all your custom dimensions, metrics, and aggregations like so:
What kind of filtering can you do in AgencyAnalytics?
AgencyAnalytics gives you a variety of filters to help you narrow down the data shown in your dashboards and reports—but the experience isn’t totally seamless.
Here’s what you can do:
- Filter by campaign specifics: For integrations like Google Ads, you can filter by campaign, campaign type (e.g., Search vs. Display), ad status, and network. You can also choose to include or exclude data with zero conversions or impressions.
- Toggle PPC markup visibility: Handy if you’re including or hiding markup in client-facing reports.
- Apply multiple filters at once: You can combine filters to drill down into very specific segments of data.
- Use “contains” filters for advanced targeting: Some integrations let you filter using keyword-based logic (e.g., campaign names that contain a specific word).
- Integration-specific filters: Not all filters are available across all data sources. For example, Facebook Ads includes attribution filters, while Google Analytics offers filters around goals and segments
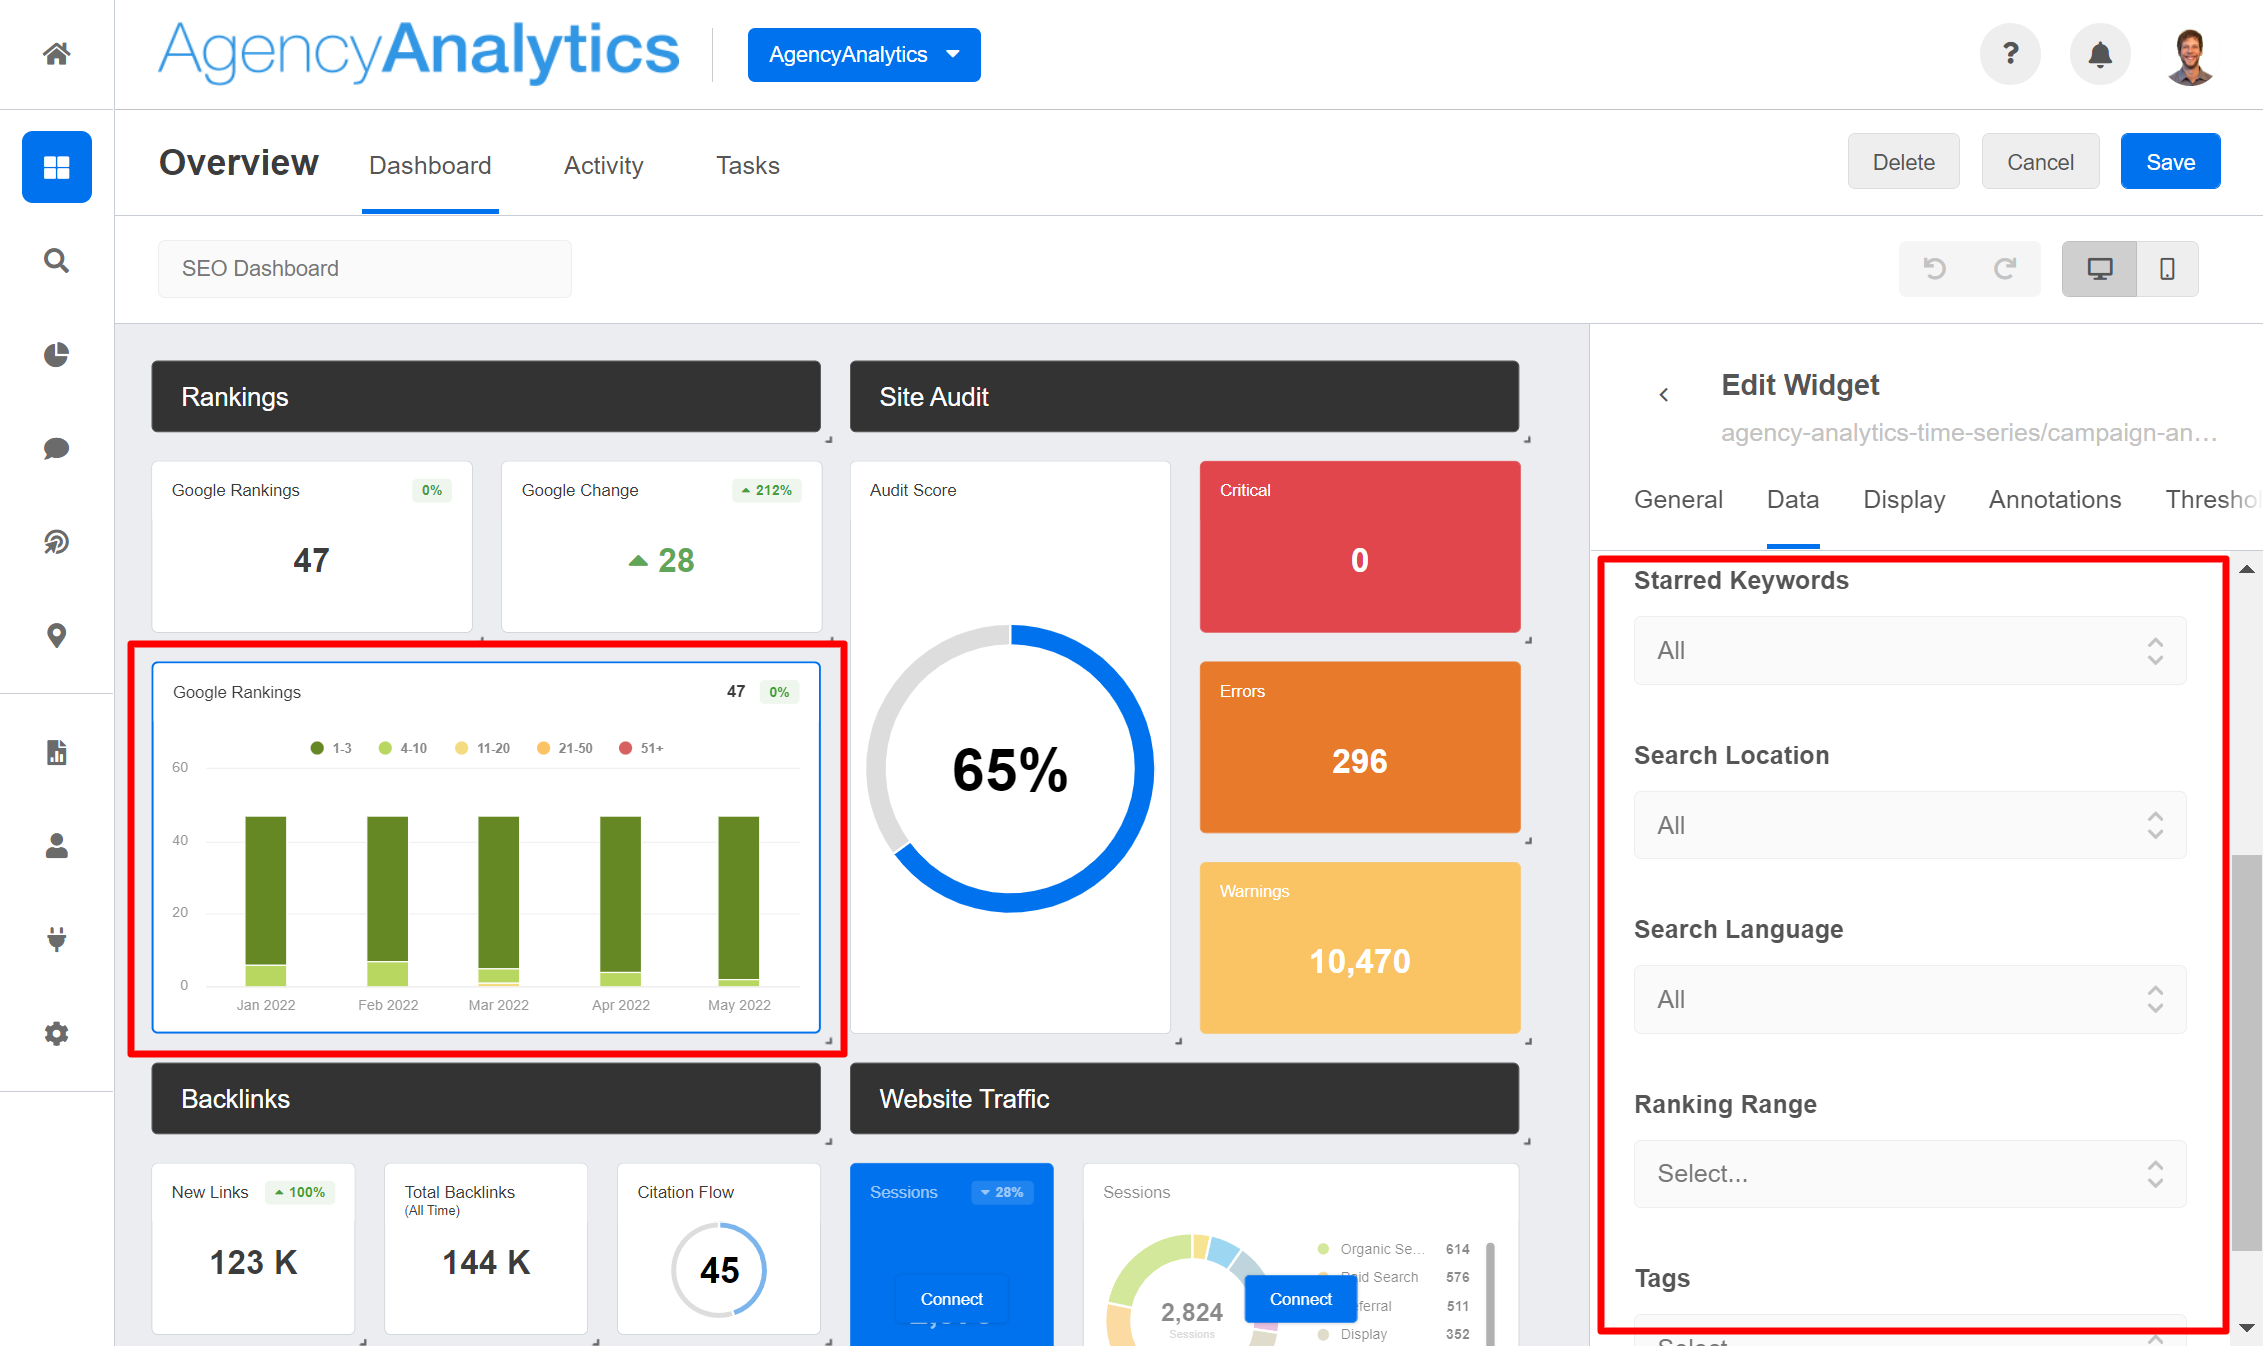
Here's an example of the filters you will see in a Rank Tracker widget:
But there are limitations to watch out for:
- Filters don’t persist: When you leave or reload a dashboard, your filters reset. Every time you revisit, you’ll be starting from scratch unless you add it to a report.
- Saving filtered views requires extra steps: To lock in a filtered widget, you need to click “Add to Report.” This saves that exact view (filters included) into your automated report.
- No global filtering across clients: Filters apply per widget or per integration—you can’t apply a filter that spans across all clients or dashboards.
In contrast, Whatagraph makes filters global, interactive, and AI-assisted. Here’s a quick rundown:
- Source filters (global): Apply a filter once, and it cascades across the whole report. Want to view only “Tier 1 countries” or “Retargeting campaigns”? One click, and the entire dashboard updates.
- Widget filters (local): Layer widget-specific filters on top of global ones for fine-grained analysis.
- Filter control widget: Add an interactive filter panel right inside client reports. Clients can slice the data by date, device, campaign, or region, without you duplicating reports.
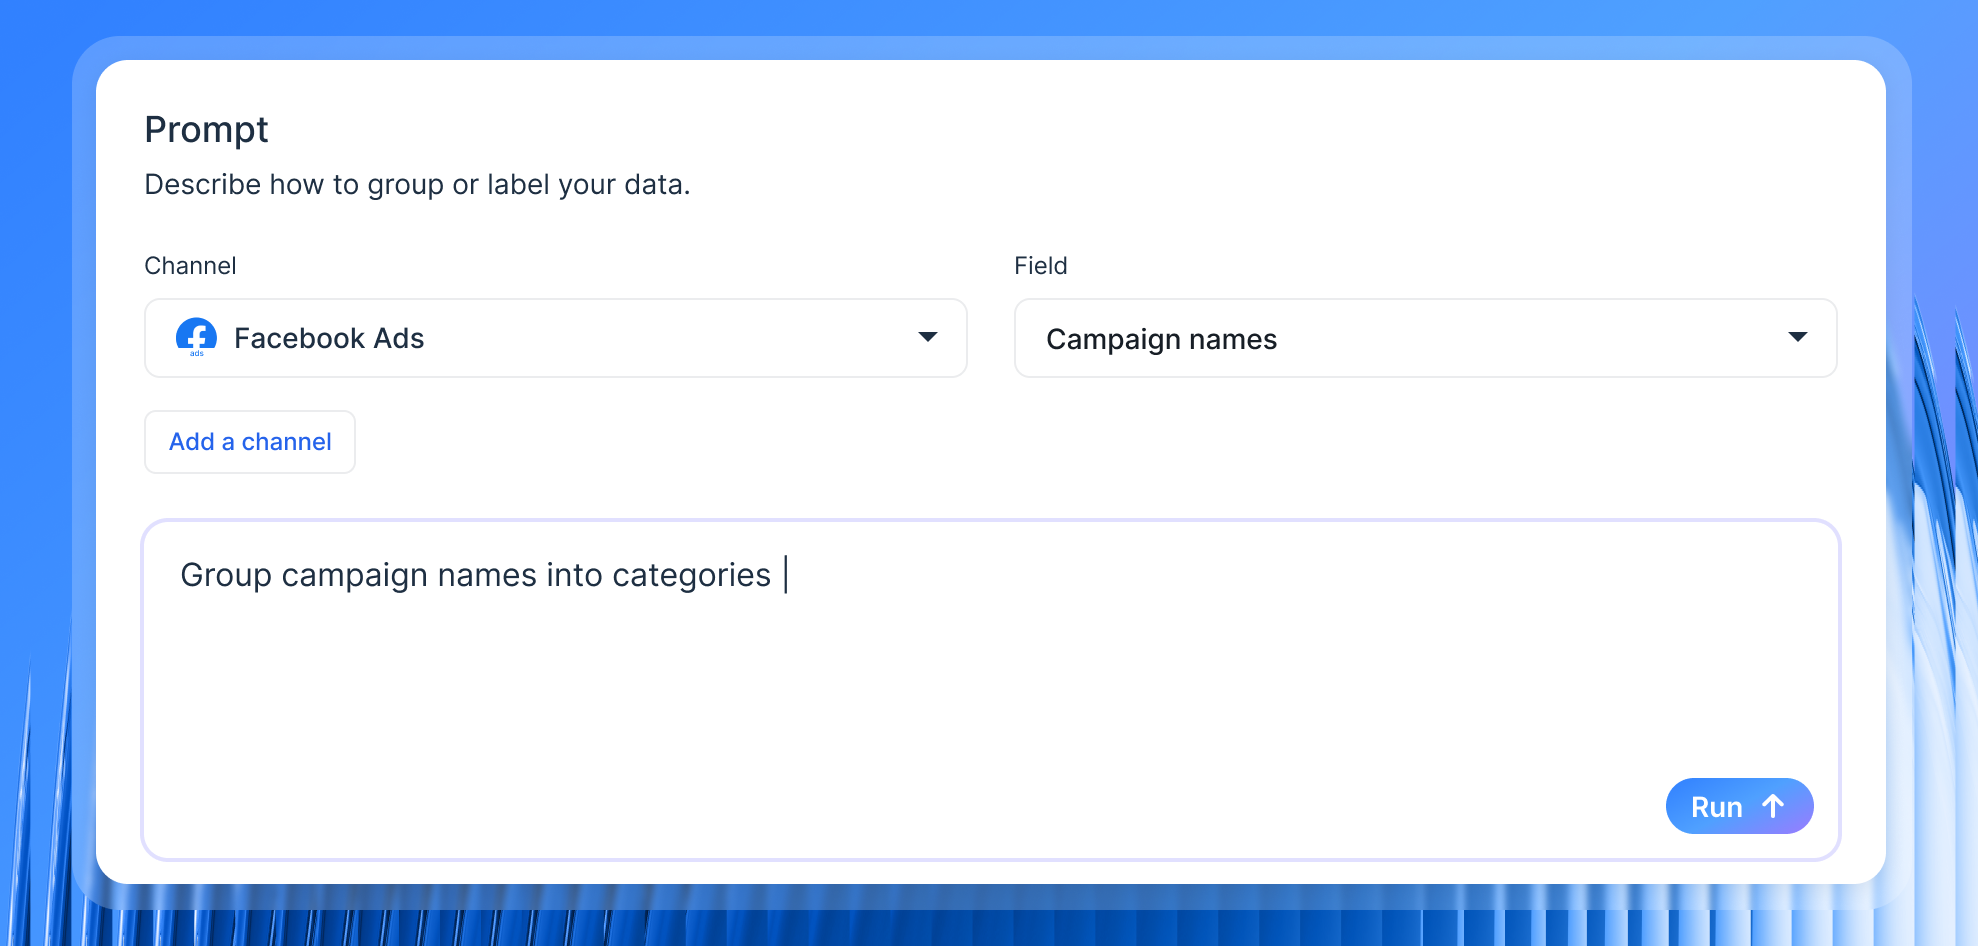
- IQ dimensions + filters: Use natural language to set up advanced logic. Type “Group campaigns into Awareness vs. Retargeting,” and IQ creates the dimension and filter automatically.
That’s a very different experience from AgencyAnalytics, where filters reset, require extra steps to save, and never span across clients or reports.
How can you manage clients on AgencyAnalytics?
AgencyAnalytics makes it pretty easy to manage your clients—but it’s built more for simplicity than advanced control.
You can create clients individually using a setup wizard, or upload them in bulk via CSV. Each client is tied to a website URL, which the platform uses for things like SEO audits and tracking backlinks or rankings.
Once a client is set up, you can:
- Apply a pre-built template (reports, dashboards, etc.)
- Assign a custom time zone for report delivery
- Group clients into folders for better organization
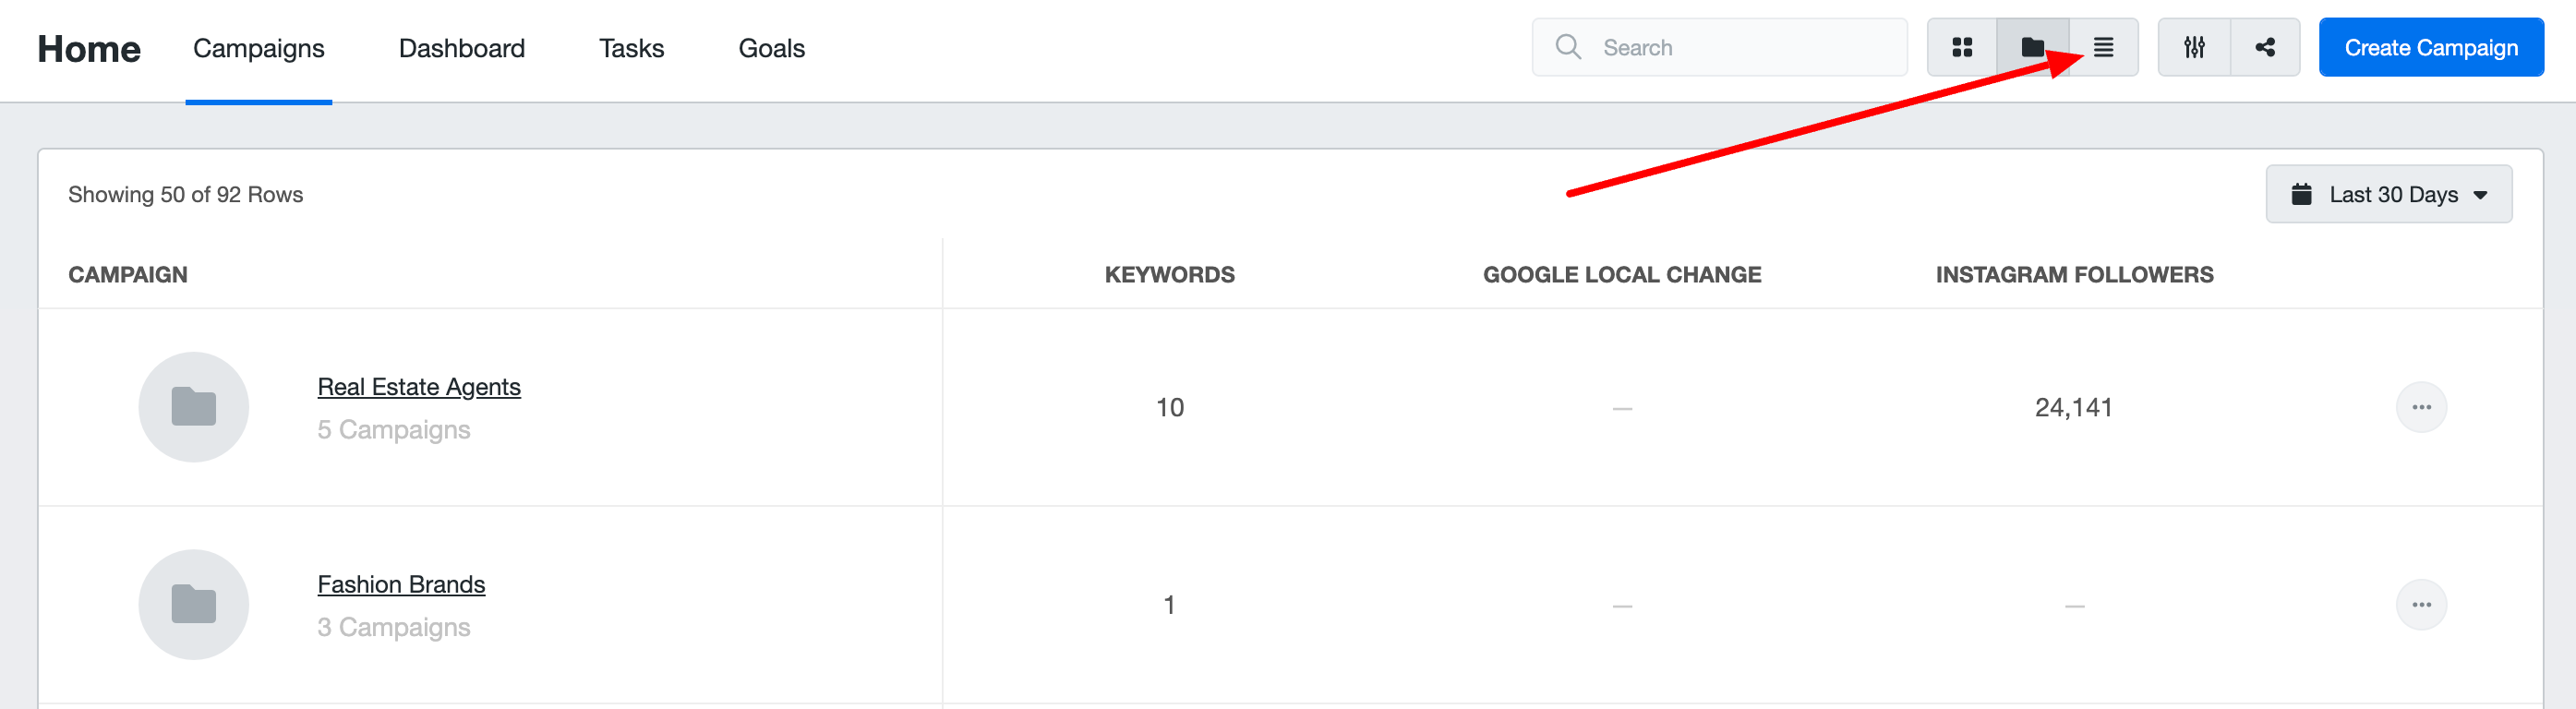
There are three ways to view your clients—tile, list, or folder—so you can pick whatever’s most comfortable for you. These views are user-specific, meaning it doesn’t affect what your teammates see.
Need to make changes later? No problem. You can edit client details (like name, website, or language) at any time from the client settings menu. Deleting clients is also simple, but irreversible—so proceed with caution.
The folder system is a nice touch, but it’s basic. You can’t rename folders, and there's no nesting. Want to update a folder name? You’ll have to move clients out and create a new one.
In contrast, on Whatagraph, you can simply rename it like you would for a folder on your Macbook.
Plus, you can also assign both data sources and reports to each dedicated folder to keep everything neat and tidy.
AgencyAnalytics lets you organize data, filter reports, and manage clients, but key features like data blending, custom dimensions, and persistent filters are either limited or only available on the highest plan.
AgencyAnalytics Reports and Dashboards
The reports and dashboards are the core deliverables your clients interact with, so their quality, flexibility, and the insights they provide are paramount.
How are reports built (templates vs. custom)?
You'll primarily be working with preset templates and a drag-and-drop widget system. This definitely speeds things up for standard reporting needs.
But, if your goal is highly customized or unique report layouts, you'll likely find the system template-bound, aligning with user feedback about expecting "out-of-the-box reporting" even when hoping for more.
Whatagraph still offers ready-made templates and drag-and-drop editing, but with Whatagraph IQ, here’s just how easy it is to create a stunning report in seconds:
- Click “Create” from your dashboard.
- Select “Report with IQ.”
- Choose a data source.
- Instead of picking a template, just type what you want: Example: “Build me a Q3 report comparing ad spend and conversions across Meta, Google Ads, and LinkedIn.”
- Alternatively, choose one of the prompt suggestions like “Cost & Efficiency.”
And voila! From here, you can drag-and-drop to polish the layout, but the heavy lifting is done for you.
What can you actually customize?
While standard white-labeling (logo, basic colors) is available, users consistently report wanting more customization options. As one user put it, "If you want to change up the title page or try to combine elements, there really isn't a way to do that."
Another wished for more than the "standard customising options," specifically to "tailor our reports to match our company branding" more closely.
If you need deep analytical reports, like focusing only on specific user behaviors combined with AI insights, users find the platform "doesn't appear to help there."
If you want a report that actually looks like your client’s brand, you’re in for a long session of manual edits with AgencyAnalytics.
That’s not the case with Whatagraph IQ, though:
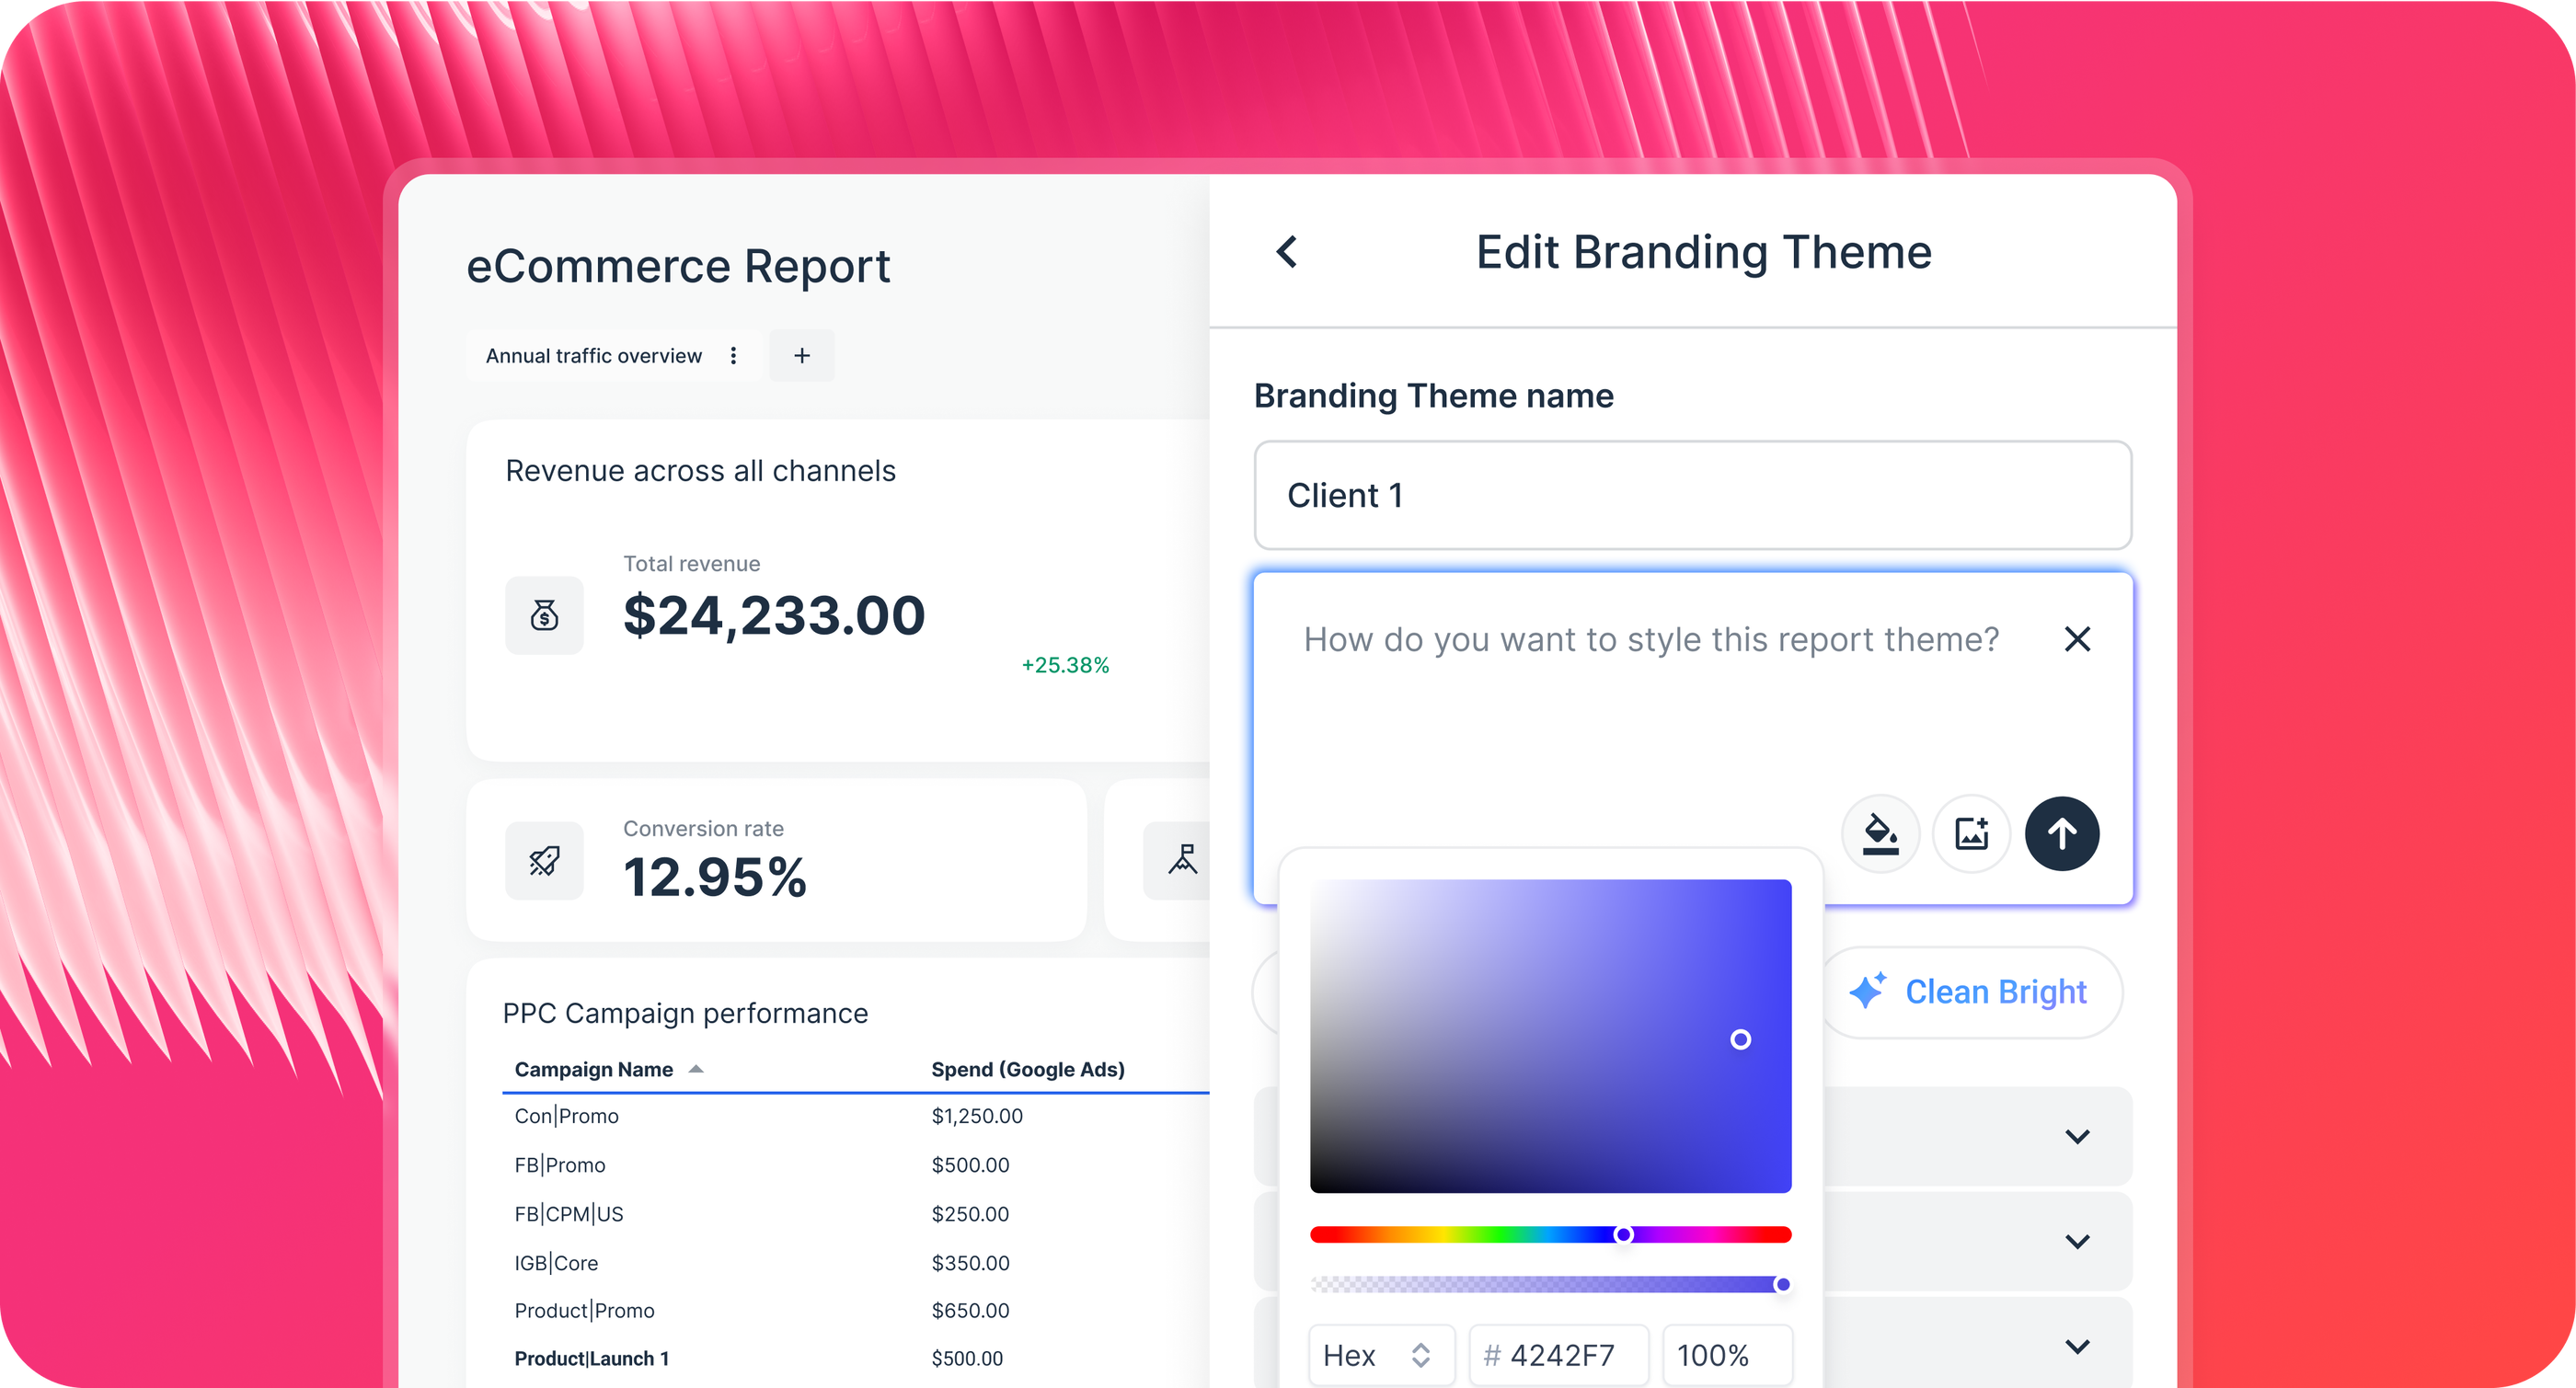
- Open a fresh report, and instead of hunting for hex codes or fonts, there’s a simple “Enhance theme style with IQ” option right in the editor.
- Drop in a client logo, a website screenshot, or even type a vibe prompt like “Minimal, pastel palette with rounded fonts.”
- IQ instantly interprets your input, re-skins the report, and applies the look everywhere: widgets, charts, tables, backgrounds.
Have a look-see:
Whatagraph gives you true brand-level customization: themes generated in seconds, the option to restyle individual widgets on the fly, and even custom domains for fully branded client portals.
Patrick C.,’s review highlights our core offerings best:
It is extremely flexible, the visuals are beautiful, very customizable to make complex data easy to ingest for the client. If I was starting an agency today, signing up with Whatagraph would be one of my first moves.
Are the dashboards interactive or static displays on AgencyAnalytics?
Expect dashboards to function primarily as static displays of your chosen metrics. They generally lack the deep interactivity or data exploration features found in more advanced BI tools, limiting how much users (your team or clients) can dig into the data directly within the dashboard.
What are your sharing options (and how automated/efficient are they)?
Standard sharing via scheduled emails, downloadable PDFs, and white-labeled client portals is available.
However, users report significant frustrations with the update process. If you change a dashboard, these changes might not automatically reflect in reports generated from that dashboard; users report needing to manually delete old report versions and add the updated ones.
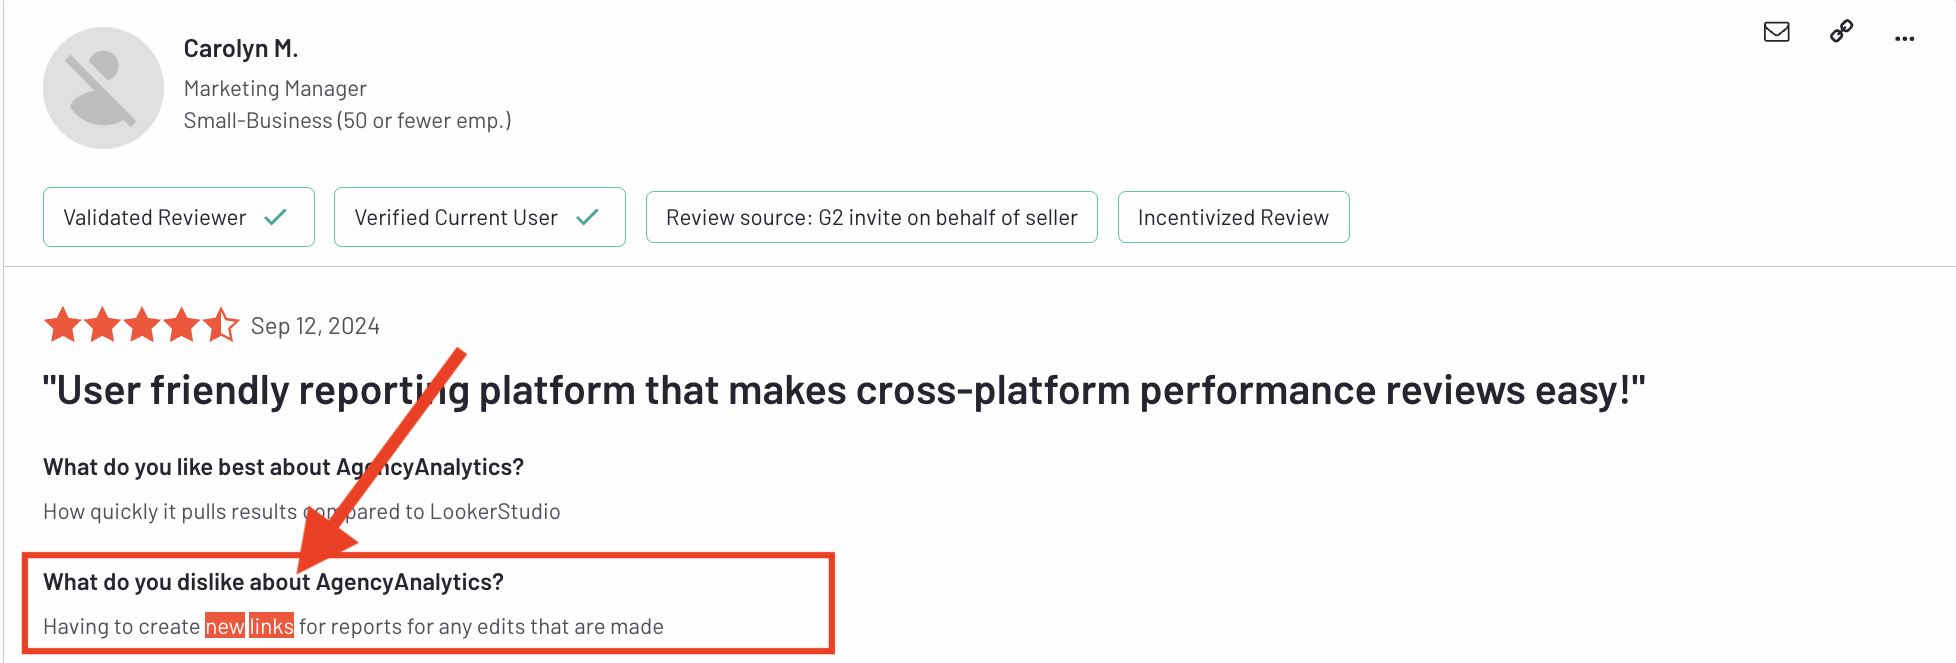
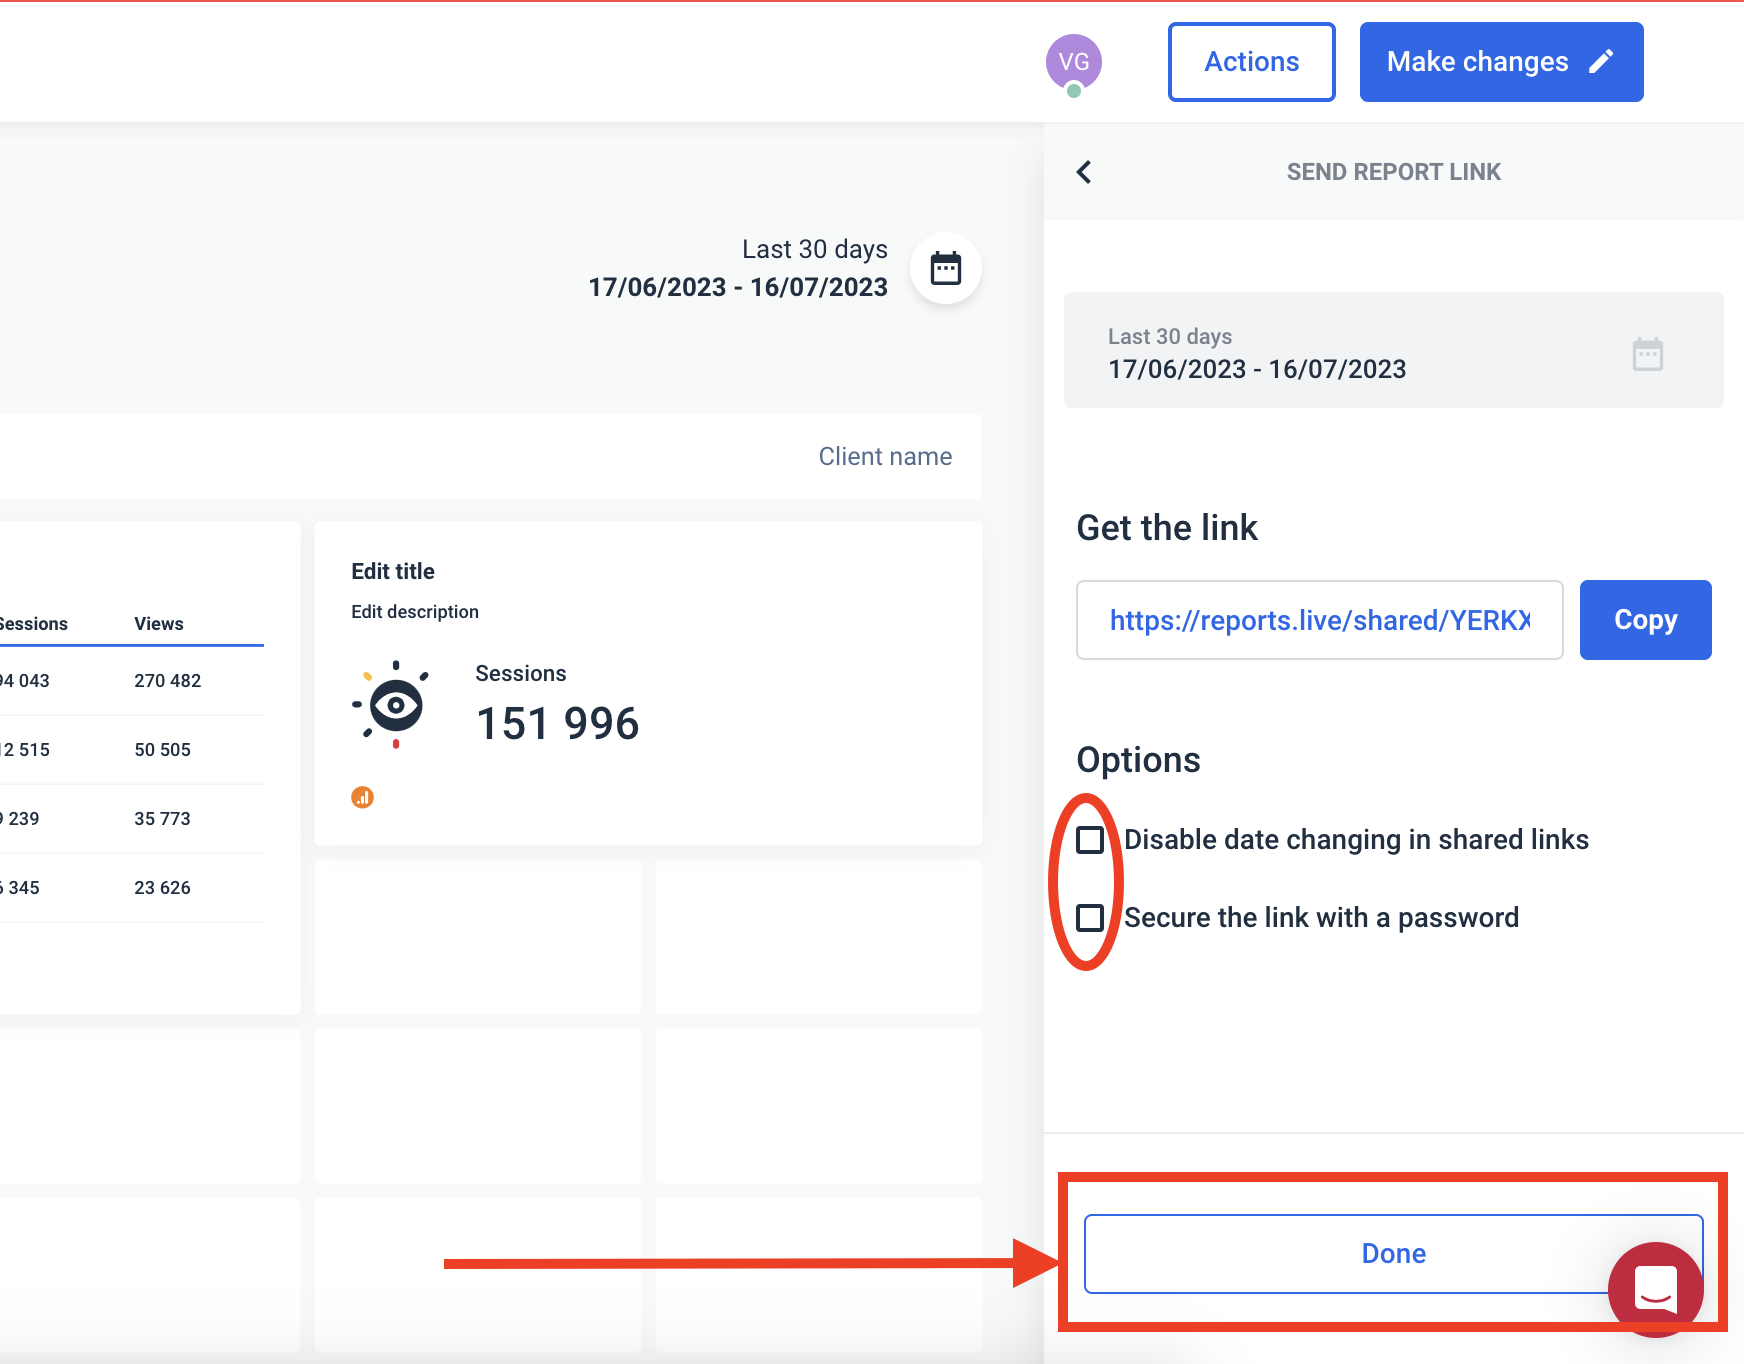
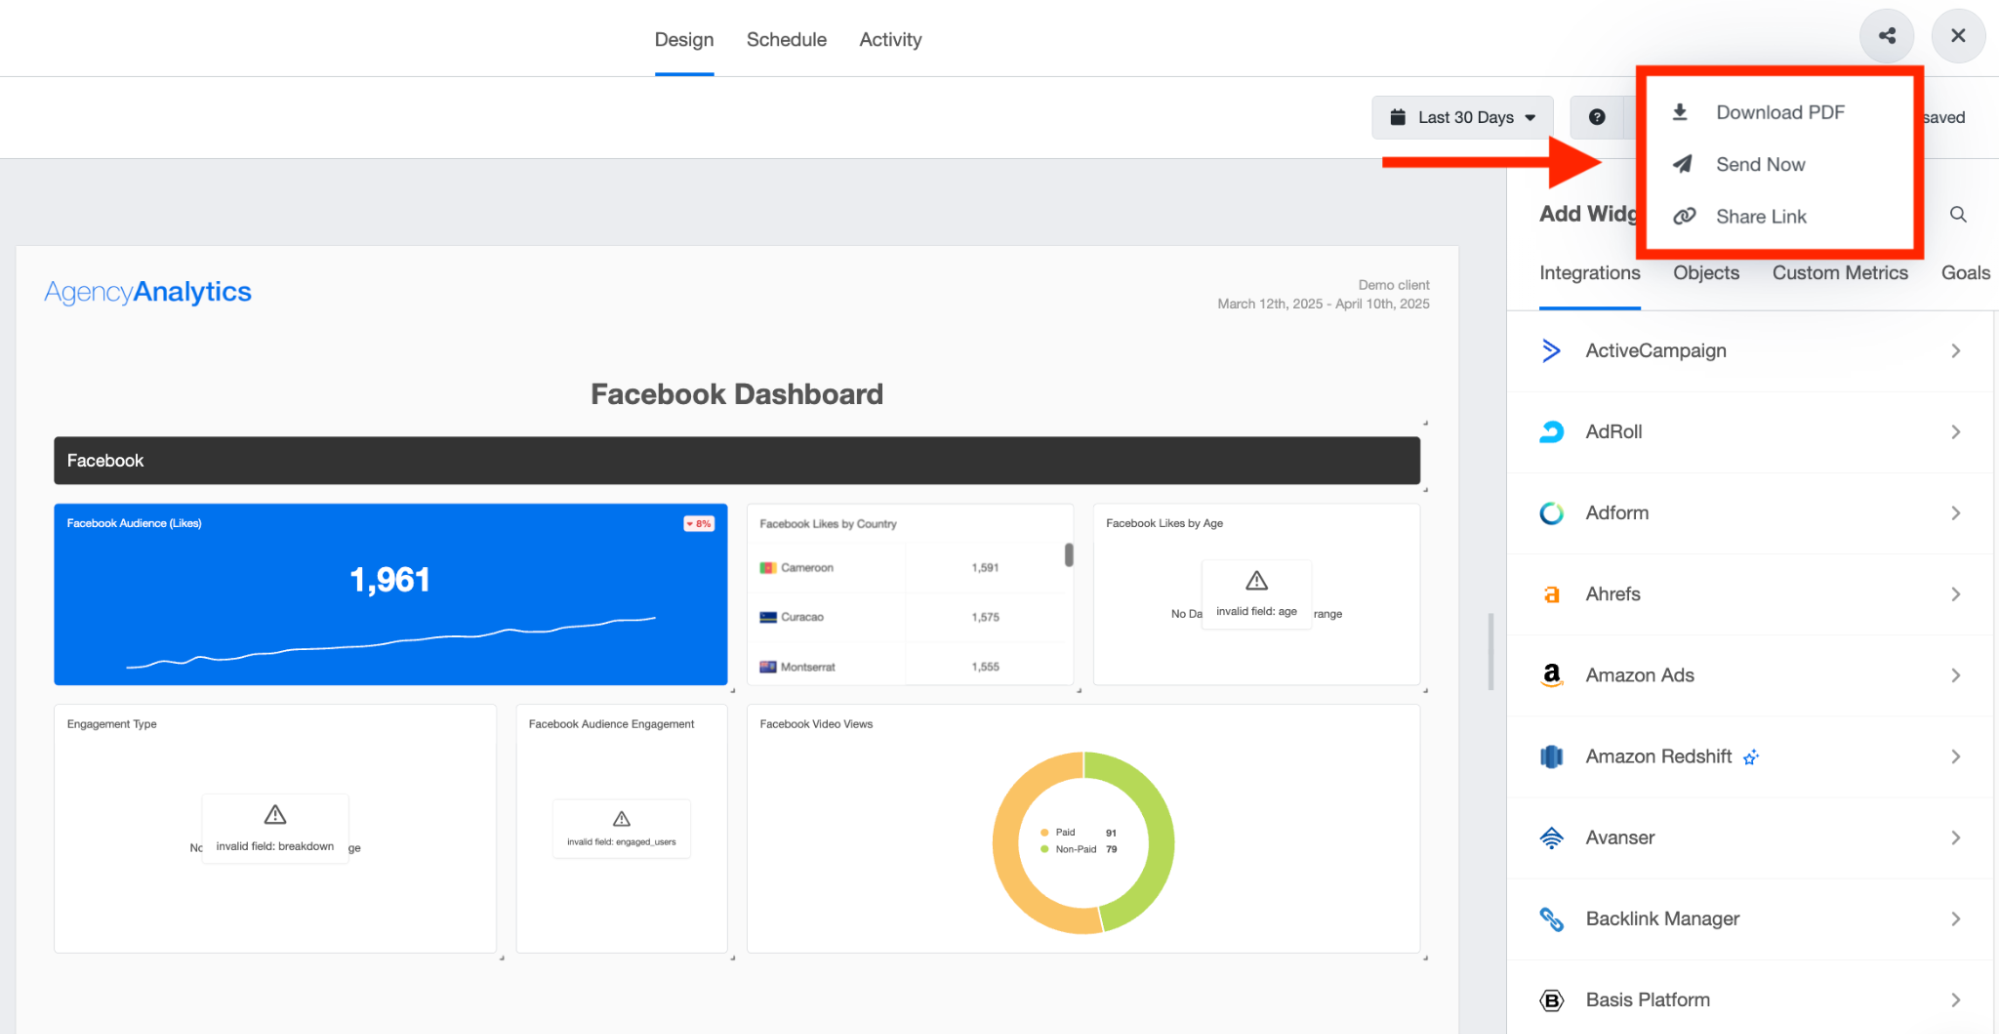 Also, making any edits might create entirely "new links for reports," adding friction to the updating and sharing workflow. This contradicts the expectation of seamless automation and can create extra manual steps.
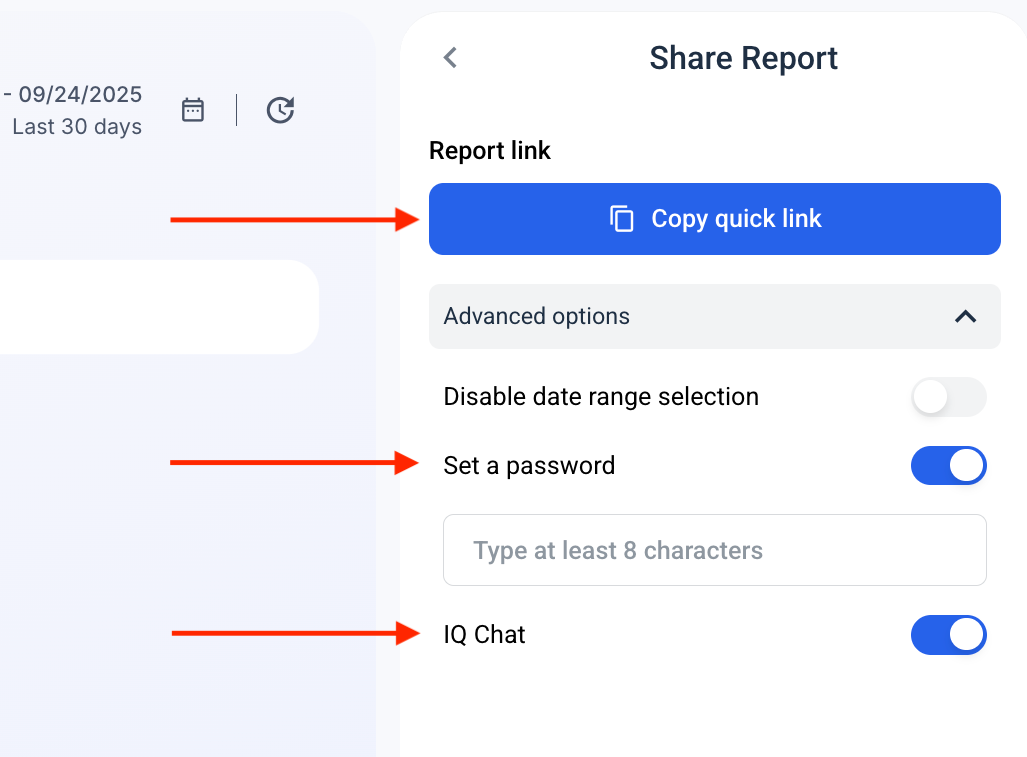
 On Whatagraph, there are two helpful options to automate client reports: to review your reports before sending them, and to opt in for an email update when the report is sent. No surprises.
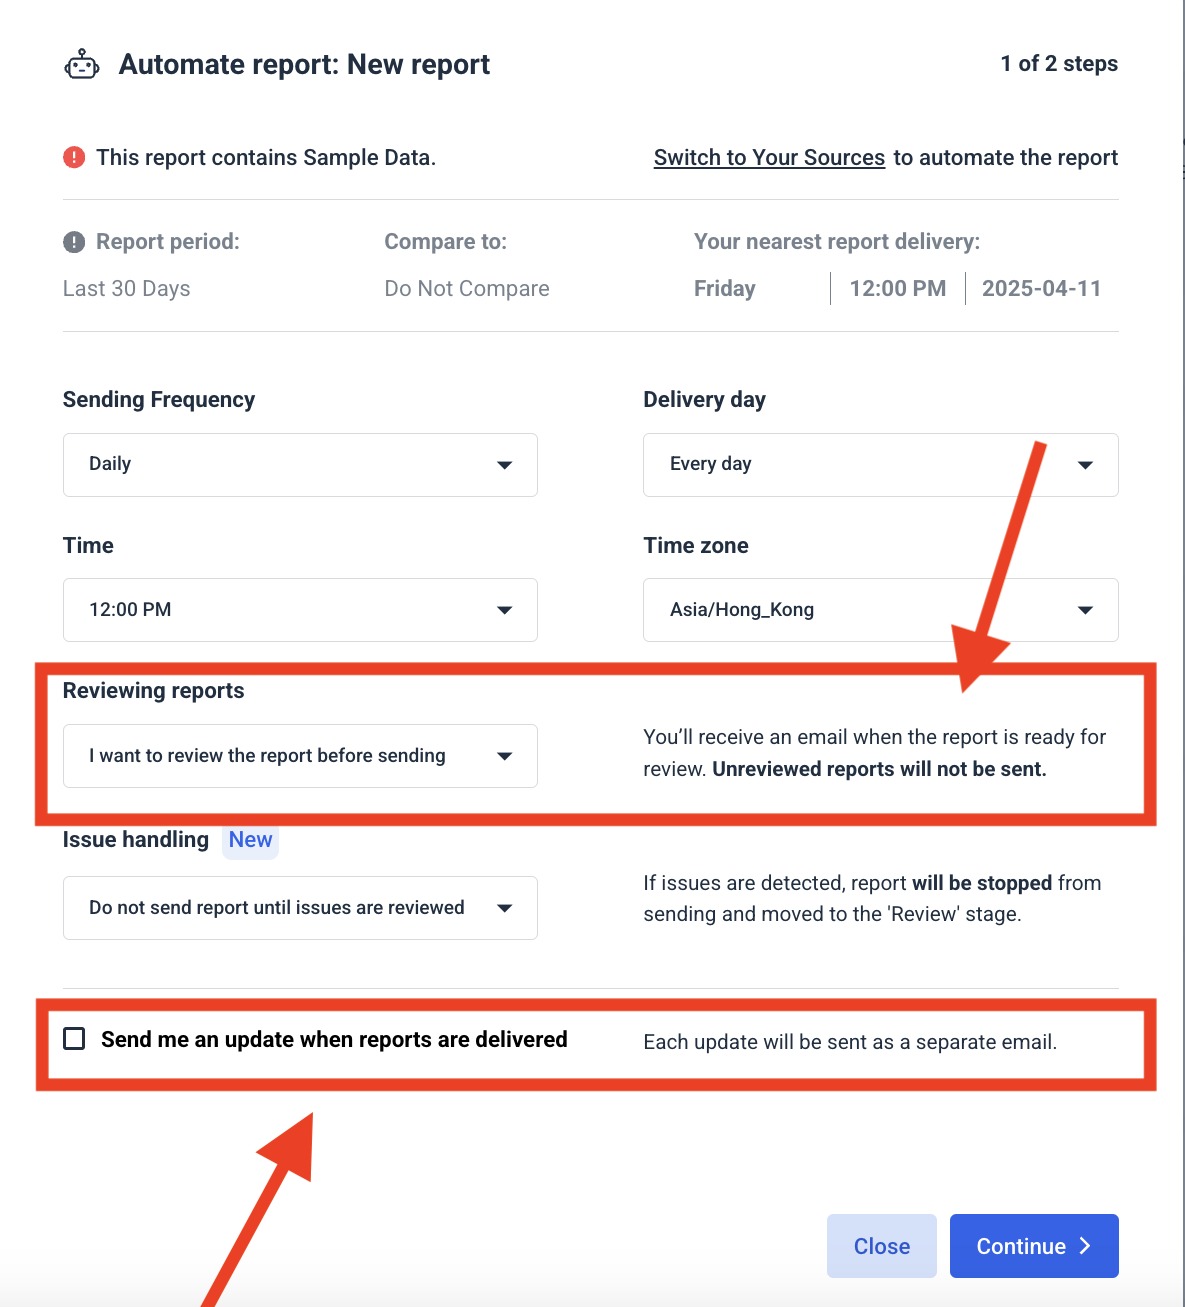
And with the new “Share Report” settings, you also get IQ Chat inside reports to let clients ask questions directly in the shared report.
What about AI features for insights?
While the more expensive plans come with AI summary features, user feedback suggests these are not sufficient for deep analysis.
If you aim to generate reports leveraging "machine learning and AI insights" to understand campaign performance drivers, AgencyAnalytics likely falls short. The insights seem geared towards high-level overviews rather than actionable, AI-driven analysis.
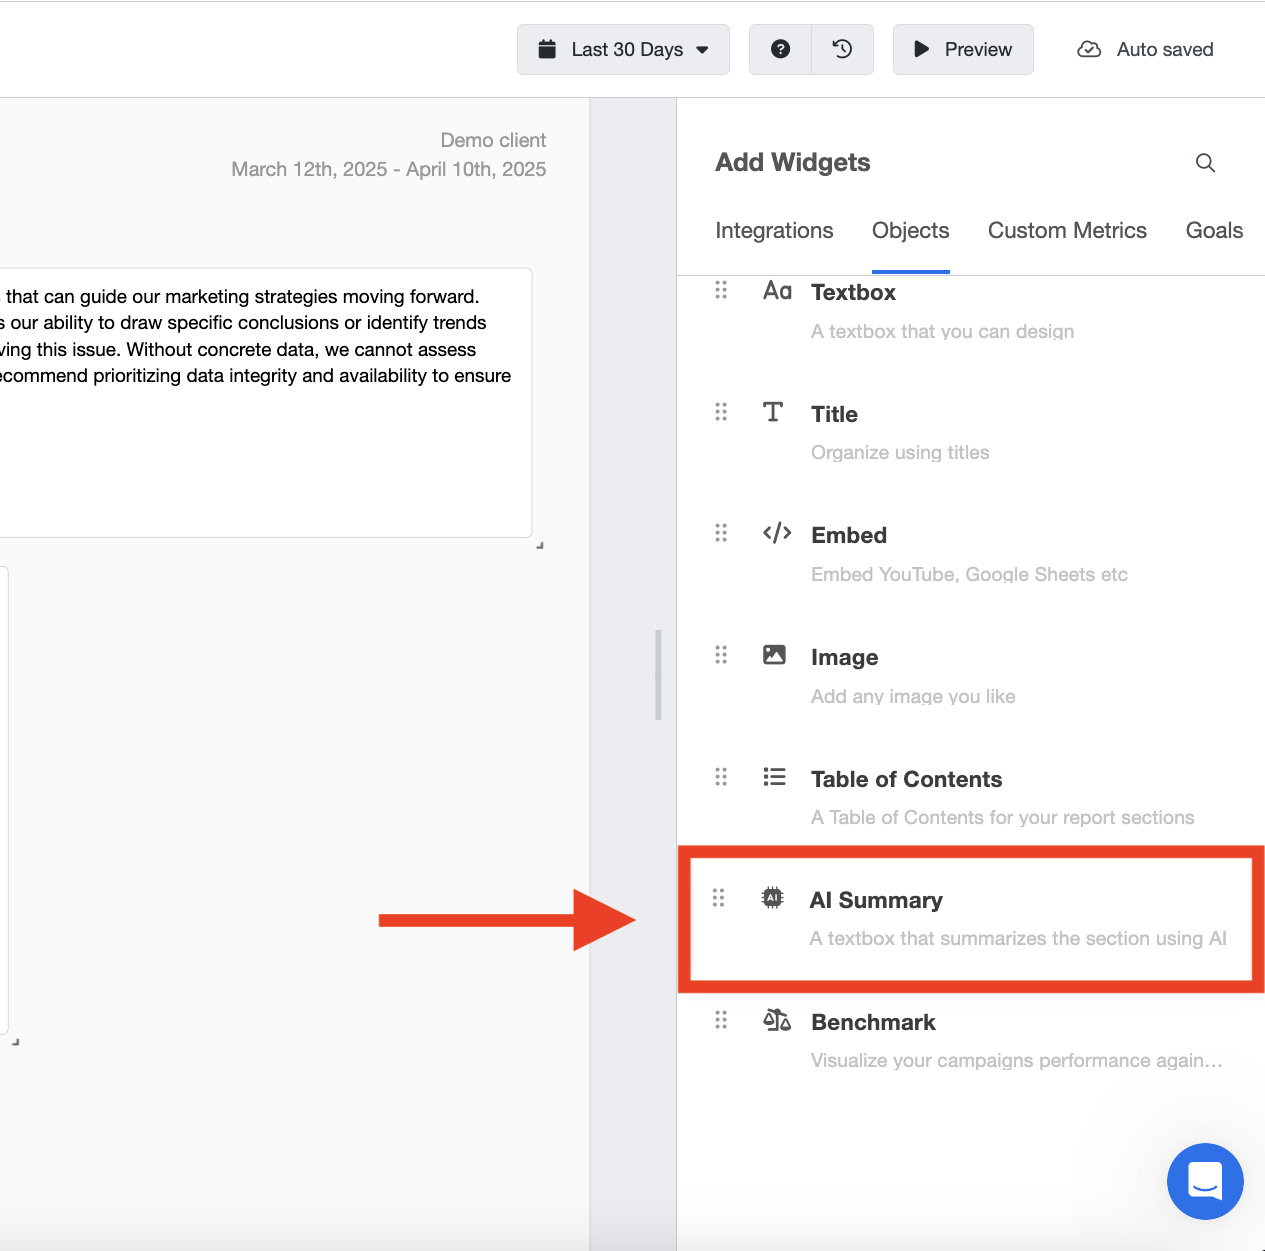 AgencyAnalytics’ “AI Summary” feature does just that—summarize. In contrast, if you try Whatagraph’s AI, you can actually talk to it to pull relevant insights from your campaigns instead of hunting down reports.
On the other hand, Whatagraph lets you talk to your data. Pop open IQ Chat from the bottom-right corner, and ask natural-language questions to immediately get insights: charts, tables, or commentary—without hunting down the right widget or filtering manually.
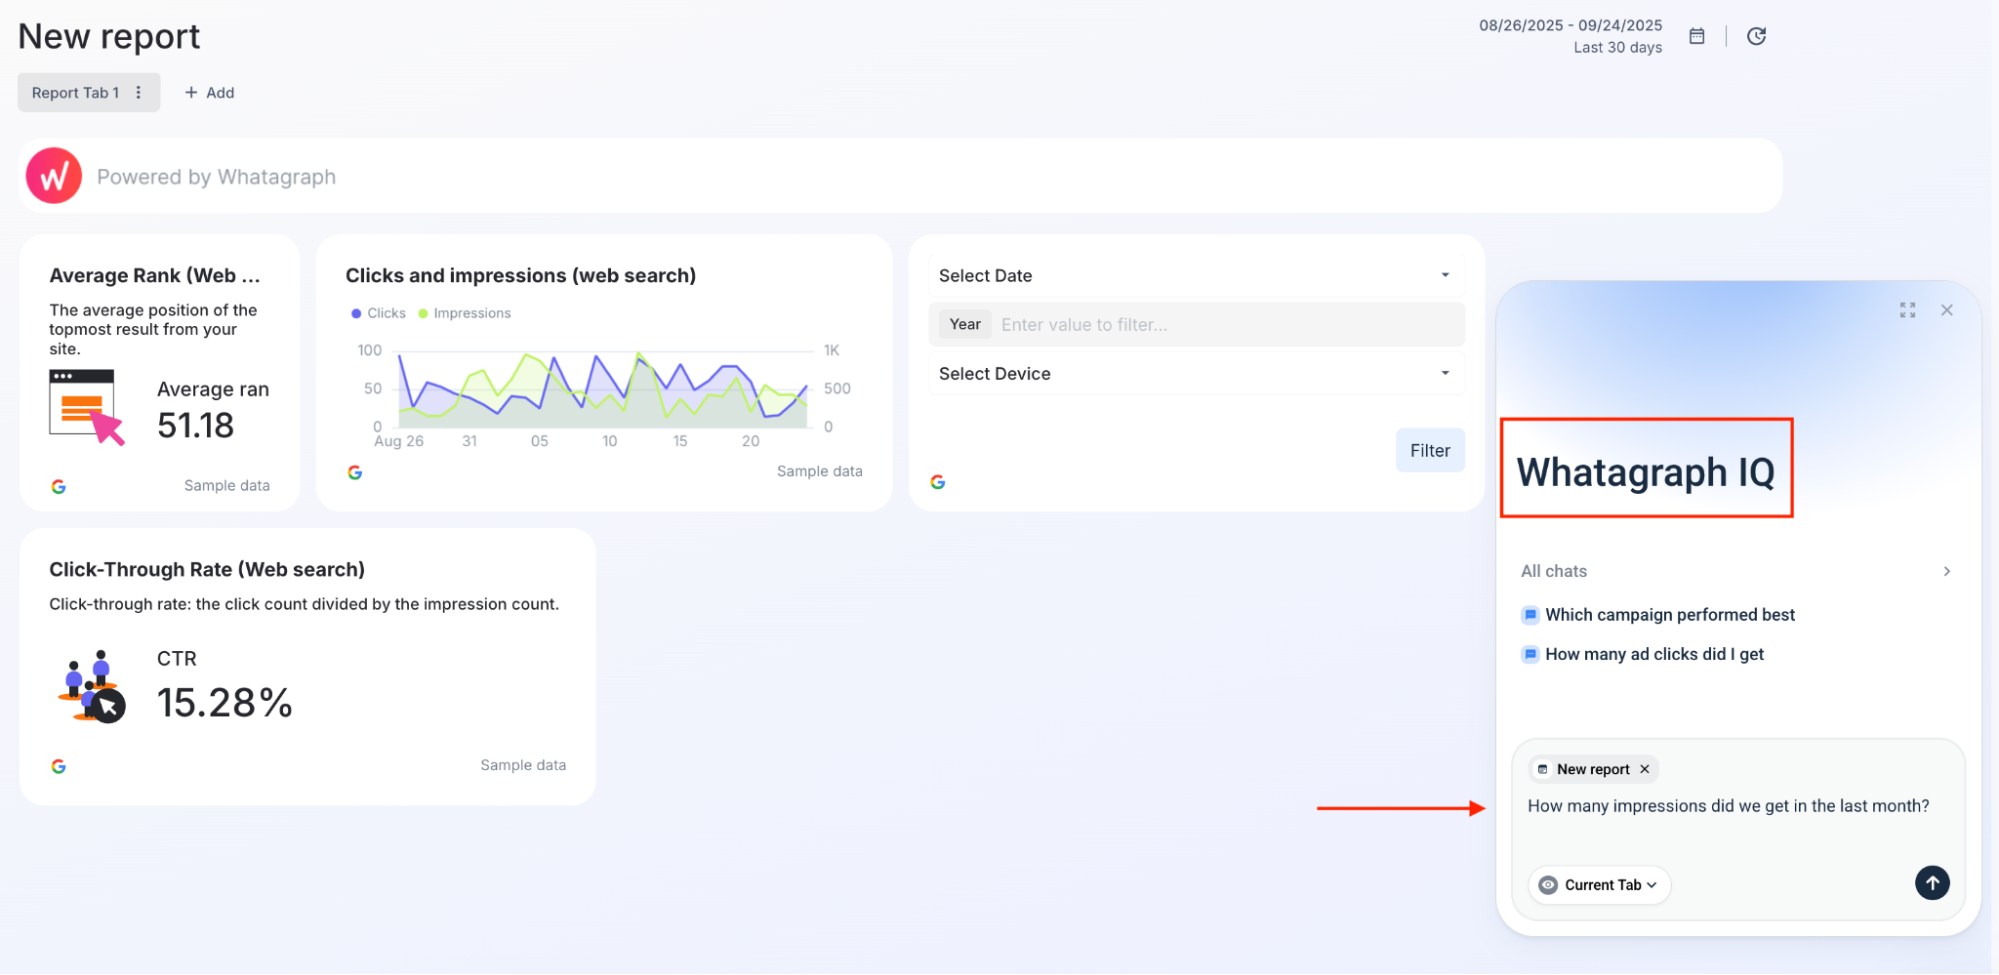
IQ Chat pulls the answer directly from live data in the tab you’re viewing, so you always get context-specific results. And because it’s available in shared reports, clients can self-serve insights without waiting for you to build a new view!
AgencyAnalytics is good for getting standard reports out the door, but weak on deep customization, smooth automated updates, insightful AI, and flexible dashboards for complex analysis or internal tracking.
AgencyAnalytics Security
Security is obviously critical—you're handling sensitive client data, and you need peace of mind. So, how does AgencyAnalytics stack up for protecting your agency and your clients? We looked into the key areas:
How do they approach data encryption?
You can generally expect standard practices like HTTPS for data in transit, aligned with their commitment to take "all steps reasonably necessary to ensure that your data is treated securely."
Are they covering GDPR basics?
Yes, their Privacy Policy indicates a clear focus on GDPR principles. It outlines your rights regarding your personal data, including the right "To access and receive a copy," "To rectify," "To request the deletion," and the "right to data portability."
Can you control who sees what (role-based access)?
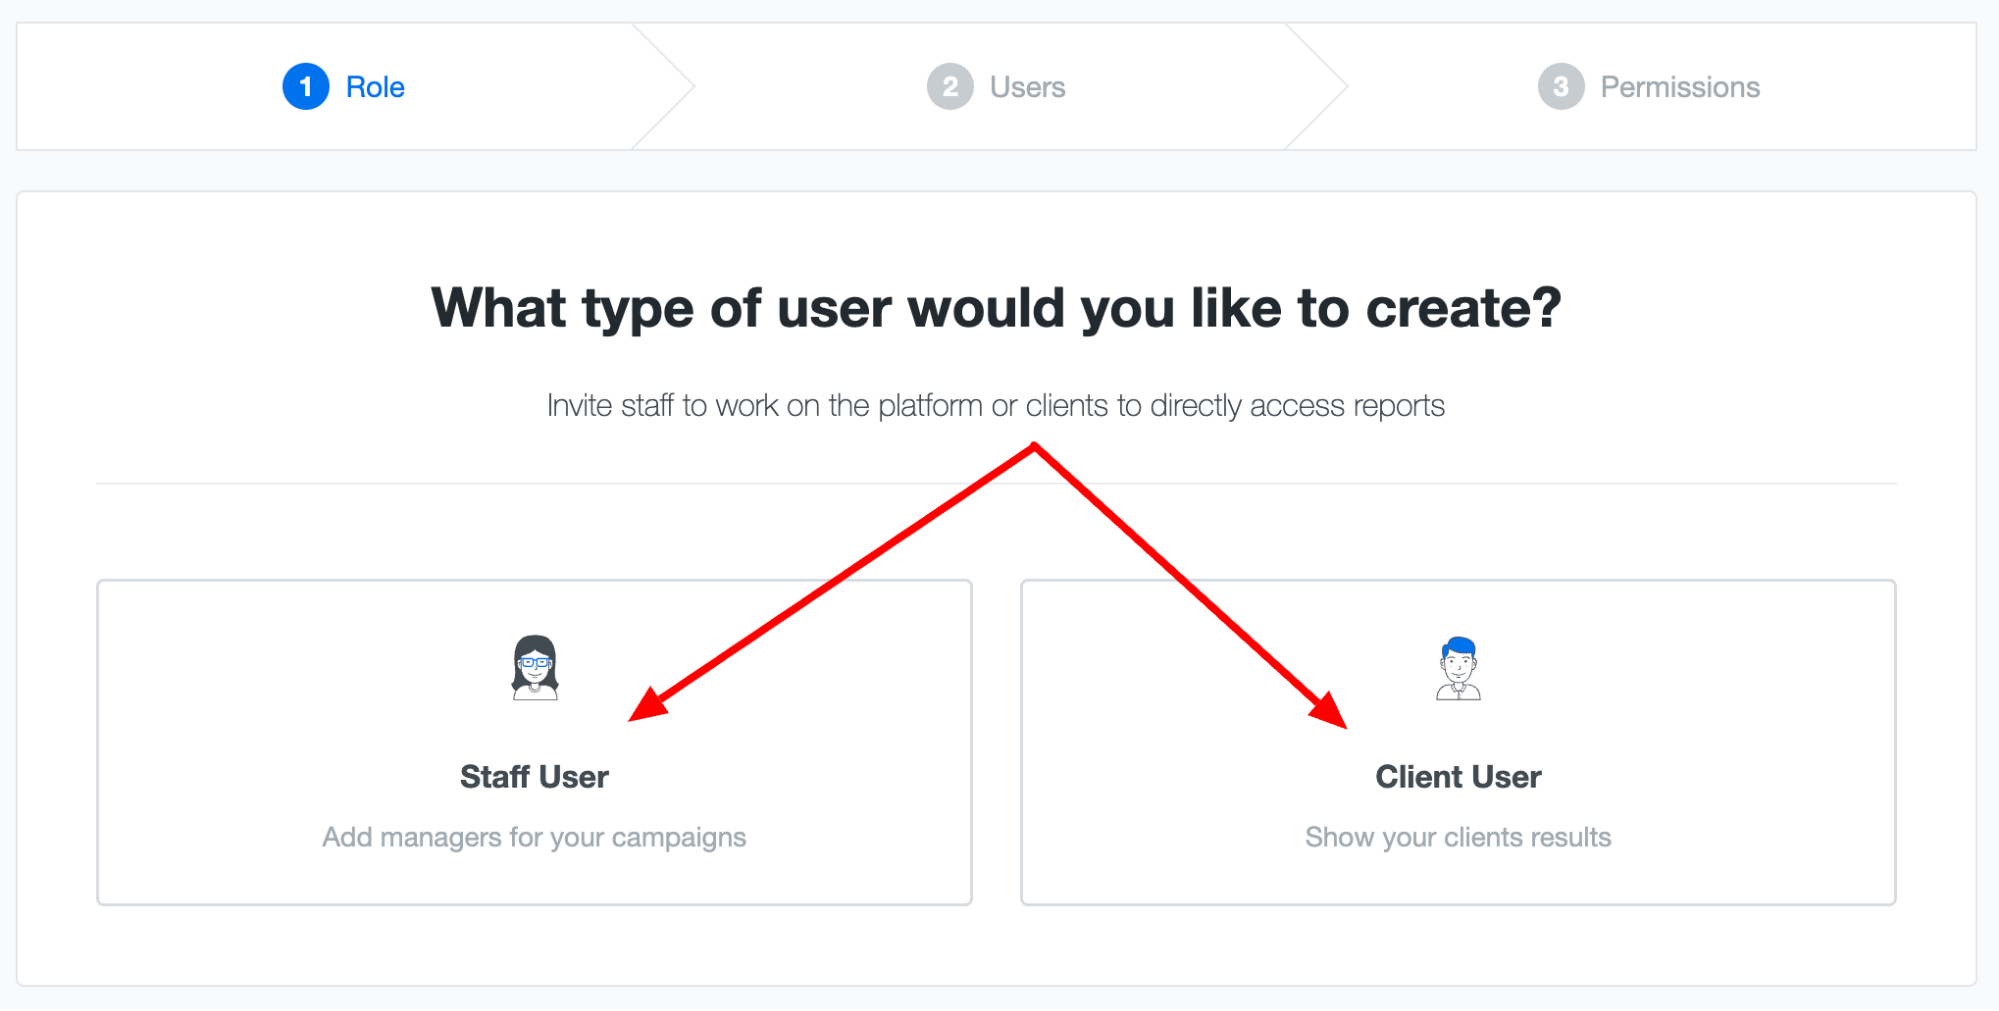
AgencyAnalytics does offer controls over user permissions. You can typically assign different roles to staff and clients and customize what data or features they can access.
Remember, though, the full flexibility to customize these permissions might require being on their Agency or Agency Pro plans, as entry-level plans may have fixed, basic permissions.
Heads-up: Multi-factor authentication is a security feature included with only some plans.
If you want to take client data security a step further, Whatagraph gives you the option to secure your reports with a password, so you know that only the people who need to see the report will have access to it.
What about single sign-on (SSO)?
SSO simplifies logins and is often a requirement for larger organizations. However, SSO is not mentioned in the detailed Privacy Policy provided, nor was it readily confirmed in feature lists found during our research.
So, where might it fall short for enterprise teams?
The two main potential gaps for larger agencies or enterprise clients are:
- The lack of easily confirmed SSO support; and
- Multi-Factor Authentication (MFA) being dependent on the pricing plan.
These limitations might not satisfy stricter corporate security policies that often mandate both SSO and MFA for all users.
Covers security basics (GDPR, user roles—best on higher plans), but unclear SSO and plan-limited MFA create potential gaps for strict enterprise needs.
AgencyAnalytics Customer Support
Good software is great, but when you hit a snag or need guidance, reliable support is essential. So, what kind of help can you actually expect from AgencyAnalytics? The user feedback here is notably mixed, suggesting experiences can vary quite a bit.
Is there a dedicated Customer Success Manager (CSM)?
Probably not, unless you're paying top dollar. Their pricing suggests "Priority Support" comes with the higher-tier Agency Pro plan, and some users have noted the lack of CSM contact as a downside. So, for most plans, you'll likely be using the general support options.
At Whatagraph, every plan includes real human support via live chat (our amazing team answers in under 4 minutes on average). And if you’re on the “Boost” or “Max” plans, you also get a dedicated Customer Success Manager: a go-to partner who helps with setup, adoption, and ongoing strategy.
Is there quick live chat?
They might offer live chat that replies in “under four minutes,” but don't necessarily count on instant answers. Some users report that support is "sub-par at best" and response times can stretch to "almost an hour," which isn't exactly 'live.’
I do, however, quite like that they include a “Status” box to show system operations. 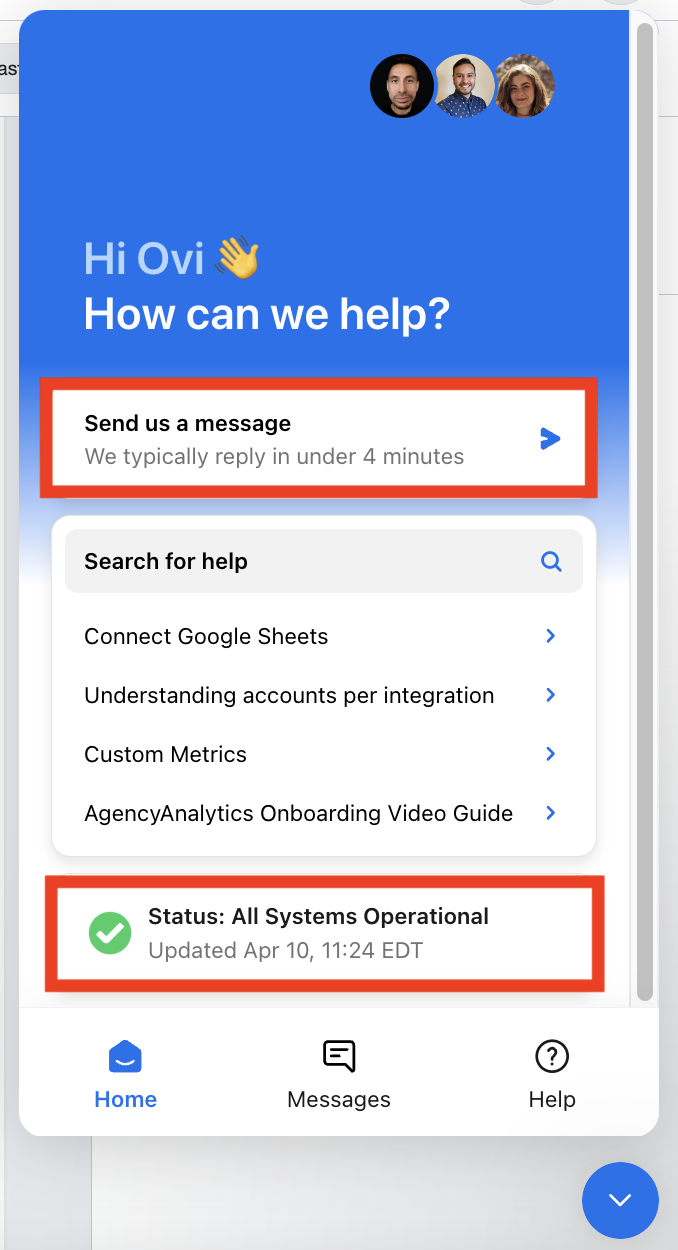
What are the other ways to get help?
You've got the usual options: looking things up yourself in their Help Docs or Knowledge Base, or sending your question via email/ticket support.
What are real users saying about their experience?
This is where experiences seem to really differ.
On the one hand, some users have good things to say. One found the support "very solid" with response times "much better than other providers.” We saw earlier reviews praising support as "incredible" and super fast, too.
On the other hand, many users report significant frustration. Beyond just slow responses, a big complaint is feeling like you're getting the runaround.
One user described needing multiple back-and-forths because the support person always had to "speak to the team" instead of providing answers, making it feel like they were trying to "push the problem back onto the client.”
So, what's the deal?
It looks like if you have a simple question, you might get a quick and helpful answer.
But if you run into a trickier technical issue (especially with integrations) or need a problem solved efficiently, you might find the support process slow, repetitive, and ultimately unsatisfying, based on many user accounts.
At Whatagraph, customer support is our priority. You can also reach out to us via live chat, and we reply in under 1 minute and resolve most issues within 4 hours.
This is what Kim Strickland, Digital Marketing Specialist at Peak Seven agency, loves about us. She says:
I've joked about this often—with Whatagraph, we're not paying for a reporting system. We're paying for customer support. There's a level of dedication from the Whatagraph team that you don't often experience anywhere else.
AgencyAnalytics' support experiences vary widely; some find it fast for basics, but many report frustrating delays, inefficiency, and difficulty getting complex problems resolved effectively.
Final Verdict: When to Use AgencyAnalytics and When to Switch
After diving deep into AgencyAnalytics—exploring its features, usability, support, pricing, and hearing from real users—what’s the final call?
The truth is, the "best" reporting platform depends entirely on where your agency is today—and where you plan to go tomorrow.
Choose AgencyAnalytics if:
- Your agency is relatively small, you're a freelancer, or you're just starting with automated reporting.
- Your primary service is standard SEO, PPC, or social media reporting without needing deep cross-channel analysis.
- Ease of initial setup and basic, clean report templates are your main priorities.
- Standard white-labeling options (logo, basic colors) are sufficient for your client needs.
- You don't require complex data blending, highly customized metrics, or unique report visualizations.
- You manage a smaller number of clients where the per-campaign pricing remains affordable.
Choose Whatagraph if:
- You need in-depth data you can consistently trust, and can't afford the time lost to troubleshooting frequent integration disconnects or reporting on data that's days old.
- Getting holistic, cross-channel insights is critical, requiring powerful and flexible data blending capabilities that AgencyAnalytics lacks.
- You need to create truly custom dashboards and stunning reports that go far beyond standard templates to impress clients and showcase specific insights in seconds, with AI.
- AI is part of your workflow; so you can build entire reports from a prompt, auto-style them with IQ Branding, and pull insights directly via IQ Chat.
- Efficiency is paramount, and features like linked templates are essential to save your team hours managing reports across your entire client base
See how Whatagraph helps growing agencies easily create reports that deliver real value.