


TL:DR
Cyfe is a budget-friendly dashboard tool that lets you track marketing KPIs in one place. It’s simple to use for solo marketers or small teams, but limited when it comes to integrations, customization, and advanced data blending.
Who it’s best for:
Smaller teams or solo marketers who want a no-frills dashboard to monitor a few platforms, and don’t need advanced features, deep integrations, or customer support on standby.
Key features at a glance:
| Feature | Cyfe |
| Integrations | 25 native integrations (plus Zapier or API integrations) |
| Stable connections | Mostly stable, but no visibility into refresh rate |
| Ease of use | Simple UI but setup is time-consuming |
| Data blending | Basic “Mashup” widget only, doesn’t support advanced data blending |
| Internal dashboards | Available |
| Customizable reports | Very limited (no custom formulas or metrics) |
| Report sharing & automation | Email, file exports, links, and TV display |
| Security | AWS-hosted, SSO available on Agency plan, unclear GDPR stance |
Pros ✅
- Affordable starting price
- Good for basic marketing dashboards
- Custom widget setup (if you don’t mind manual work)
- Supports dashboard sharing via email, PDF, links, and TV mode
Cons ❌
- Limited native integrations (only 25)
- No AI insights or automated summaries
- Product development has slowed down — no recent updates
- Poor customer support, email-only and often unresponsive
Cyfe Pricing
Let’s start with an important discussion: Cyfe’s pricing. The pricing plans are entirely based on the number of dashboards and users you need.
 Want a better look at the pricing plans? We’ve made a detailed breakdown of Cyfe’s five different pricing plans below.
| Plan | Price (Monthly) | What’s Included: |
| Starter | $29/month |
|
| Standard | $39/month |
|
| Pro | $65/month |
|
| Premier | $119/month |
|
| Agency | $190+/month |
|
Heads-up: Notice how the Agency plan only includes 10 clients? If you need more, you need to pay $19/month extra for each new client, which can quickly drive up the cost.
Real User Reviews: What are Customers Saying About Cyfe?
Along with doing our own research, we wanted to dig into genuine Cyfe feedback—to see what customers like about the platform (and where it falls short).
So, we collected Cyfe reviews from platforms such as TrustRadius, G2, and Capterra, and compiled them below.
| Overall G2 Cyfe Rating | 4.3 out of 5.0 stars (60+ reviews) |
| Overall Capterra Cyfe Rating | 4.6 out of 5.0 stars (70+ reviews) |
Cyfe pros: What real users love
✅ Visibility into key marketing metrics
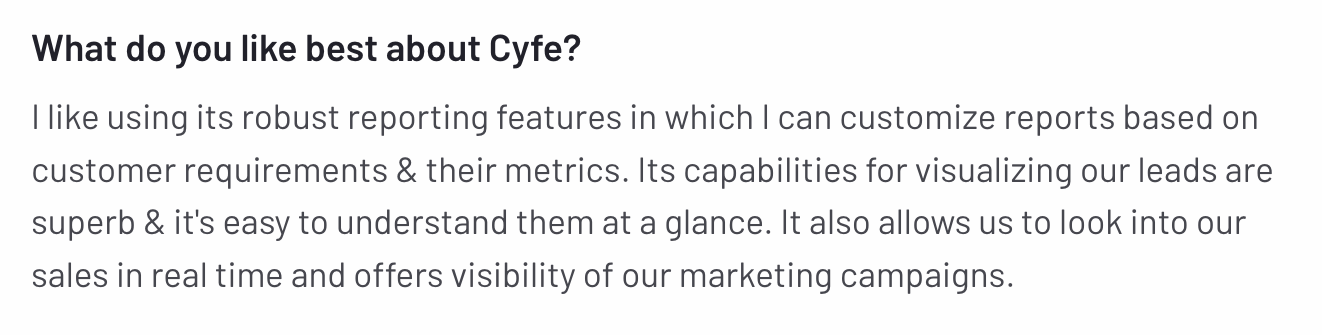
This is Cyfe's main use case. Users can create business dashboards to track metrics from marketing platforms like Google Ads, Facebook, and Mailchimp.
Ramkumar N. on G2 appreciated this and said, “It allows us to look into our sales in real time and offers visibility of our marketing campaigns.”
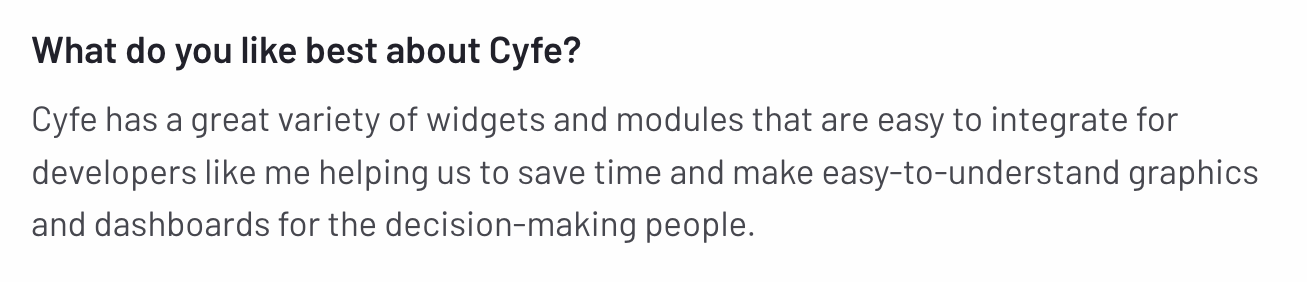
 ✅ Widgets for displaying data
Cyfe doesn’t have pre-made widgets available, but you can configure your own widgets, and users liked having the full control.which users liked.
One G2 user said:
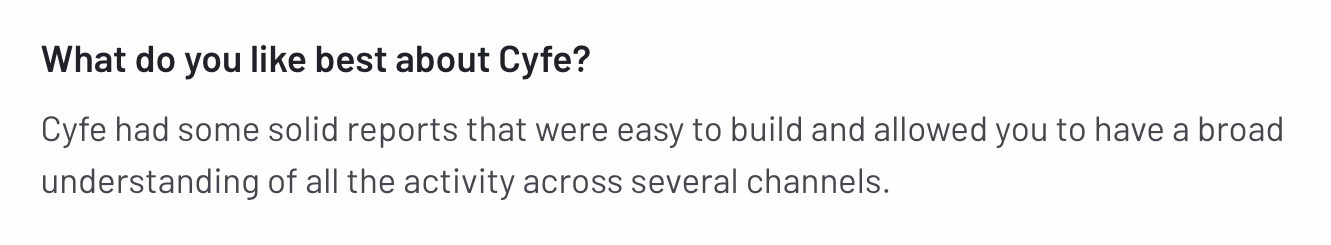
 ✅ Ready-made templates
While the number of templates is limited, users appreciated the few options available.
Instead of having to start from scratch, the templates give you a good head start.
Sawyer M. said, “Cyfe had some solid reports that were easy to build and allowed you to have a broad understanding of all the activity across several channels.”
 ✅ Cost-effective dashboard software
It’s very apparent—Cyfe is affordable to get started with. The Starter plan starts at just $29/month and works for those doing reporting across a few platforms.
Cyfe cons: What real users find limiting
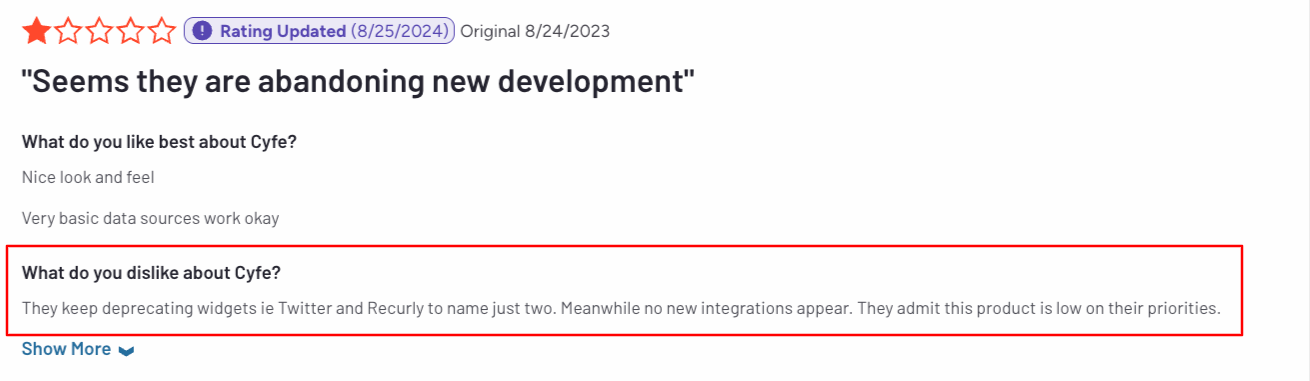
❌ Development has slowed down
This was one of the main Cyfe complaints. According to reviews (and our observations), the development of Cyfe has completely slowed/shut down.
For example, there are no recently added integrations, templates, or features.
And even worse, users say Cyfe’s team has started removing features. One G2 user specifically said:
“They keep deprecating widgets, ie, X and Recurly, to name just two. Meanwhile, no new integrations appear. They admit this product is low on their priorities.”
❌ Limited reporting features
It’s fair to say Cyfe’s reporting features are very limited.
To name a few limitations, there are no ready-made widgets, only three dashboard templates, and white-labeling for most users is limited to changing the color theme and adding your logo.
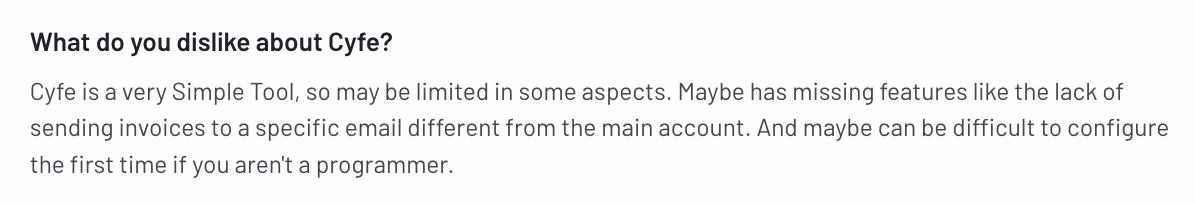
One G2 user stated the same and said simply, “Cyfe is a very simple tool, so it may be limited in some aspects.”
❌ Lack of advanced data transformation
This is a big one.
Cyfe doesn’t have the tools to blend cross-channel data, create custom tiers and totals, or unify data at scale—a drawback especially for agencies with diverse client needs.
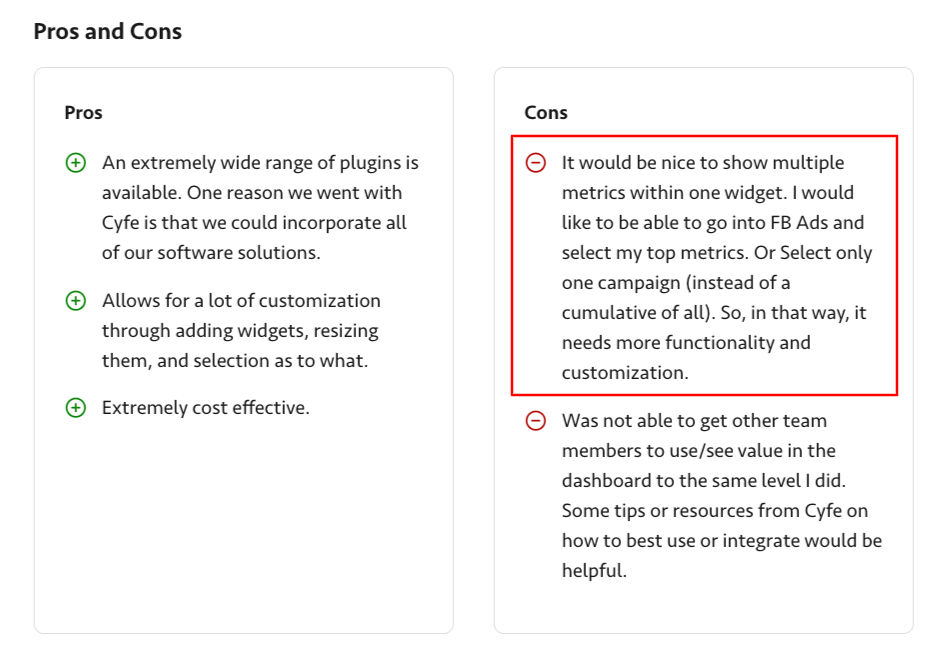
One user pointed out this issue and said simply:
“It would be nice to show multiple metrics within one widget.”
❌ Poor customer support
This was another con apparent from user reviews—Cyfe’s customer support is limited.
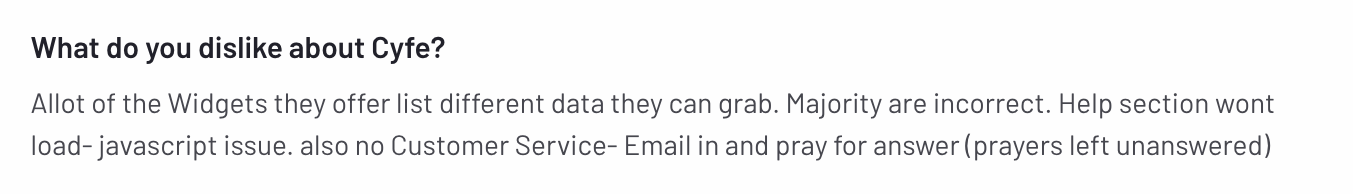
The only way to contact support (even on the most expensive plan) is via email, and users like Jason J. say, “You have to pray for an answer.”
Plus, Cyfe’s team doesn’t update the help center (or the product), which indicates that no one is working to improve this situation.
Feature Deep Dive #1: Cyfe Ease of Use
Let’s continue with an important discussion, Cyfe’s ease of use.
More specifically, are there ready-made templates and widgets, and is it easy to edit dozens of reports quickly?
This is what we found out:
Are there ready-made templates and widgets?
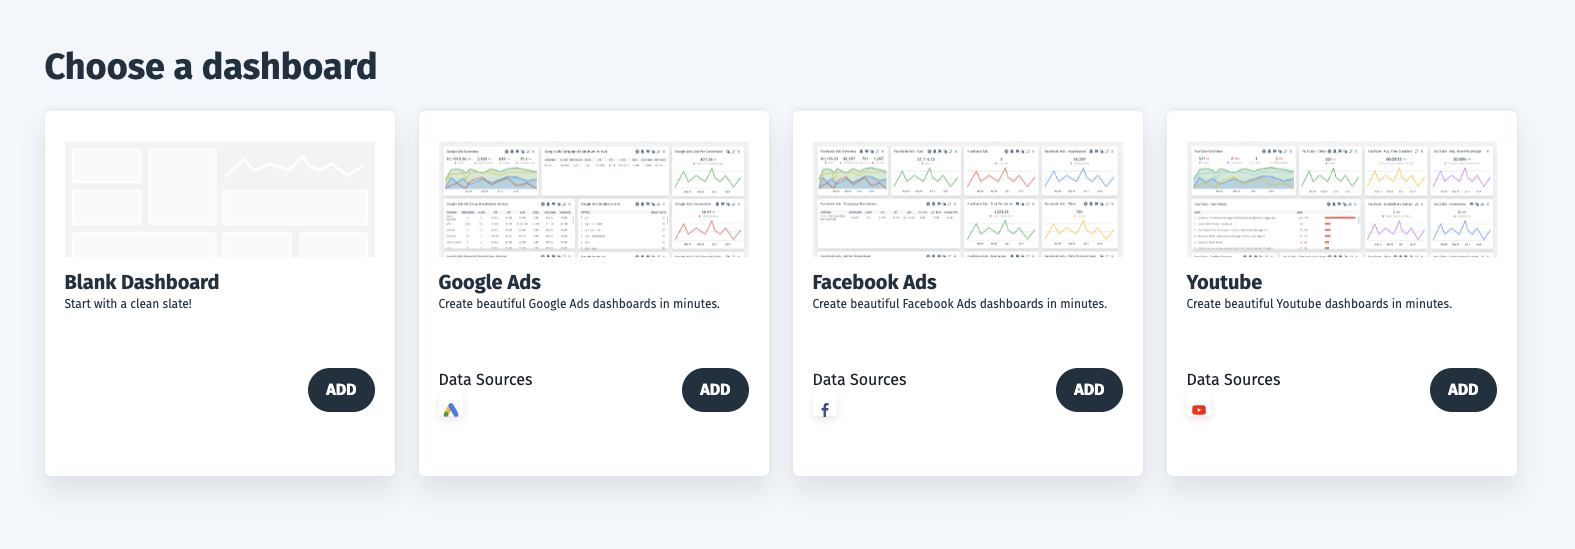
Ready-made templates exist, but unfortunately, they didn’t live up to expectations.
Cyfe shows on its website that eight different templates are available for Facebook Ads, Google Ads, YouTube, web analytics, and so on.
Yet, after we signed up, we found there were only 3 templates:
 But what about ready-to-use widgets—can they make things better for Cyfe?
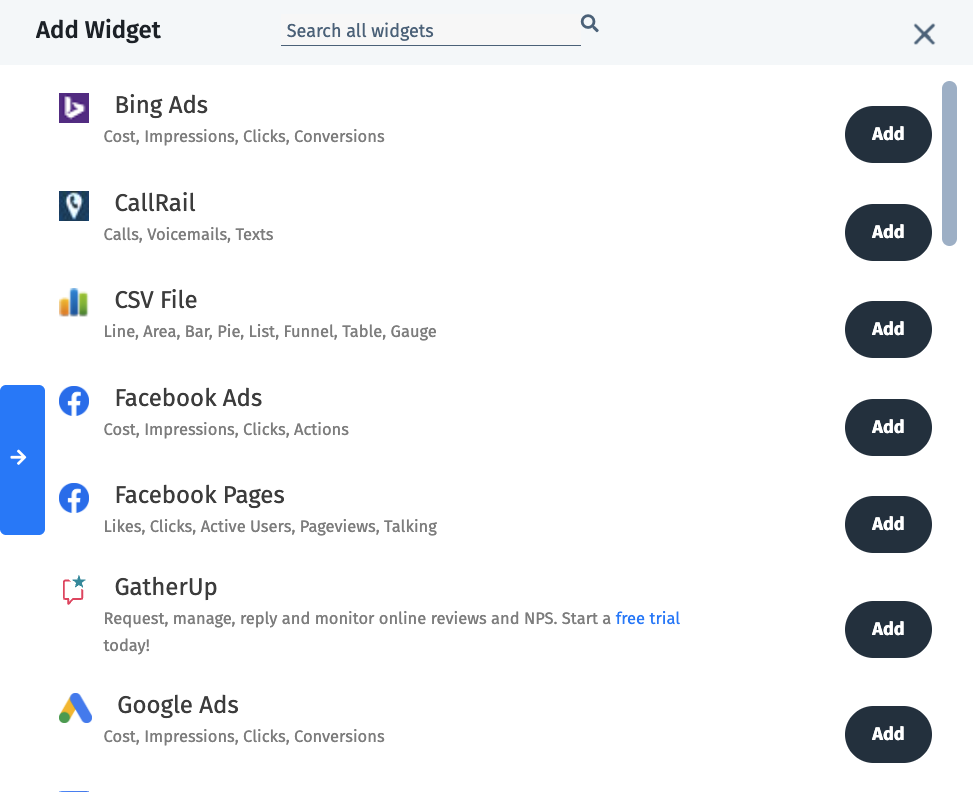
Unfortunately, Cyfe doesn’t offer any ready-to-use widgets.
With each new widget you add, you need to pre-configure it yourself.
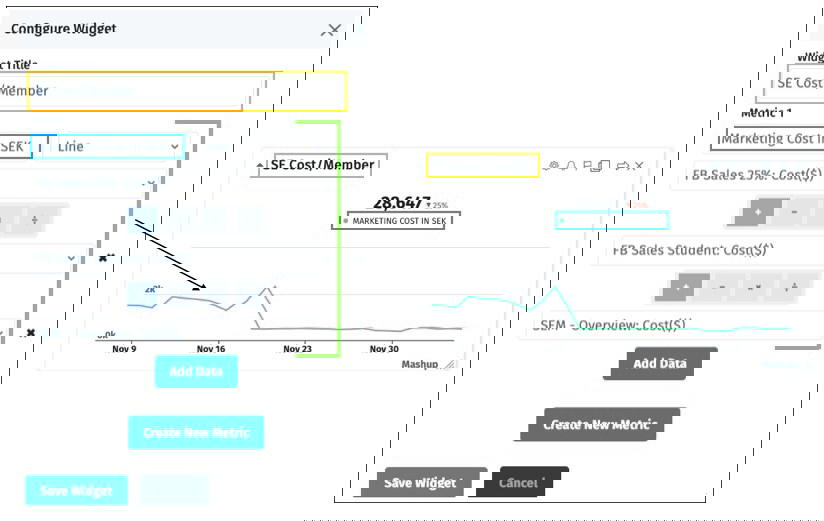
This means, each time you create a widget, you need to:
- Select your data source and click on “Configure Widget”
- Name the widget, choose the right account, pick the page, and finally select a specific metric—like Profile Views
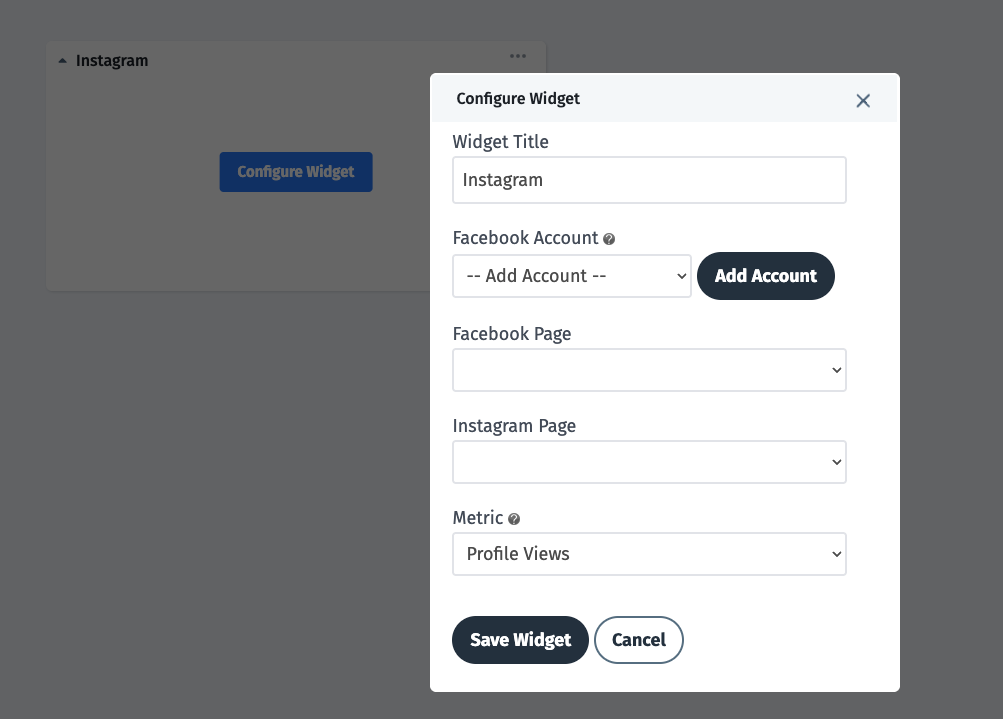 This is really time consuming—especially if you’re creating 10+ widgets across 50+ dashboards.
And this is the reality for most users, since Cyfe has only three dashboard templates.
We truly believe there is a better way.
For example, with Whatagraph, you can simply drag and drop new widgets into your dashboards.
 You don’t need to switch between multiple pages, you can simply choose from the pre-made widgets or create your custom metrics.
Plus, Whatagraph offers 40+ ready-to-use dashboard and report templates that spread across multiple categories, like:
- Analytics
- Paid advertising
- Social media
- Search
- Video
- Call tracking
No matter your reporting needs, you can be sure to find a helpful Whatagraph template.
How easy and fast is it to edit dozens of reports?
If you’re working with dozens of reports, you’d probably appreciate the ability to edit them in one go, instead of one by one.
This isn't possible on Cyfe, although you can duplicate individual dashboards to create new reports.
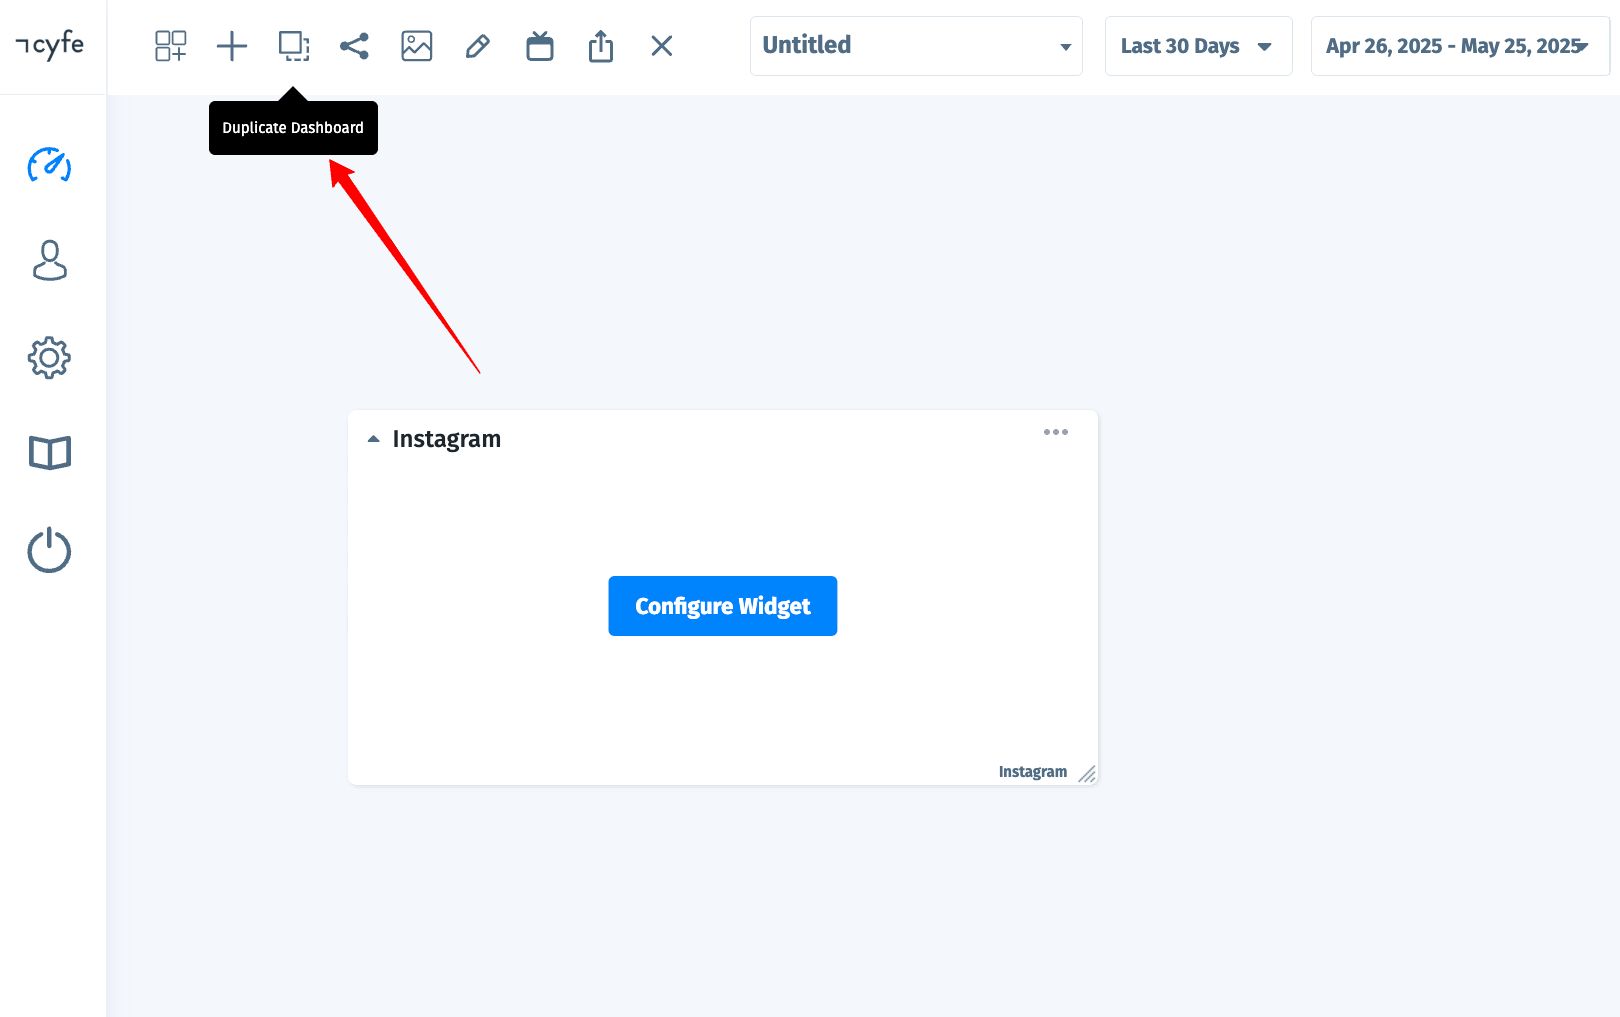 Duplication helps, but it’s far from what most teams need.
Whatagraph, for example, offers linked templates. Once you’ve built a report with the layout and style you like, you can save it as a “Master template” and reuse it across different client dashboards.
If you ever need to make updates, you can edit the Master template, and the changes will automatically apply to every linked report.
Feature Deep Dive #2: Cyfe Integrations
Cyfe says the platform has “over 100 integrations,” but we quickly found that only 25 integrations are natively available, which was a bit of a bummer.
You can find native integrations with data sources like Facebook Ads, Google Ads, Bing Ads, HubSpot, MailChimp, and Zendesk.
If you only import data from the most general platforms (e.g., Facebook and Google Analytics), Cyfe’s integrations may be enough.
However, if you need integrations with:
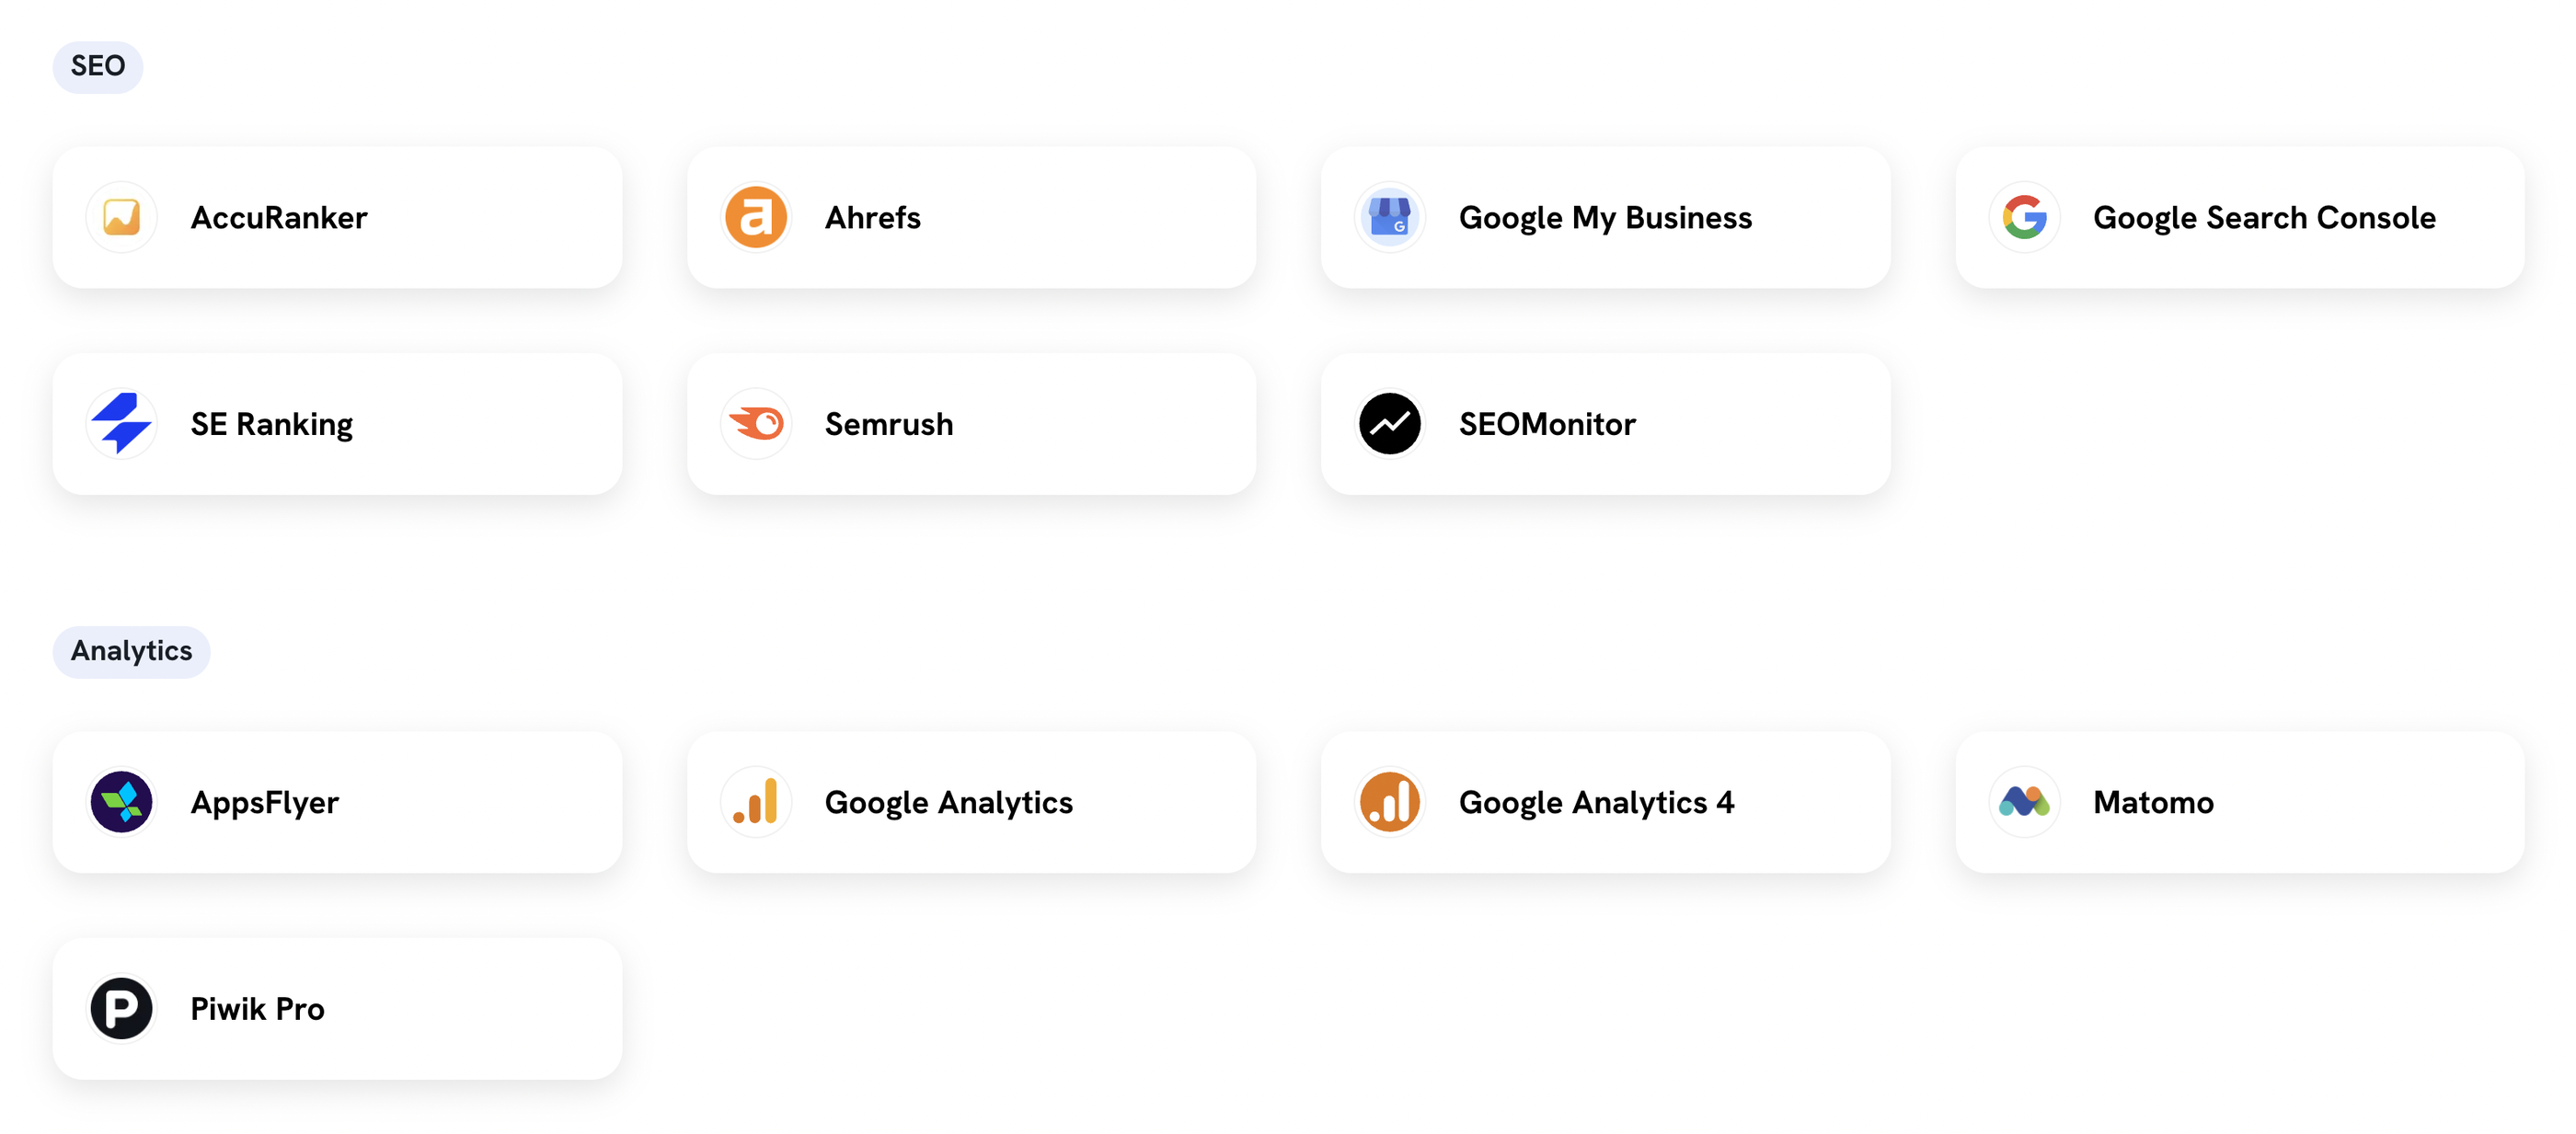
- SEO platforms, like Ahrefs, Semrush, and SE Ranking
- Ecommerce platforms, like Shopify, BigCommerce, and Magento
- Email marketing platforms, like Klaviyo, ActiveCampaign, and Constant Contact
- Paid ad platforms, like Reddit Ads, Spotify Ads, Snapchat Ads, and LinkedIn
- CRM platforms, like Salesforce
Then, the integrations aren’t simply enough.
It’s possible to do integrations manually through API, SQL database connections, and CSV files, but this is highly time-consuming.
In contrast, Whatagraph offers 55+ native integrations with different analytics, PPC, social media, SEO, ecommerce, and email marketing platforms.
 Access to Whatagraph’s wide range of integrations means:
✅ You spend less time manually pulling data from different platforms
✅ There are fewer chances of human error, like missing records, duplicates, or data inconsistencies
✅ You can scale your reporting with no increase in workload
Plus, we offer a dedicated page for managing your integrations—a feature Cyfe lacks.
From Whatagraph’s Data sources page, you can:
- Connect new data sources easily and use them across all dashboards
- Filter connections by channel or the team member who added them
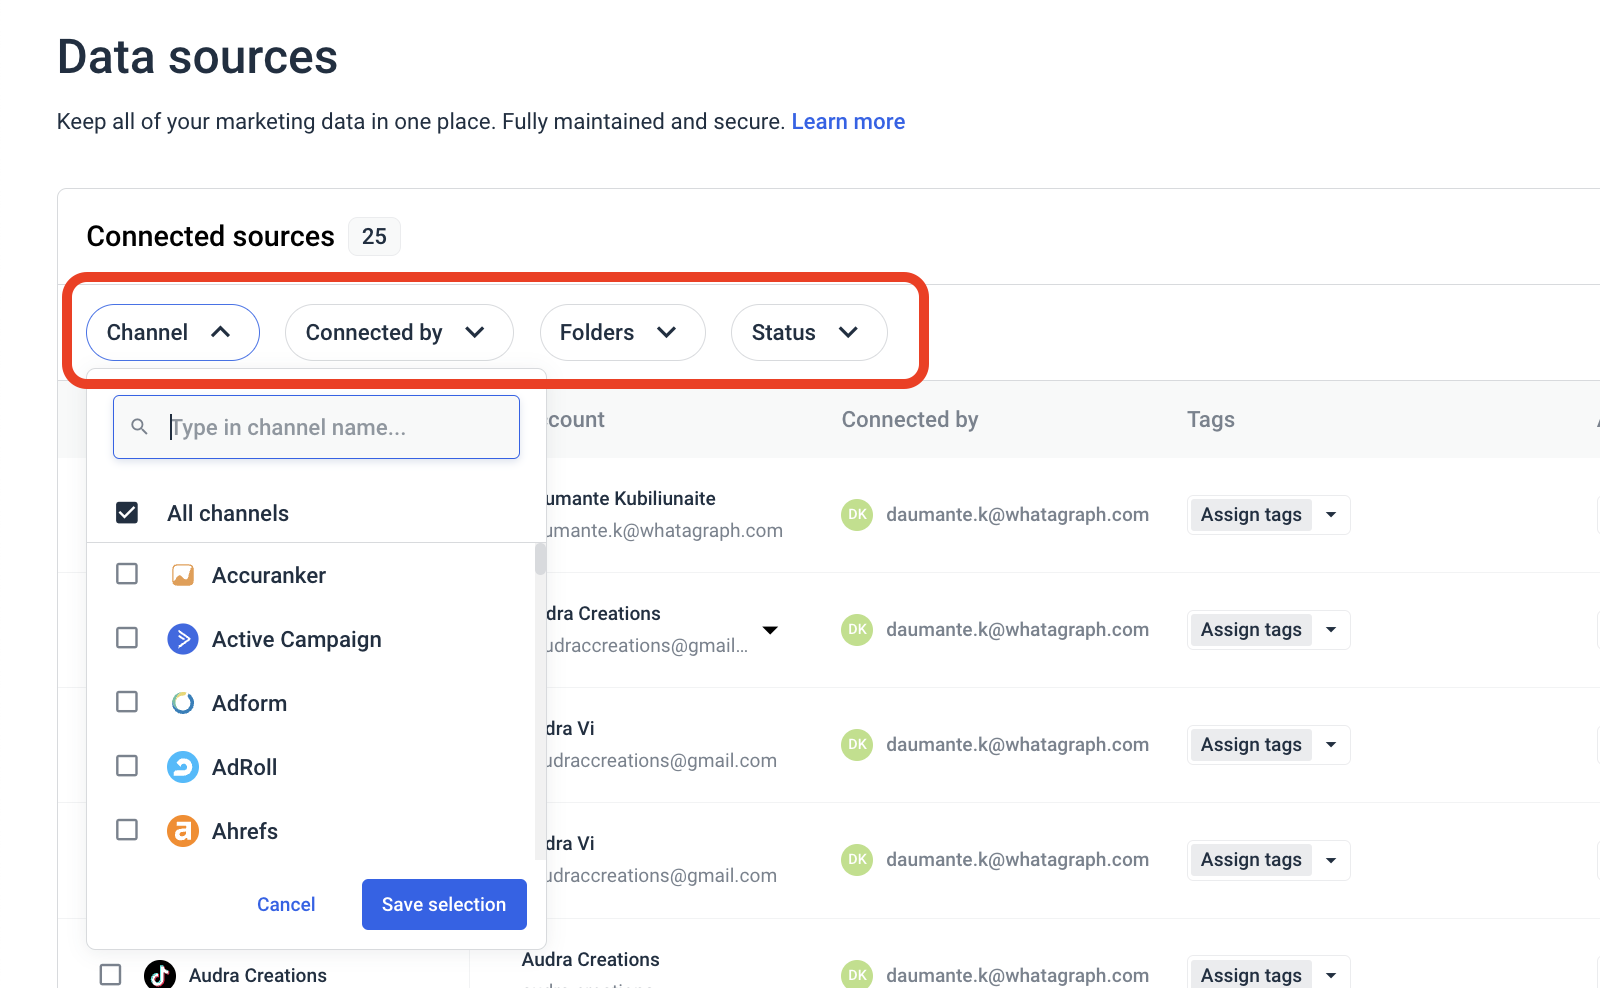
- Add custom tags (e.g., region, brand, Account Manager)
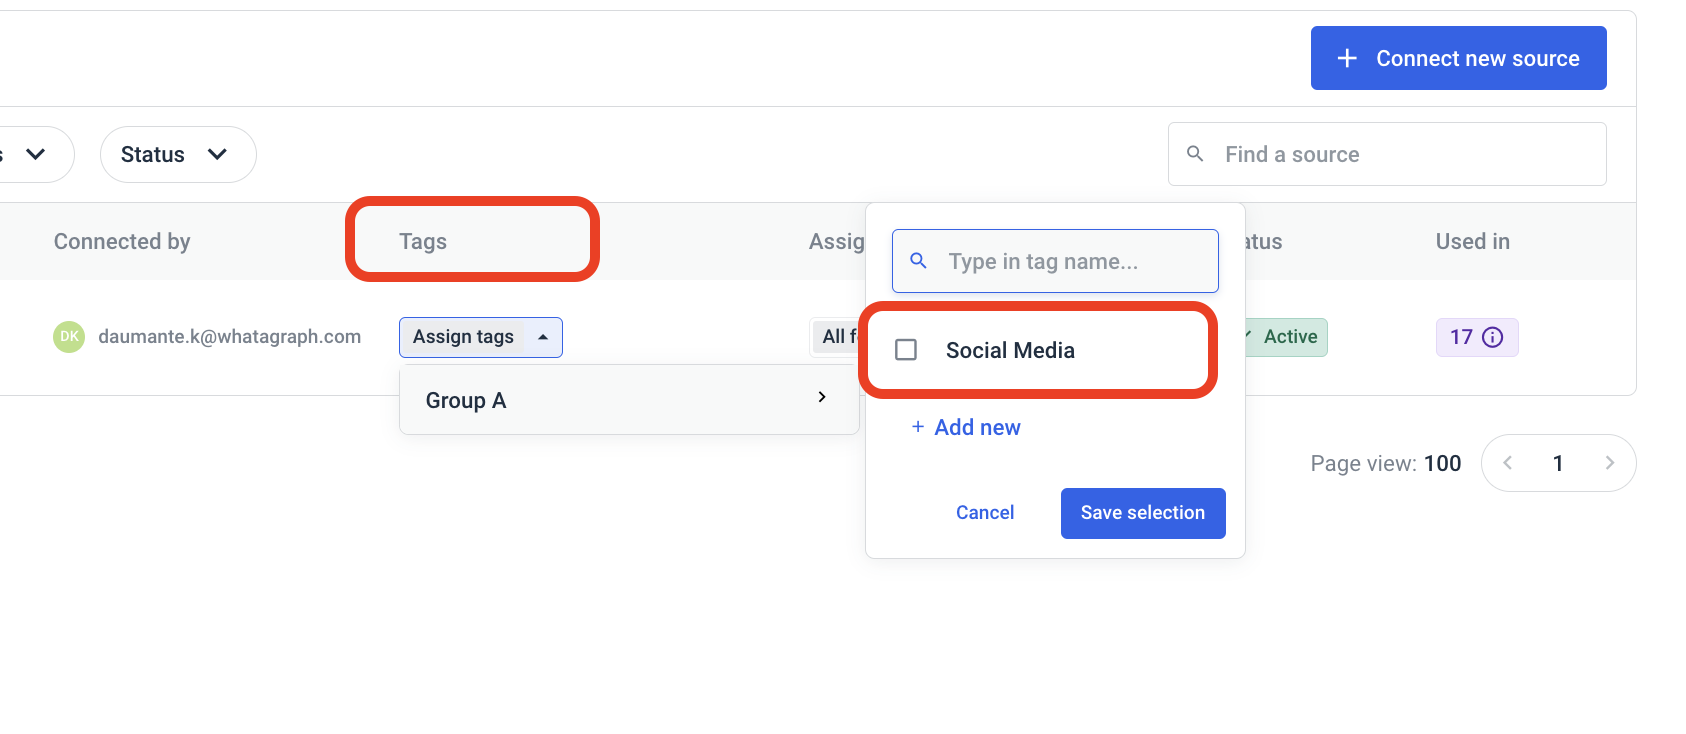
- Group sources into folders like “Q3 campaigns” or “Client C”
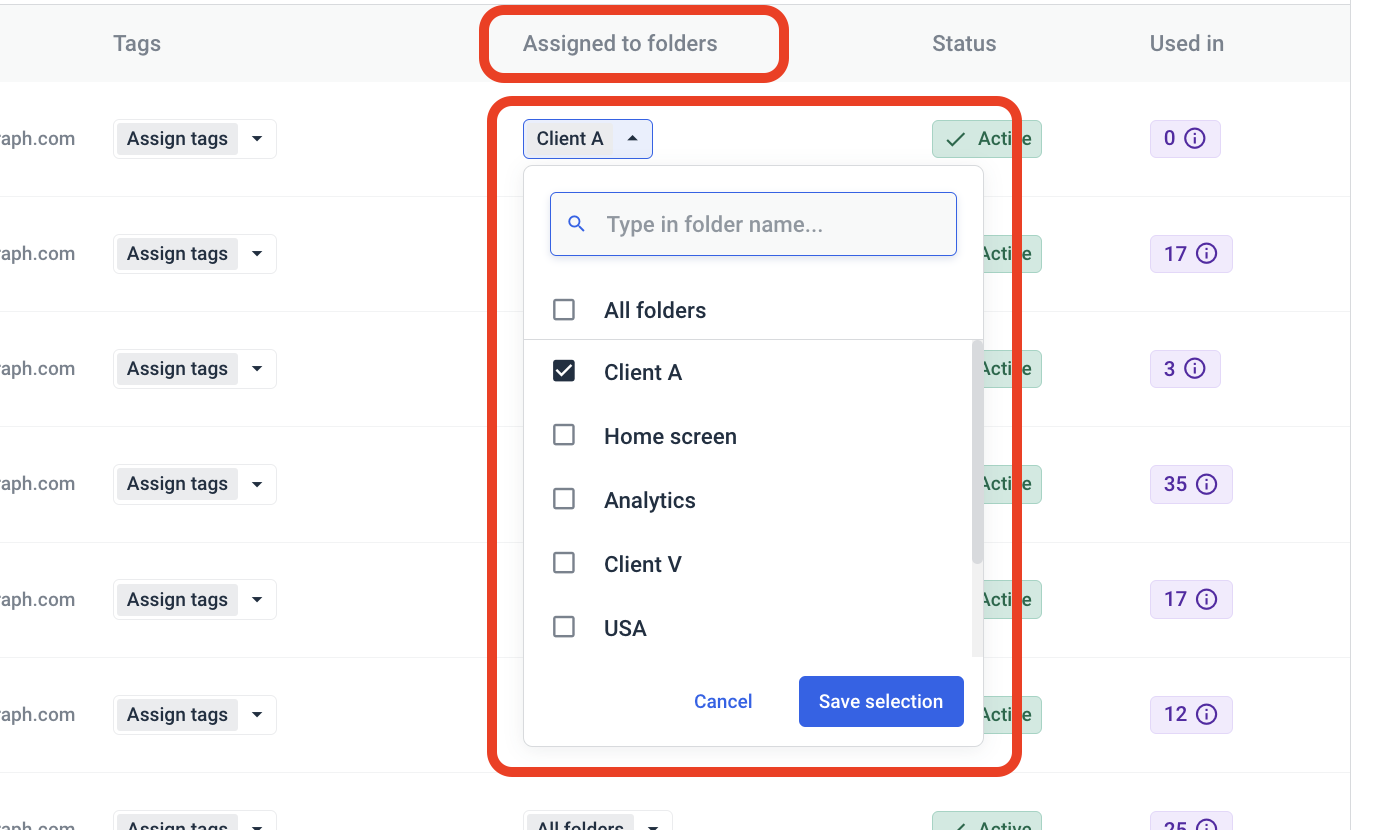
These are all features that aren't available on Cyfe.
Are Cyfe's integrations reliable?
Cyfe’s integrations are considered reliable. We found no reviews complaining about this, nor did we encounter any issues ourselves.
However, one concern is that Cyfe doesn’t share its data refresh rates.
This means it's unclear how long it takes for data to update in your dashboards, which can lead to data inconsistencies.
At Whatagraph, we offer a consistent 30-minute data refresh across all reports, sources, or data blends.
This means the data on your reports is always up-to-date every 30 minutes, without having to manually trigger a data refresh.
And this means, if you gave your client access to a live report, they'll be able to see up-to-date data every 30 minutes, giving them peace of mind that the campaigns are going well.
Cyfe offers 25 integrations with general marketing platforms and supports API, SQL, and CSV connections, but lacks transparency on data refresh rates.
Feature Deep Dive #3: Data Blending, Custom Metrics, and Filtering on Cyfe
Custom metrics and data blending are where Cyfe starts to really show its limitations—let’s break it down.
Can you blend data from different sources in Cyfe?
There is a “Mashup” widget for blending data from different sources, although it’s limited.
Cyfe only showcases three use cases for the Mashup widget on this page, which are:
- To combine ad costs across multiple platforms
- To calculate the cost per impression
- To track/compare keyword rankings
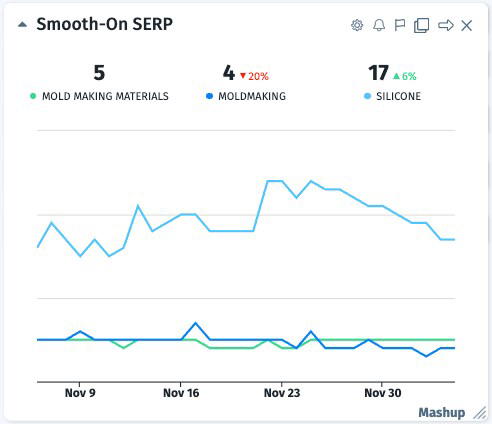
If you need to unify data at scale, blend cross-channel data, or create custom tiers and totals, Cyfe runs out of capabilities.
Can you create custom metrics for formulas?
No, Cyfe doesn’t let you create calculated fields or apply custom formulas. You’re stuck with whatever default metrics Cyfe has for each data source.
It is possible to group widgets next to each other to highlight relationships between them. But that’s pretty much it.
Whatagraph, comparatively, has an entire dedicated page for data organization, called “Organize.” From this page, you can:
- Create custom formulas using a very simple set up
- Blend data from different channels to get a more holistic view of performance
- Create custom metrics and dimensions to standardize data
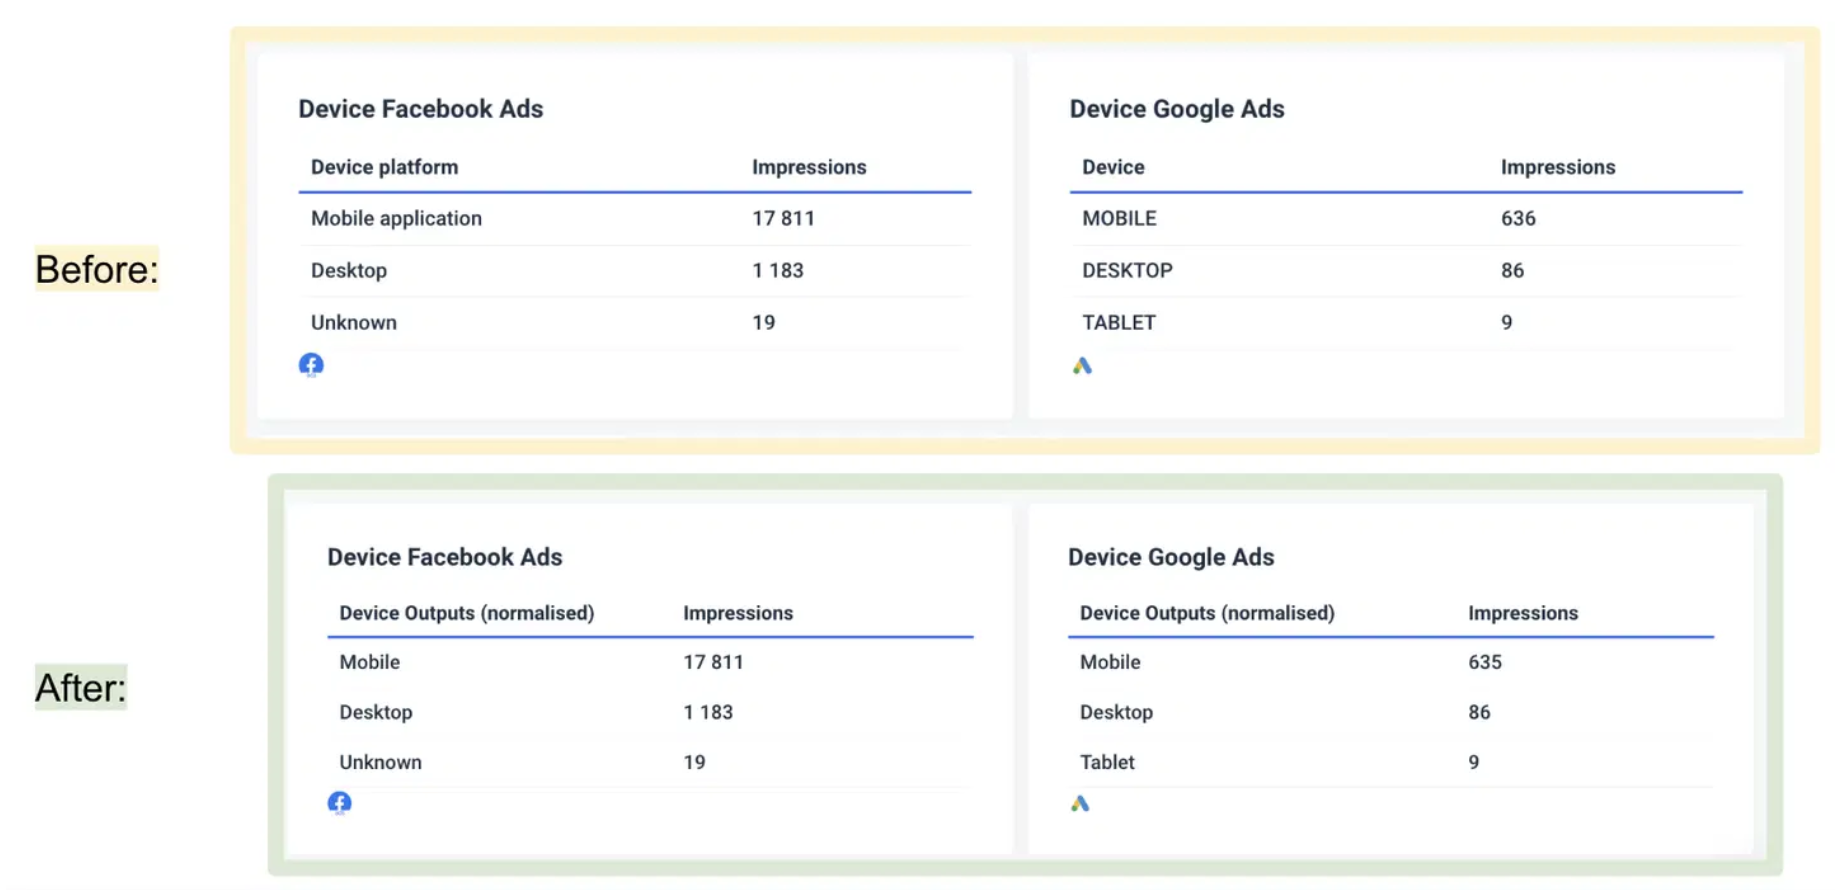
You can create all of these custom metrics and blends natively inside your report. There's no need to switch back and forth between two (or more) pages.
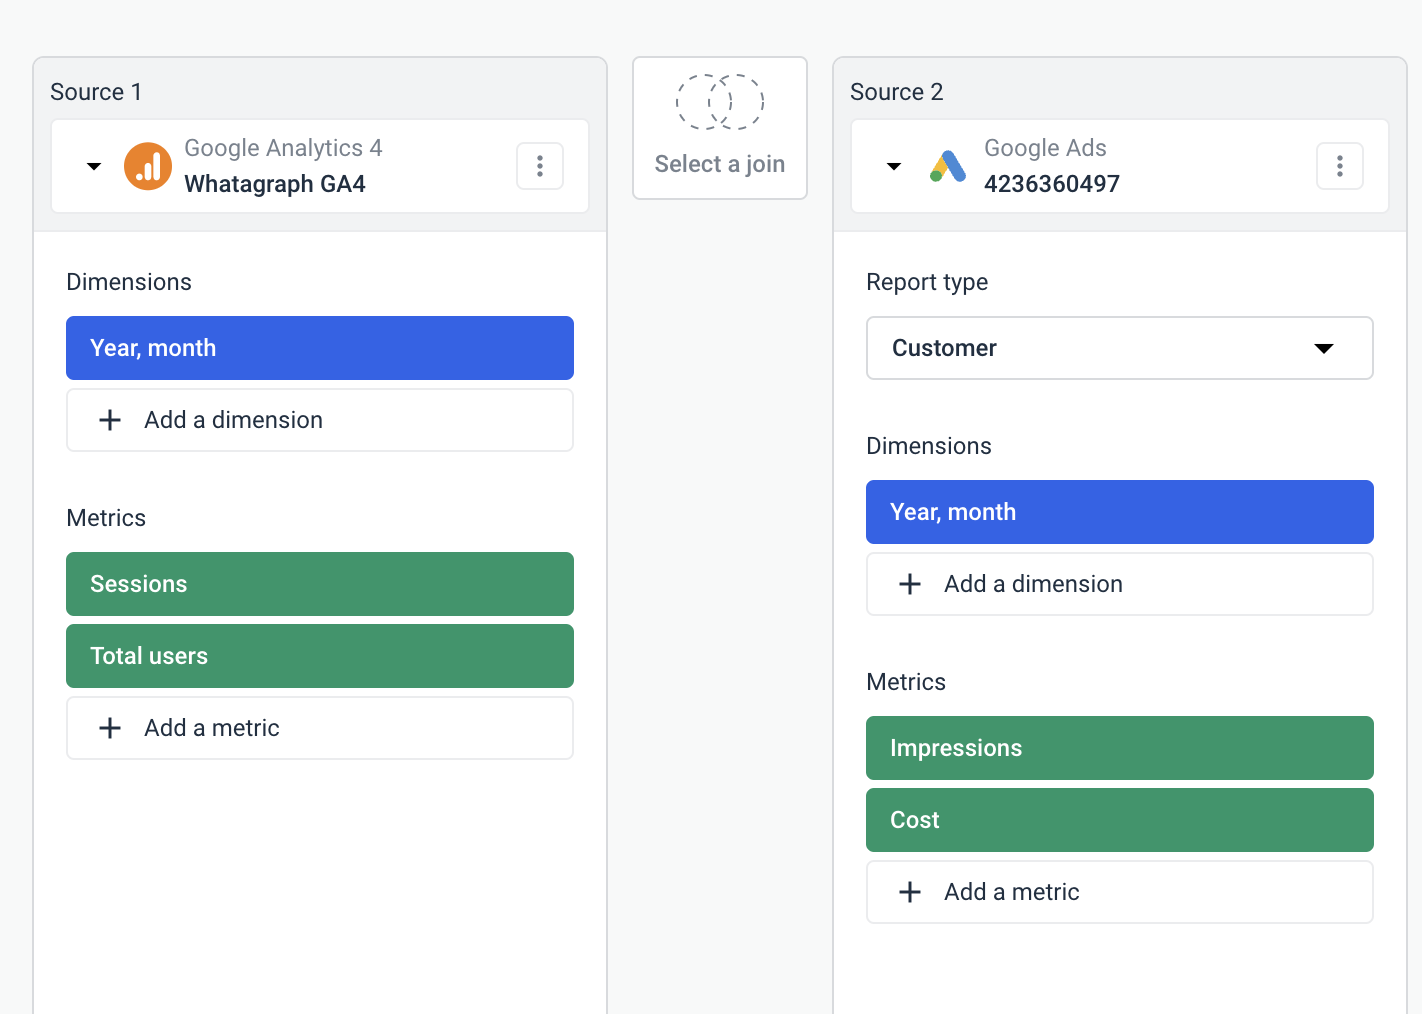
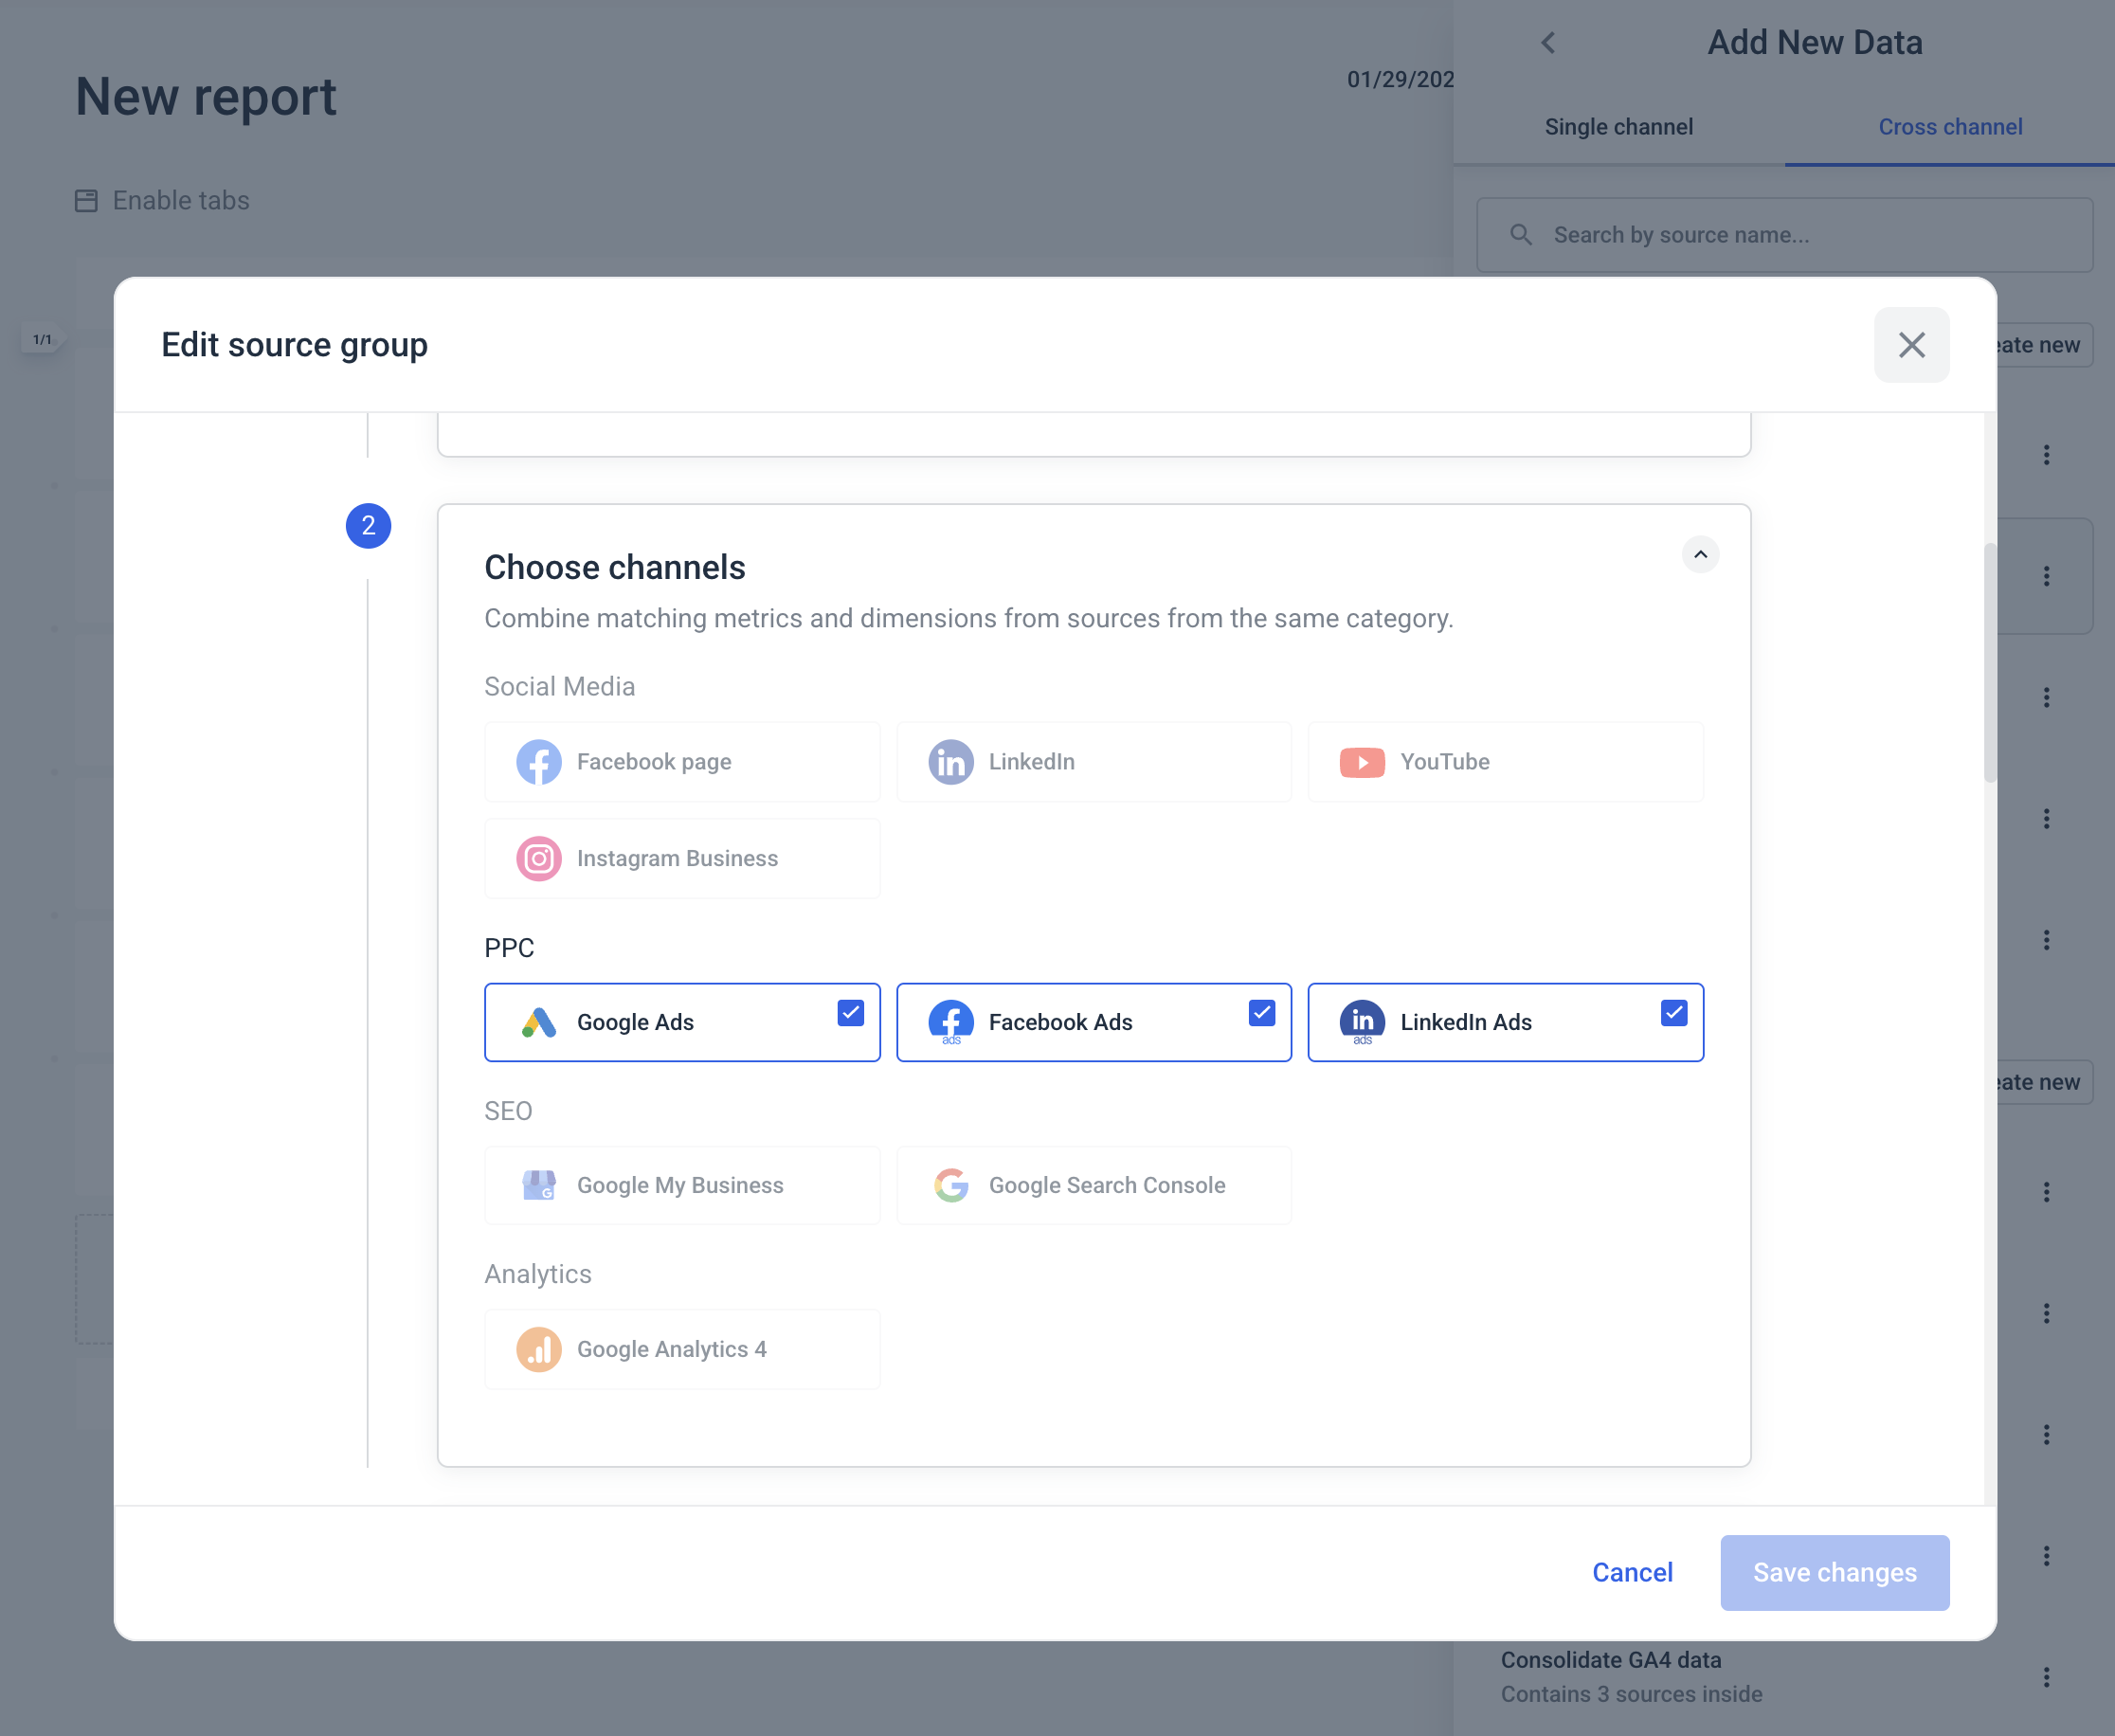
What's even better? You don't even need to create custom formulas or data blends anymore. You can simply combine sources from the same categories into one “Source Group” and report on their aggregated metrics.
For example, say you have paid-per-click campaigns on Facebook Ads, Google Ads, and LinkedIn Ads and you want to see the total ad spend on these three channels.
You can simply combine the ad spend from them into one “Source Group” in seconds.
 Then, you can show the total ad spend from all three channels in one aggregated widget like so:
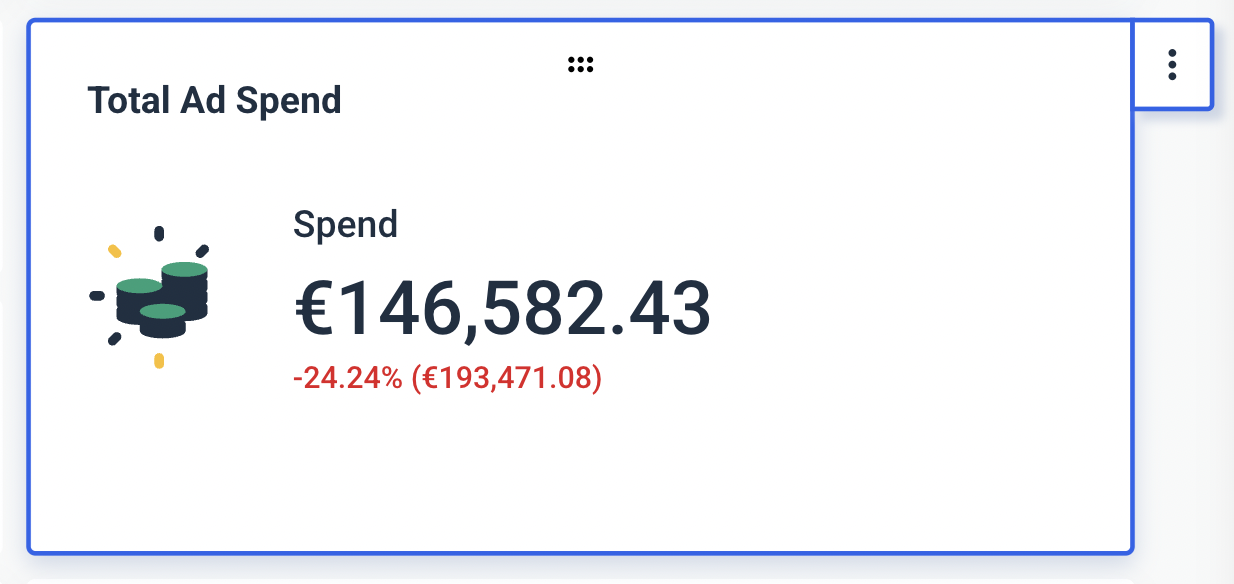 This saves you so much time and hassle of manually creating data blends, and you can show a more holistic view of performance to your clients.
In fact, this holistic reporting is what Tanja Keglić, Performance Marketing Manager at Achtzehn Grad agency, loves about us. She raved in this case study:
The biggest reason we chose Whatagraph was because of its holistic approach to reporting. We can blend data from different channels and see in one view what's the performance and what needs to be changed.
Cyfe’s Mashup widget allows basic data blending, but falls short for those wanting to create calculated fields or apply custom formulas.
Feature Deep Dive #4: Cyfe Reports and Dashboards
This is an important one: how customizable are Cyfe’s dashboards and reports? Let’s discuss this area in detail.
How customizable are the dashboards?
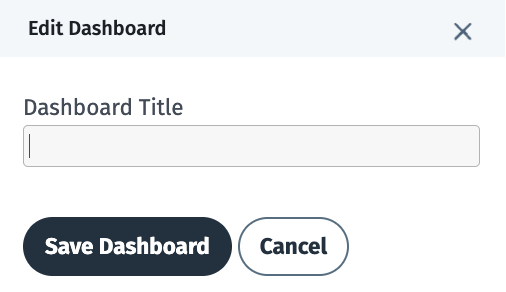
Cyfe’s dashboard editor gives users a few customization options. You can:
- Change the dashboard title: You can choose a title for your dashboards.
- Add new widgets: The widgets include Cyfe’s 25 integrations, text and image fields, Mashup for combining multiple widgets, and API widgets.
- Configure widgets: For each widget, you can choose a title, ad account, campaign, action type, and metric.
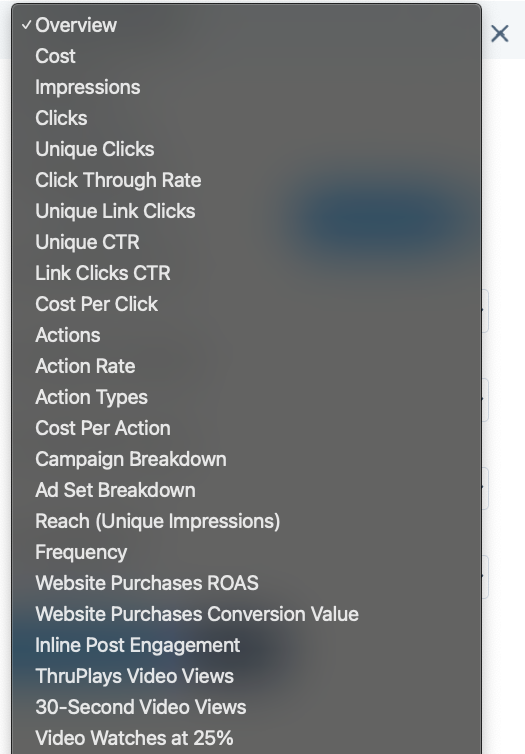
- Choose data source metrics: Depending on your data source, each widget has a number of metrics you can choose from. For example, these are the options for Facebook Ads:
- Modify the dashboard layout: After adding new widgets, you can move them around, resize them, and duplicate them.
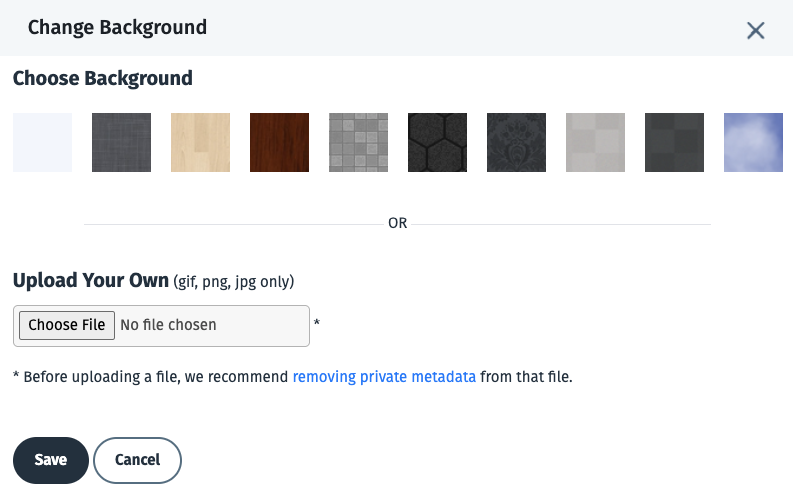
- Change background: Choose from 10 background themes or upload your own background.
 And that’s pretty much it.
Cyfe is a basic data visualization tool, which is evident in its simplistic customization options.
There isn’t much you can do, which works for some users and doesn’t for others.
For those who need more, Whatagraph is a better choice. For example, you can:
- Rename individual metrics
- Change or remove icons
- Apply custom formulas (e.g., blend metrics from multiple sources)
- Adjust date ranges and currencies
- Add or hide footers
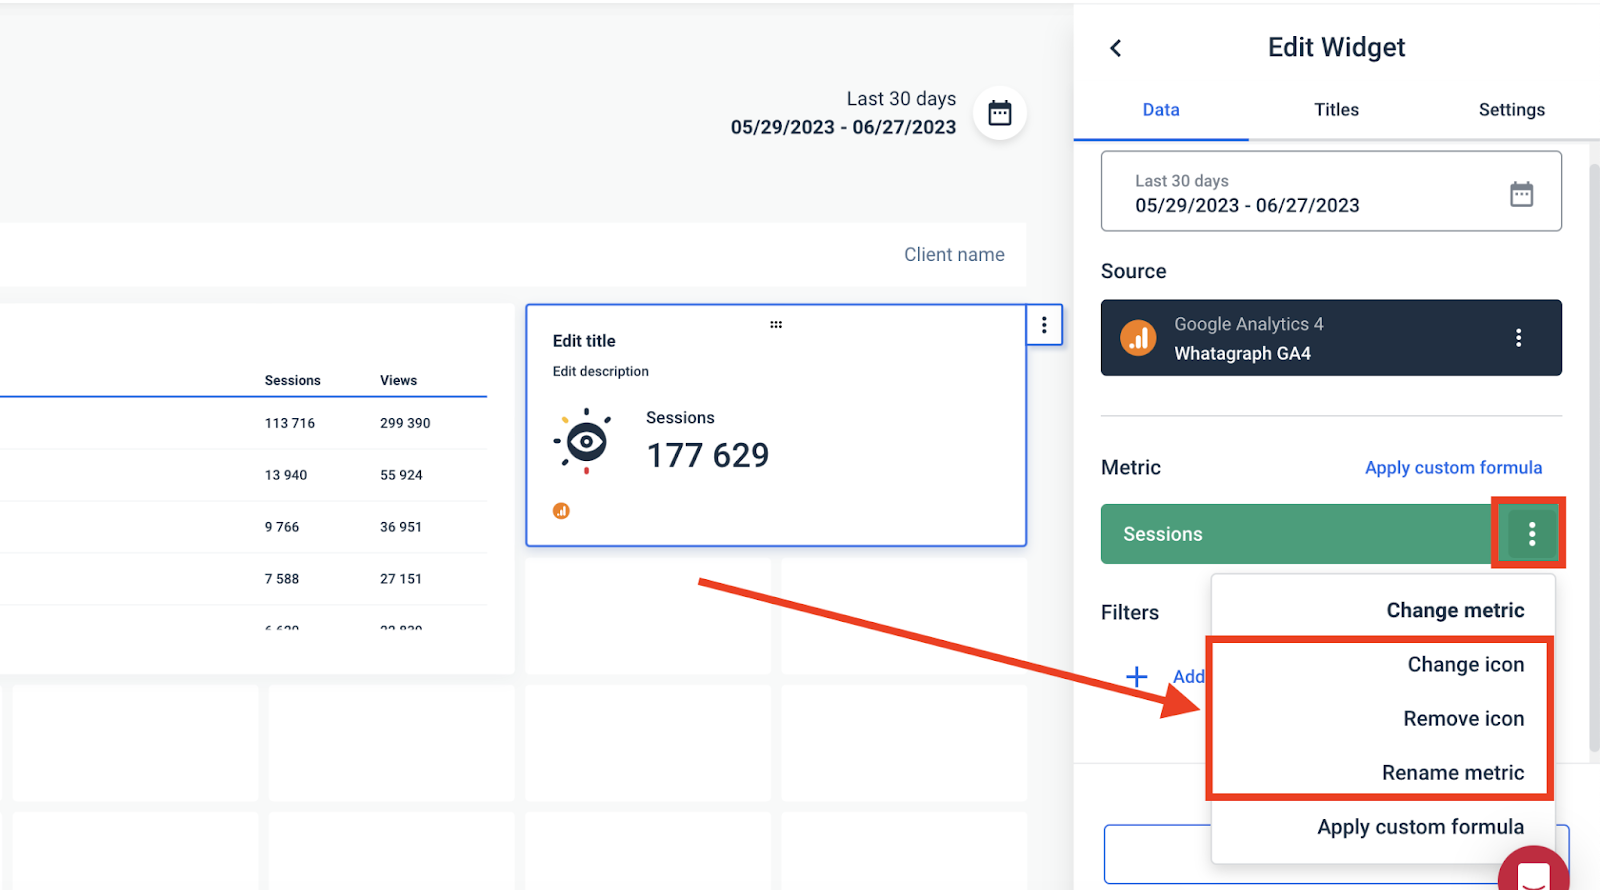
You can also choose any icons you want from our icon library to make your widgets “pop” more.
![]()
Plus, you can also change the color scheme of the widgets however you want:
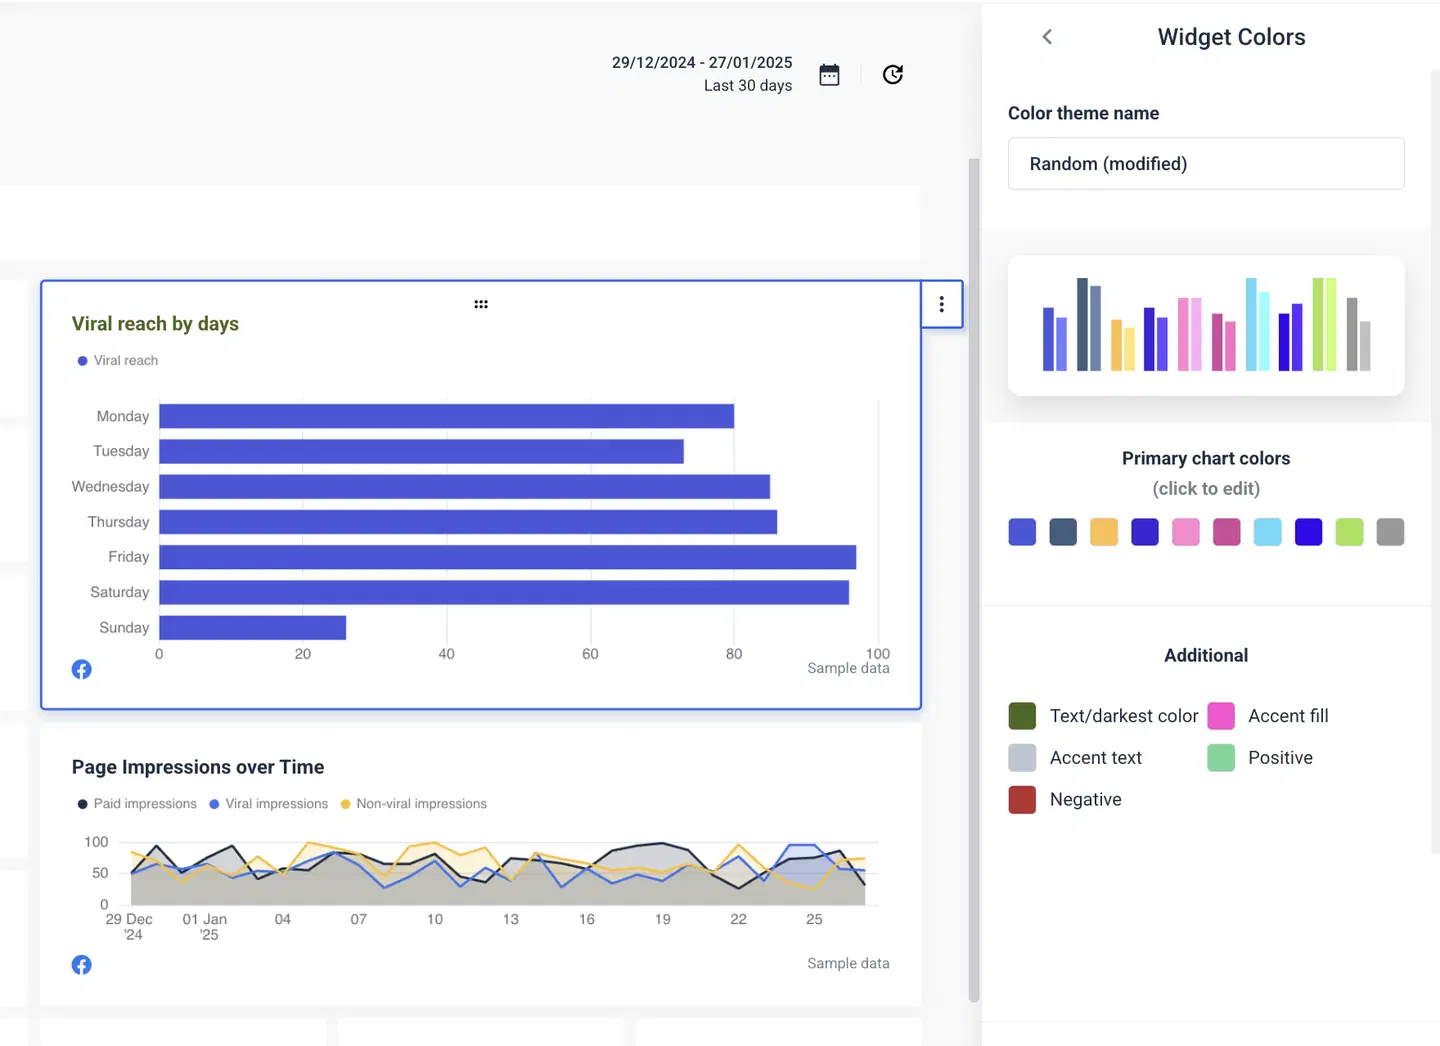 Satisfied with how your widgets look? Save them as templates so you can reuse the same style the next time:

These widgets are fully responsive, and you can resize them both horizontally and vertically.
Is white-labeling available?
As we shortly mentioned, Cyfe gives the option to change the background theme and add your own logo.
You can also:
- Add a custom domain
- Customize outgoing email messages
- Customize the CSS
All of these changes can be done from the “Settings” page:
These white-labeling options may be enough for small businesses, but are very limited for marketing agencies that need full white-labeling.
For example, Whatagraph allows all users to:
- Add custom logos and domains
- Change the color schemes in your reports
- Pick different colors for charts and graphs
- Customize the automated emails for clients
- Send your reports on a custom email domain
Another disappointing thing was that we discovered bugs using Cyfe’s white-labeling features.
After we applied a background to our dashboard, it didn’t let us change it back to any other color:
Is this a bug only some users experience, or does this affect everyone? We’re not sure, but it doesn’t help Cyfe’s already limited white-labeling features.
What sharing options are available?
Dashboard sharing is an area in which Cyfe is strong.
You’ve got many options for sharing reports:
- Via an email: Schedule an email to be sent to one or multiple email addresses.
- Via file: Share entire dashboards or individual widgets via PNG, JPEG, PDF, or CSV formats.
- Via link: Create a shareable link to your dashboard that can be password protected.
- Via TV: Share your dashboard with a TV/big screen.
Truthfully, most of these sharing options are industry standards. But the TV sharing, for example, is more of a unique option.
Are there AI insights available?
Cyfe doesn’t offer AI insights or any other AI features. Instead, you need to manually explain campaign performance in the text fields, which can be time consuming.
At Whatagraph, we’ve solved this issue with two innovative AI features:
- AI summaries: Our AI summaries feature automatically summarizes your data, which you can add directly to your reports.
- AI chatbot: Our AI chatbot answers any questions you have about your marketing data. For example: “What were the three best-performing campaigns last month?”
How easy is it to monitor marketing performance?
What if you want to track your internal team’s performance? Does Cyfe offer features for that?
Unfortunately, Cyfe doesn’t have any features available for this.
This means:
❌ You need to log into multiple platforms daily to get a high-level overview
❌ You need to manually track KPIs across spreadsheets, dashboards, and emails
❌ You need to spend hours each week piecing together data
Because of these pain points, we launched our Goals & Alerts feature at Whatagraph.
With it, you don’t need to sift through data by logging into native platforms.
You can:
1. Create a single Overview dashboard to track KPIs across all campaigns, clients, or team members
2. Set goals (targets, limited, or ranges) for each KPI
3. Get daily or weekly alerts via email, Slack, or directly in Whatagraph when performance is on or off-track
Our early testers are already seeing the impact of this feature. Chantelle Bowyer, Founder and CEO at Metis Marketing, said:
We needed a way to stay on top of client budgets without having to constantly log into native ad platforms. Whatagraph took that feedback and built Goals & Alerts, so we get notified timely when performance needs attention and spending goes off track. And I have to say...it’s epic!
Basic dashboard customization and white-labeling features are available on Cyfe, but there are no AI insights or performance monitoring tools available.
Feature Deep Dive #5: Cyfe Security
Security is another important factor. But how does Cyfe stack up in this area? Let’s find out.
How does Cyfe approach data encryption?
Cyfe uses Amazon Web Services to store its data, which stores data in a secure environment.
Cyfe says, “We take data & client privacy & security seriously. Nobody in our own company has access to your data, nor do we ever share client data with third parties.”
Are they covering GDPR basics?
Unfortunately, Cyfe doesn’t have any information on whether they’re covering the GDPR basics or not. This is somewhat concerning, since GDPR compliance is mandatory if you collect data from EU residents.
Can you control access to dashboards (role-based access control)
Yes, role-based access is available, but it is a bit limited.
You can add new admins to individual dashboards, but there is no way to give someone access to create new reports or manage integrations.
This means, most management tasks need to be done from one account, which is practically impossible for larger teams.
What about single sign-on (SSO)?
SSO is especially important for enterprises, and Cyfe offers it as part of the Agency plan.
So, where does it fall short for enterprise teams?
Regarding Cyfe’s security, there are two areas of concern for enterprises:
1. There is no information on whether Cyfe covers the GDPR basics or not
2. Role-based access control is limited to only adding users to individual dashboards
Data encryption is handled through AWS, and SSO is available for agencies, but the limited role-based access and unclear GDPR compliance raise concerns.
Feature Deep Dive #6: Cyfe Customer Support
We already touched a bit on Cyfe’s customer support, but here’s more information about it.
The customer support was a concern for users, and unfortunately, we can agree on that.
Even on the most expensive plan, the only way to reach support is via email and users say “you have to pray for an answer.”
On Cyfe’s admin dashboard, there is a support section with the following information:
 As you can see, there isn’t much information or encouragement from Cyfe’s team to reach out for help.
Cyfe’s knowledge base is also mentioned—is it helpful for users?
The knowledge base generally covers key areas, such as getting started, best practices, and how to use widgets.
However, a big red flag was that most of the articles were updated last in 2021, nearly four years ago. Plus, there have been no article updates in the past three years.
It really seems like Cyfe doesn’t actively update its platform anymore…
Other signs on their website, such as the 2020 G2 badges, also indicate this:
This is actually quite sad to see, and as a user, I wouldn’t want to be “stuck” with a platform that doesn’t update its website or help center articles (and likely their own product).
On Whatagraph, all users (no matter your plan) get access to a dedicated Customer Success Manager and a live chat support with 1 minute first response times.
Your CSM can help you with:
- Creating reports
- Organizing your data
- Connecting your data sources
- Migrating data from your current platform
- Anything else you need help with
This is why users like Kim Strickland, Digital Marketing Specialist at Peak Seven love Whatagraph. She says:
I've joked about this often—with Whatagraph, we're not paying for a reporting system. We're paying for customer support. There's a level of dedication from the Whatagraph team that you don't often experience anywhere else.
Cyfe offers email support, but users say it's unreliable. Plus, the help center isn’t being updated, which raises concerns.
How does Whatagraph Compare Against Cyfe?
We’ve now looked at Cyfe in detail, the areas where it's strong and where it falls short for users.
Let’s now compare it to Whatagraph, one of the main Cyfe alternatives.
What is Whatagraph?
Whatagraph is an all-in-one data platform that makes it easy to connect, organize, visualize, and share your data in one place.
Here’s how Whatagraph solves many of the problems Cyfe users face:
✅ 55+ fully-managed integrations
- The Cyfe Problem: The 25 integrations only cover the most general marketing platforms, and the majority of ecommerce, email marketing, SEO, and paid ad platform integrations are missing. Plus, there is a lack of information about data refresh rates and no way to export data to warehouses or business intelligence tools.
- The Whatagraph Solution: All 55+ of our integrations are fully managed, meaning they’re more seamless, stable, and reliable. You can work with 10 sources and 100 widgets simultaneously without slowing down the platform. Plus, the data refreshes every 30 minutes, meaning there is no inconsistent data in reports.
This is how one G2 user described our integrations:
Whatagraph's ability to integrate with multiple data sources like Facebook and Instagram to website analytics tools like Google analytics and make a detailed report is great. It's very efficient too which is definitely an upside to any business.
✅ Ready-to-use templates and widgets
- The Cyfe Problem: There are only 3 dashboard templates and no pre-made widgets. Each time you want to add a widget to your report, you need to configure it manually on a separate page, which is very time-consuming.
- The Whatagraph Solution: 40+ ready-to-use dashboard and report templates are available, and you can choose from 100s of pre-made widgets. No back-and-forth between multiple pages—simply drag and drop new widgets onto your dashboard.
The pre-made widgets are available as charts, graphs, tables, and more, which our users appreciate:
Whatagraph provides pre-designed report templates and customisable visualisations such as charts, graphs, and tables to show data clearly and entertainingly.
✅ Fully white-labeling features
- The Cyfe Problem: Cyfe’s white-labeling is limited to adding your own logo and changing the color theme. You can’t add custom icons, change the fonts, modify the footer or header, etc.
- The Whatagraph Solution: With Whatagraph, you can add custom logos, domains, color schemes, icons, headers, personalize the cover page, add comment boxes and headers, and more.
You can save any report design as a template to use later. Whatagraph’s reports are fully customizable, which G2 users like Patrick C. truly appreciate:
Whatagraph is extremely flexible, and the visuals are beautiful, which is important for having clients be engaged in the reports. It’s very customizable to make complex data easy to ingest for the client.
✅ Powerful (but easy) data transformation
- The Cyfe Problem: Aside from the “Mashup” widget, which lets you combine data from different widgets in your dashboard, there isn’t much else data blending you can do with Cyfe.
- The Whatagraph Solution: In Whatagraph, we have an entire dedicated space (called Organize) for data organization. You can blend metrics and dimensions, create custom formulas, unify names, save new metrics and formulas as templates, and much more.
This simplifies the process of reporting data, as one G2 user said:
One of the standout features of Whatagraph is its flexibility in consolidating data, creating custom metrics, and seamlessly integrating data from various sources. This capability simplifies the process of reporting data, which is crucial in the realm of today's digital marketing and analytics.
✅ Excellent customer support
- The Cyfe Problem: The only way to contact Cyfe’s support team is via email, and the knowledge base isn’t being updated. Even users on the most expensive plan don’t get personalized onboarding and priority support.
- The Whatagraph Solution: All Whatagraph users get access to a live chat and email support and a dedicated Customer Success Manager. You can also always refer to our Help Center, which is constantly updated with new articles and information.
But don’t just take our word for it. See what this G2 user said:
Customer support is exceptionally fast and knowledgeable—every question is answered professionally within minutes.
Want a full breakdown? Check out our guide on Cyfe alternatives.
Final Verdict: When to use Cyfe and When to Switch to Whatagraph
Cyfe and Whatagraph are both data visualization tools, but they’re built for different use cases.
Cyfe is a simple, affordable dashboard tool for tracking KPIs. Meanwhile, Whatagraph is built for marketing agencies that need scalable reporting, deep customization, and advanced data blending features.
That said, here’s a breakdown of when we’d recommend choosing Cyfe and when it makes sense to switch to Whatagraph:
Choose Cyfe if:
- You’re a solo marketer looking for a budget-friendly reporting tool
- You want to build reports from scratch, without relying on templates
- You’re fine with limited white-labeling options (basic color themes and logo)
- You’re okay with slower development cycles and limited customer support
- You don’t need to export data to third-party platforms, like BigQuery or Looker Studio
- You don’t need advanced data blending, filtering, or custom metrics
- You don’t mind setting up widgets manually
Cyfe works best as a low-cost reporting tool for startups or solo marketers.
However, its limited templates, lack of master templates, unresponsive support, and non-existent product updates quickly become bottlenecks for growing agencies.
Choose Whatagraph if:
- You’re an agency owner looking to create automated reports for 10+ clients
- You want a platform with fully-managed integrations that you can rely on your agency for
- You want to speed up creating reports with ready-made templates, pre-built widgets, and master templates for bulk edits
- You want to blend data from multiple sources and create custom metrics and dimensions
- You value responsive support, with <1 minute live chat support response times and a dedicated CSM
- You want fully white-labeled reports with a custom domain, logo, color themes, icons, and more
- You want access to AI insights and performance summaries
Talk to our team to get started.