


TL:DR
DashThis is a beginner-friendly reporting tool that helps small teams quickly create and share simple dashboards using pre-built widgets and integrations. While it’s easy to use and affordable, it lacks the flexibility and data depth growing agencies often need.
Who it’s best for:
Boutique marketing agencies and freelancers looking to automate reporting but that don’t need deep customization, calculated metrics, or cross-channel data workflows.
Key features at a glance:
| Feature | DashThis |
| Integrations | ~29+ native integrations, CSV upload available |
| Stable connections | Users report disconnects and data reliability issues |
| Ease of use | Very easy to learn and set up |
| Data organization | Basic merge widget (with limitations) |
| Customizable reports | Limited customization options |
| Report sharing & automation | Email, PDF, and live link sharing |
| Security | Encrypted URLs, Password protection, Restrict IP addresses, GDPR compliant |
Pros ✅
- Fast setup with pre-set dashboard templates
- Clean interface, easy to learn
- White-label reports (logo, domain, themes)
- Affordable for basic needs
- PDF and link sharing options
Cons ❌
- Limited integrations. Data connectors can break; no alerts when integrations fail
- Lack of deep filtering, blending, or calculated fields
- Manual work required to apply themes to each dashboard
- Advanced features locked in pricier plans
- Limited widget types and rigid layout make advanced customization frustrating
DashThis Pricing
To start our DashThis review, let's talk about its pricing. DashThis’s pricing is based on the number of dashboards you can manage.
For example, you can create 10 dashboards with the Professional plan, and you can decide whether to create one or multiple dashboards for one client.
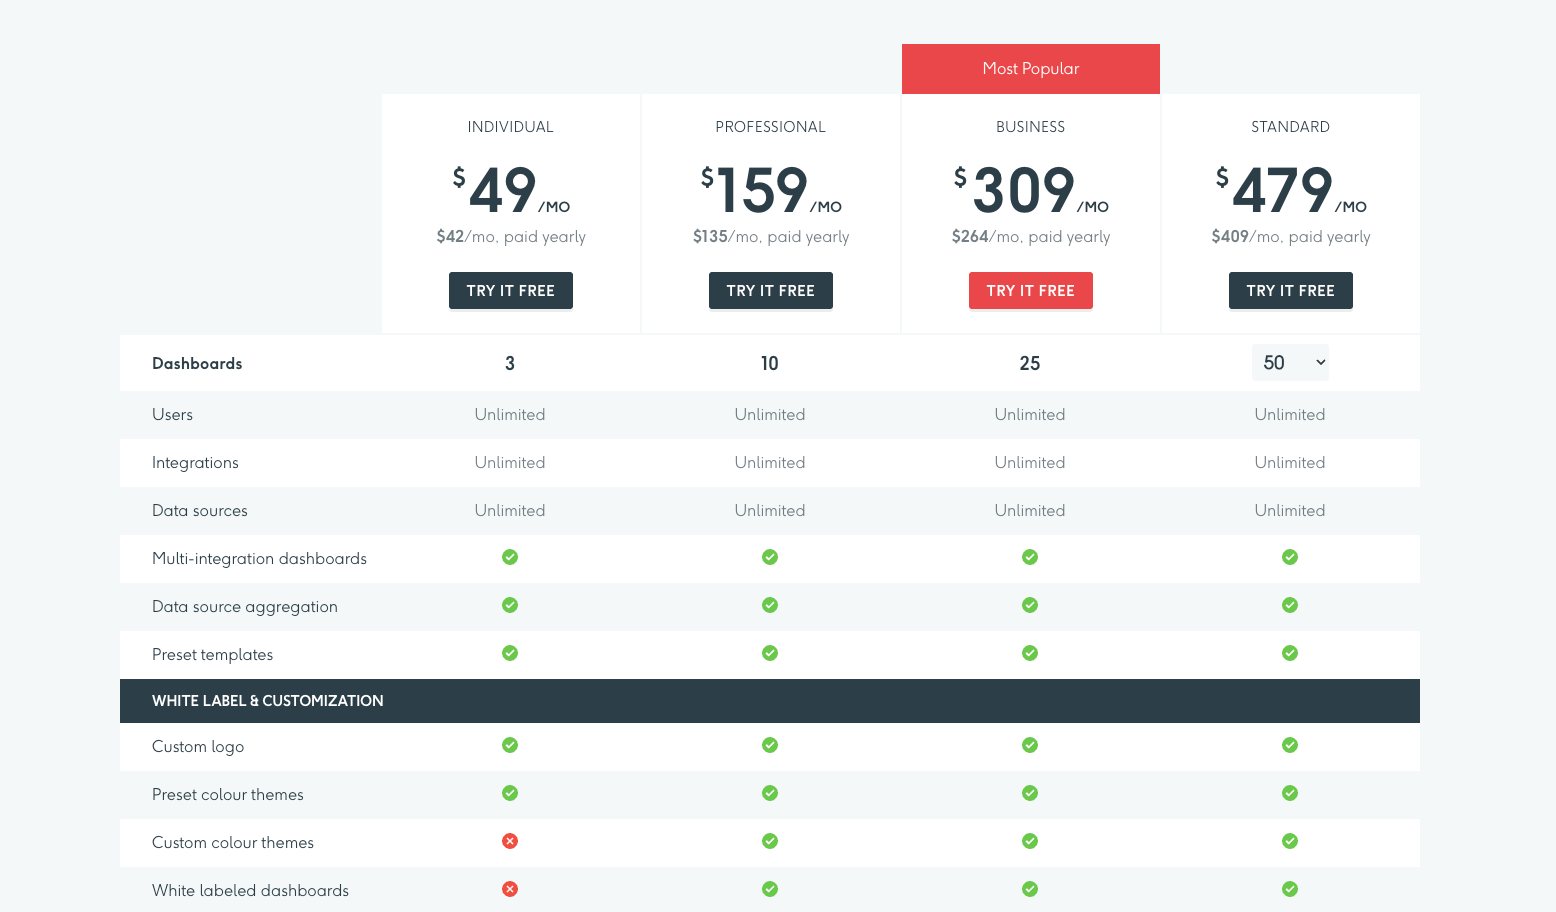
Based on the pricing information we found from DashThis’ website in May 2025, their pricing plans are as follows:
| Plan | Price (Monthly) | Included Dashboards | What’s Included: |
| Individual | $49/month, or $42/month annually | 3 |
|
| Professional | $159/month, or $135/month annually | 10 |
|
| Business | $309/month, or $264/month annually | 25 |
|
| Standard | $479/month, or $409/month annually | 50 |
|
Key takeaways for your budget
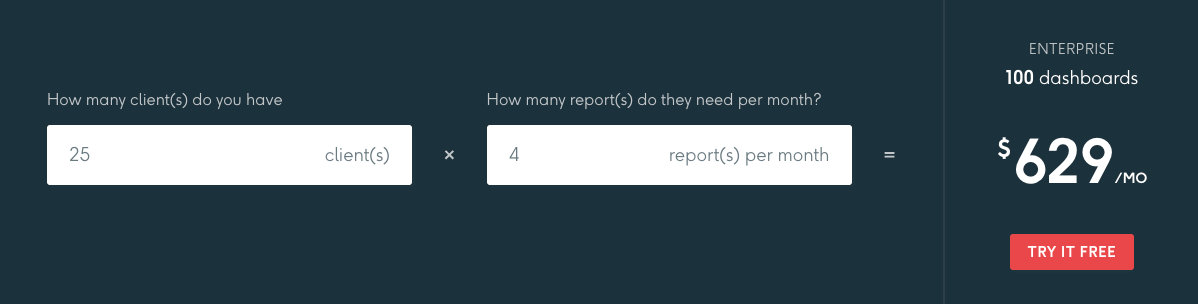
1. Think of how many marketing reports you need to create: One dashboard equals one report. If you need to create more than one type of report per client, you’ll have to use multiple dashboards for that client, which can quickly drive up the overall cost.
For example, if I had 25 clients and needed to create four reports for each of them per month, the total cost would already be $629/month.
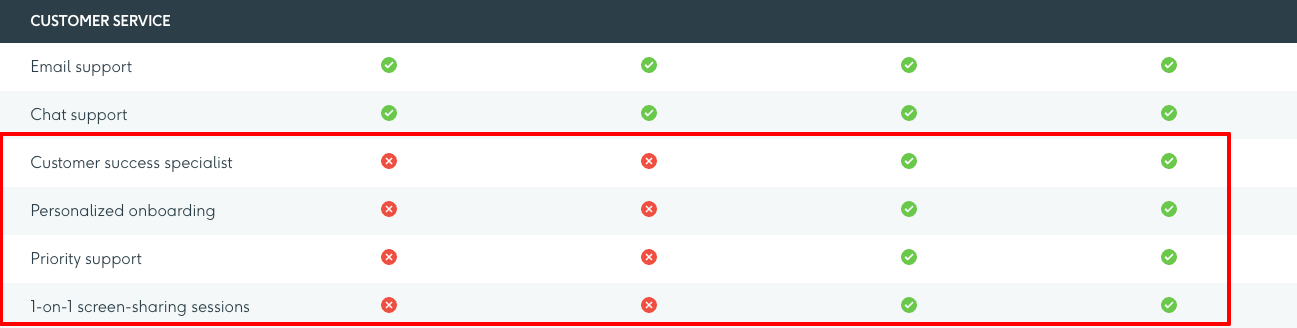
2. Priority support is only available on the more expensive plans: Priority support and personalized onboarding are only available on the most expensive plans.
DashThis has a 15-day free trial available, which is good if you want a better understanding of the platform.
Real User Reviews: What are Customers Saying About DashThis?
To get a realistic picture, we dug into DashThis's feedback from users. We looked at reviews from platforms like G2, Capterra, and Reddit to get the unfiltered view—what’s working, what’s not, and where the tool truly delivers (or falls short).
| Overall G2 DashThis Rating | 4.7 out of 5.0 stars ⭐️ (80+ reviews) |
| Overall Capterra DashThis Rating | 4.5 out of 5.0 stars ⭐️ (20+ reviews) |
DashThis pros: What Users Love
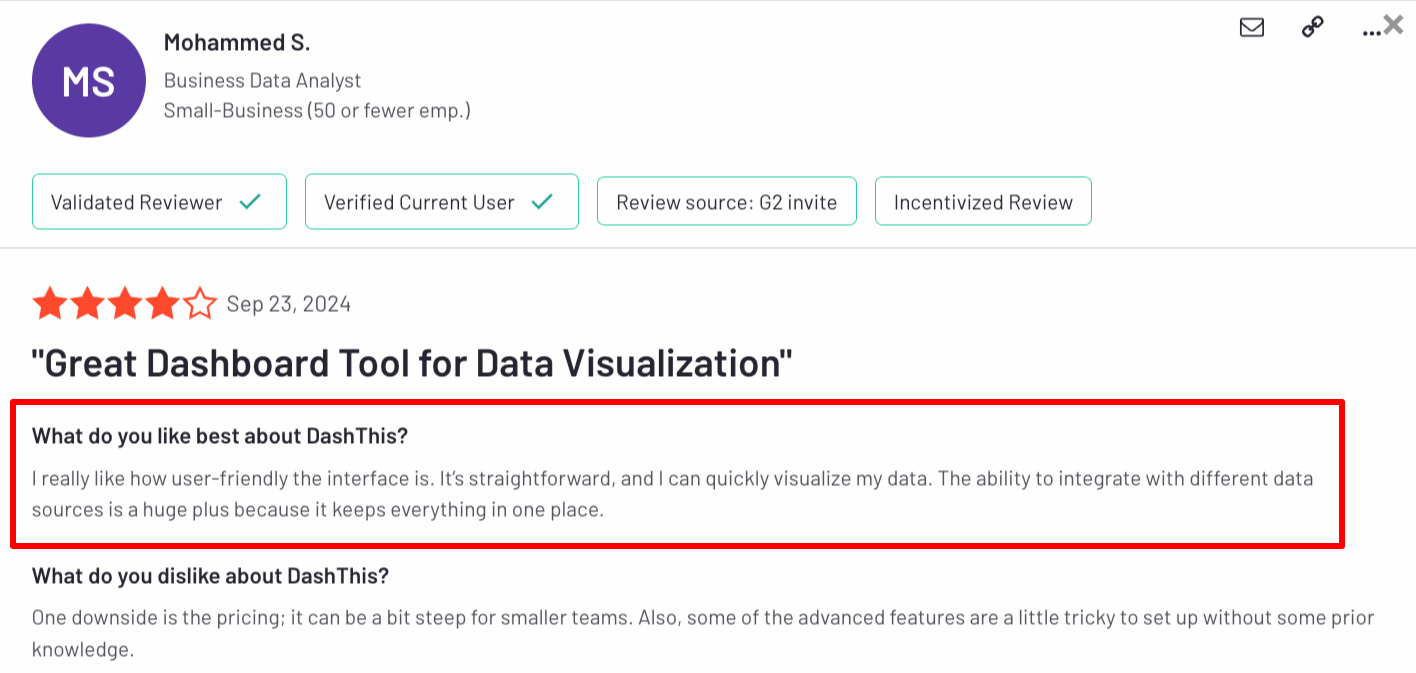
✅ User-friendly interface
The platform’s ease of use stands out from DashThis’s user reviews. Users like Mohammed S. say “the platform is straightforward,” and data visualization is easy.
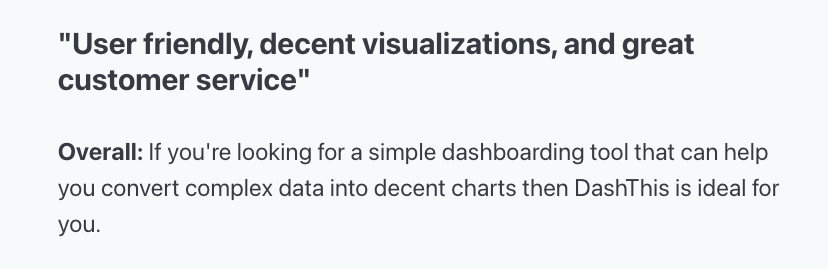
✅ Simple dashboard views
DashThis is made for simple data visualization. You can combine data from different sources into customizable dashboards—plus further display the data through charts.
Muneeb K. on Capterra said, “If you're looking for a simple dashboarding tool that can help you convert complex data into decent charts, then DashThis is ideal for you.”
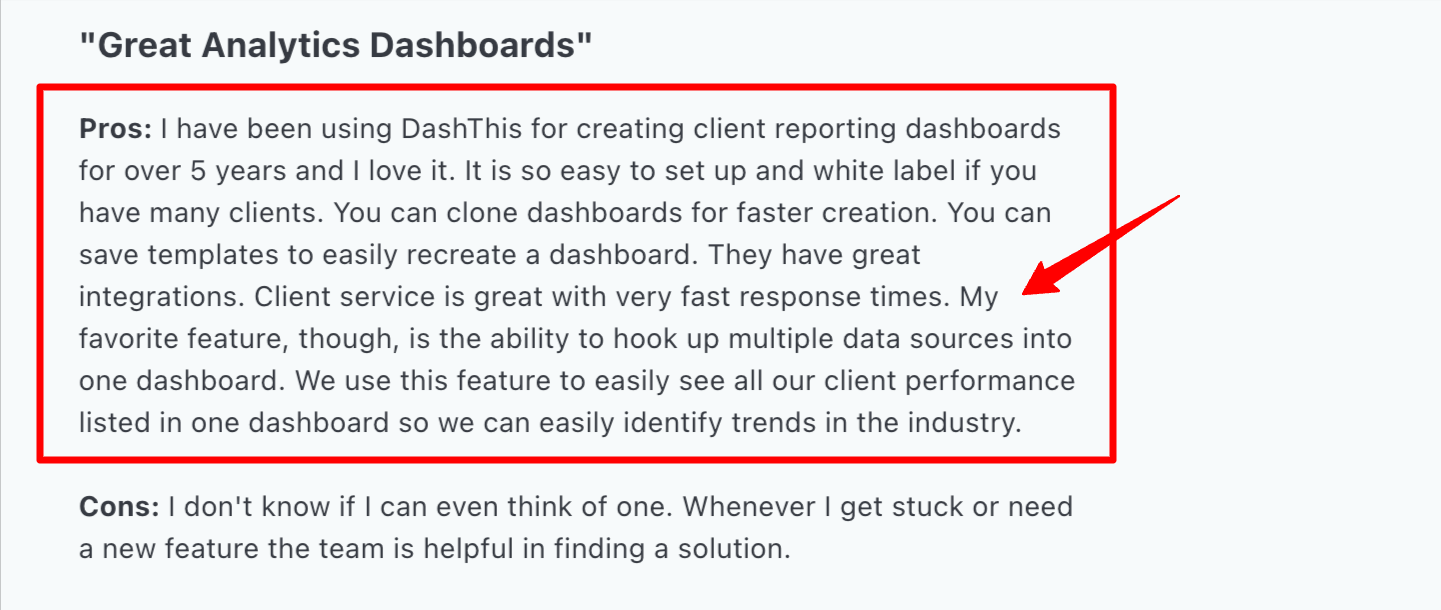
✅ Hook multiple data sources into one dashboard
While being an industry-standard feature, DashThis lets users pull data from multiple sources into one dashboard, which users appreciate. Jake B. said this is great for “easily seeing performance in one dashboard,” which “helps identify trends in the industry.”
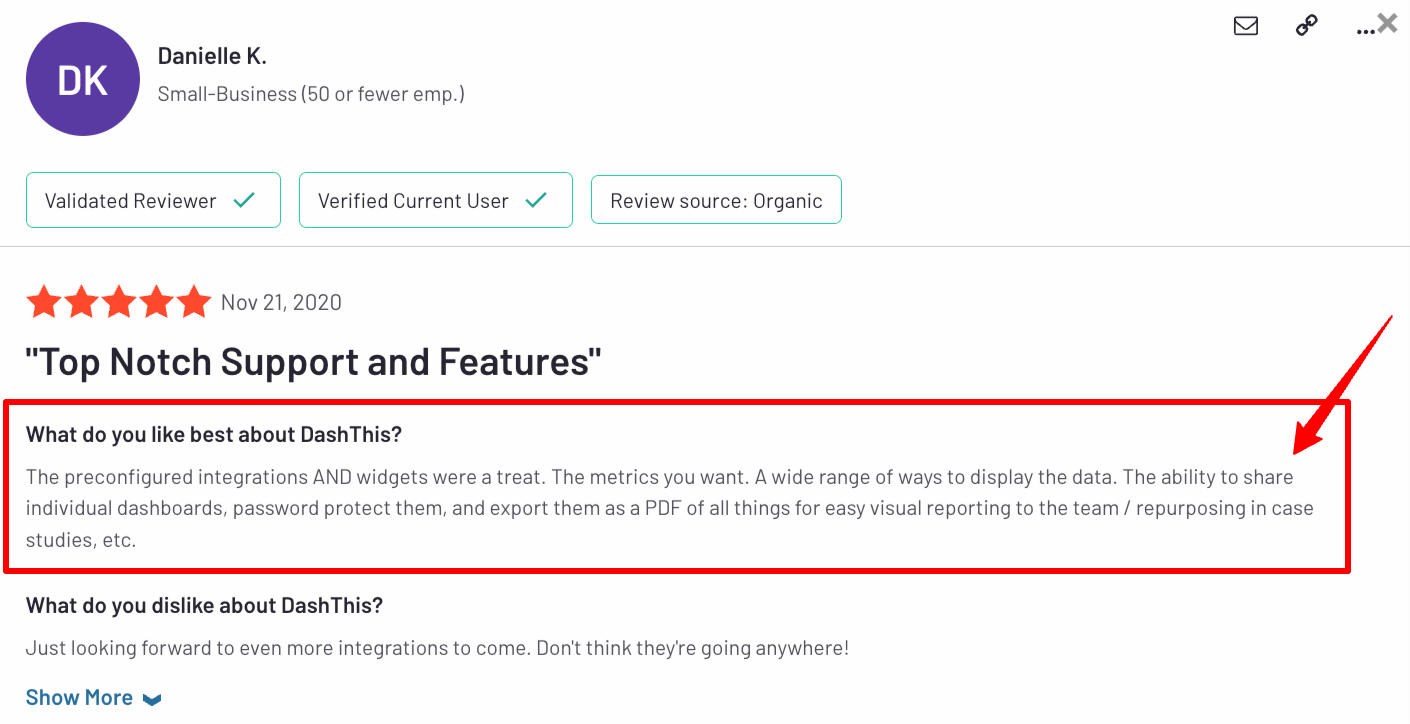
✅ Collaboration features
Users like Danielle K. appreciate the collaboration features, such as “the ability to share individual dashboards”, “password protect them,” and “export them as a PDF.”
Aside from PDF sharing, users can share reports through a link or email. These three sharing options are available in most of the best marketing reporting software.
This leads us to…
DashThis Cons: Where Users Get Frustrated
⚠️ Limited integrations
DashThis integrates with 25+ digital marketing platforms. Compared to its competitors, this isn't much, and it doesn't include Salesforce, Google DV360, or more niche platforms like Quora Ads, ActiveCampaign, and SE Ranking.
Manual data exports and imports are possible, but as you probably know—they’re cumbersome and time-consuming.
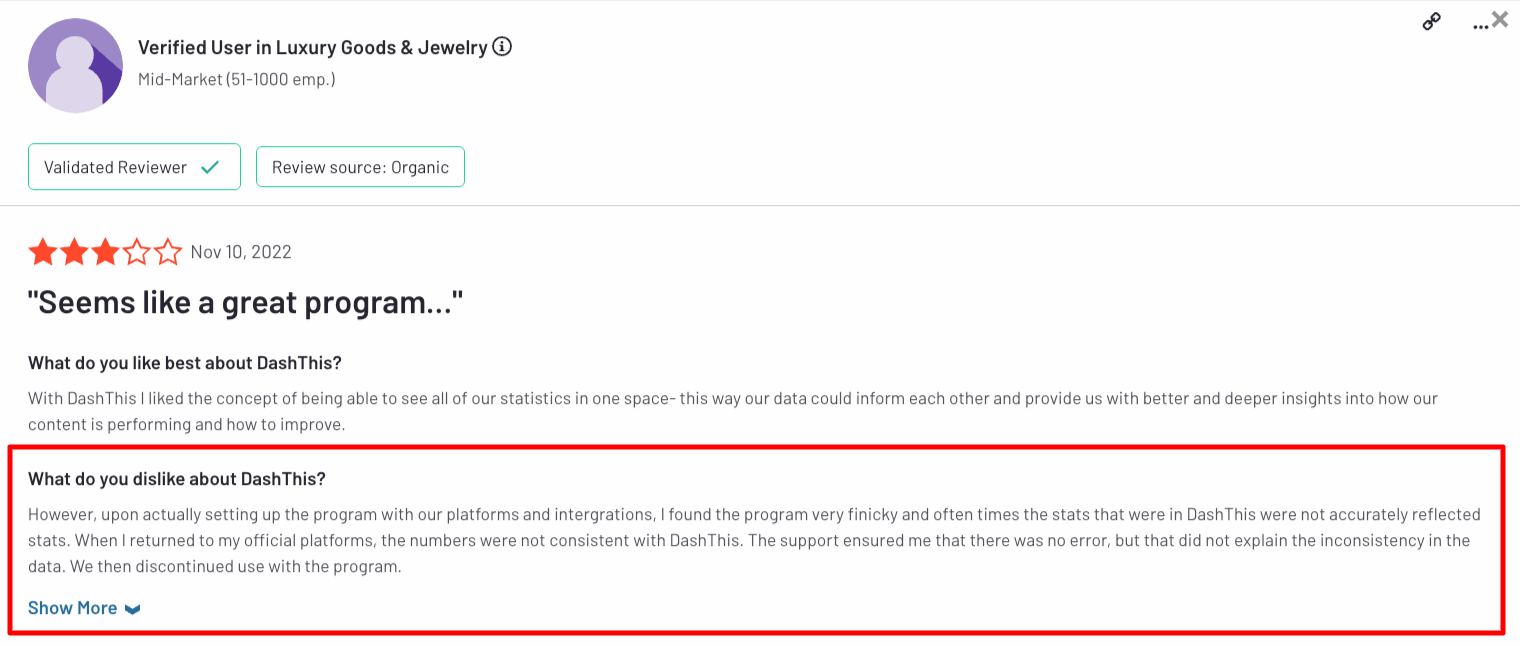
⚠️ Data is not accurately reflected
Unreliable data isn’t just a minor issue; it can lead to trust issues with clients and hurt your report's credibility. This is unfortunately an issue for DashThis users, as one reviewer said, “the stats in DashThis are not accurately reflected.”
The same reviewer mentioned bringing up this issue with customer support but didn’t receive further help from there.
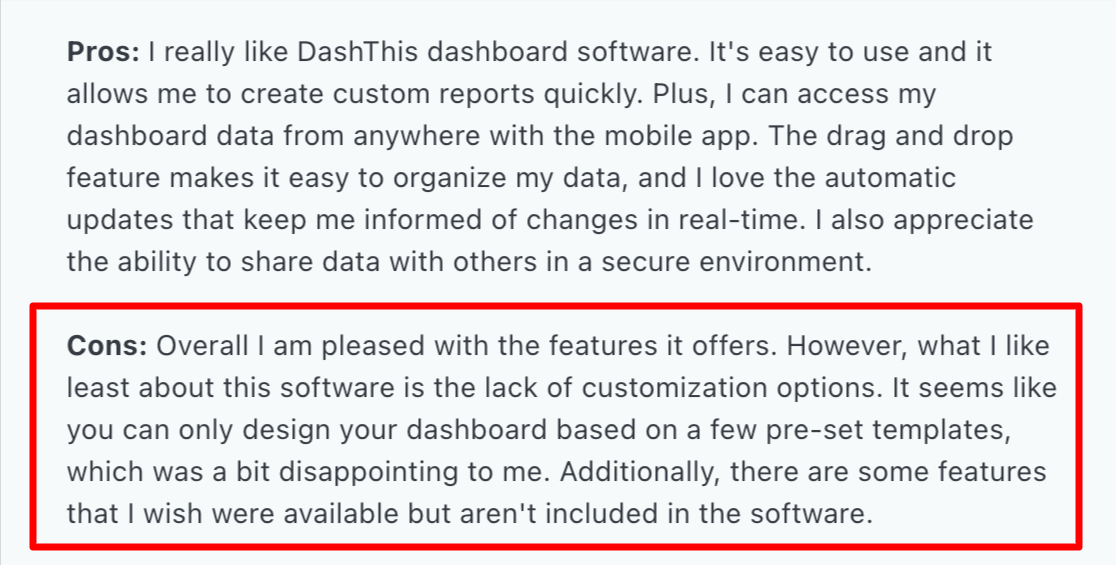
⚠️ Limited templates and customization
DashThis’ dashboards and reports are “fixed” and old-fashioned. Some customization options are available, but not enough to truly make the reports branded.
One Capterra user said, “There is a lack of customization options,” and that “you can only design your dashboard on a few pre-set templates, which was a disappointment.”
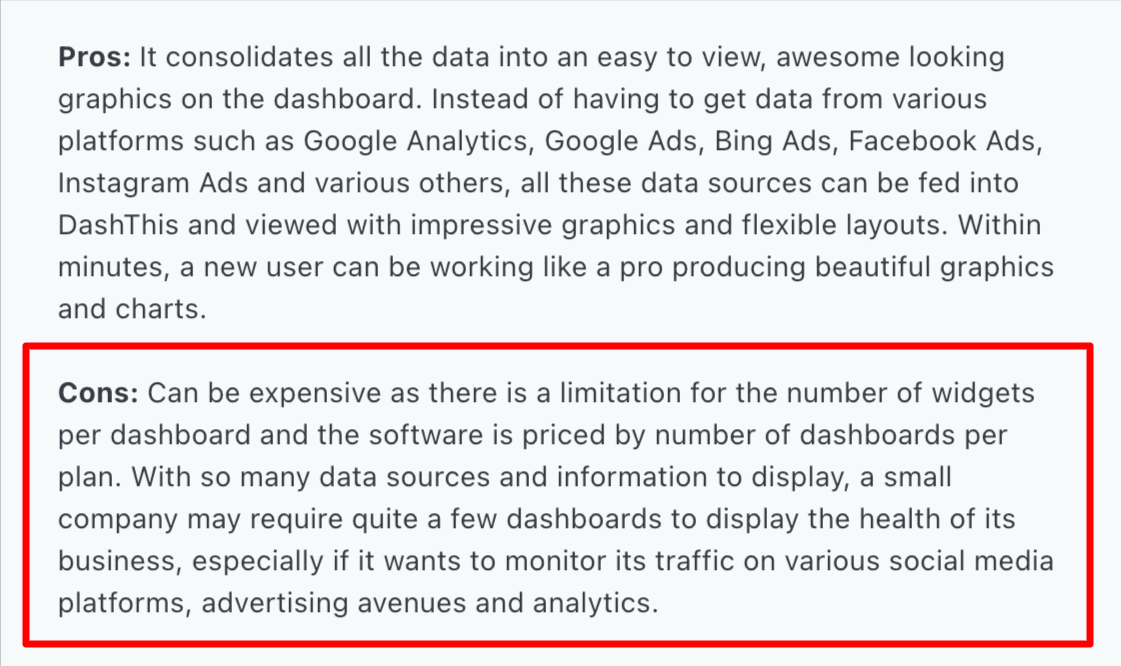
⚠️ Limitations in the pricing
DashThis’ pricing appears straightforward from the surface. However, you might realize you need a new dashboard for each unique report. Like this reviewer says, “if you require multiple dashboards to display the health of your business, it can get expensive.”
The same reviewer says, “There is a limitation on the number of widgets per dashboard.”
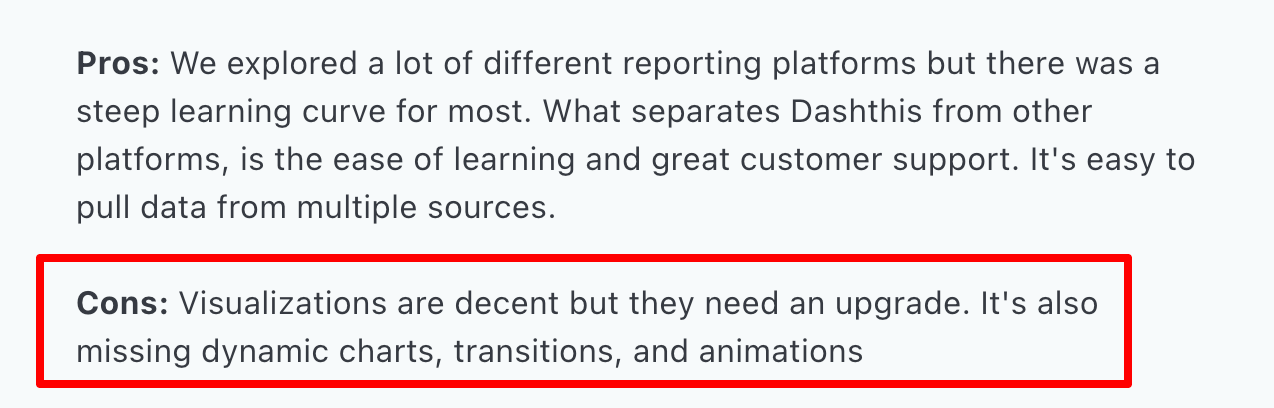
⚠️ Limited data visualization
This was one of the main DashThis complaints. If you’re looking to blend data from multiple sources into one metric, DashThis falls short. It only comes with a "merge" metrics widget, which is limited when agencies want to merge data from different platforms.
Muneeb K. added to this and said, “The visualizations are decent, but they need an upgrade,” and that “DashThis is missing dynamic charts.”
Feature Deep Dive #1: DashThis Ease of Use
DashThis is generally known for being easy to use. In fact, “Ease of Use” is its main pro on G2.
This high rating indicates that users generally have an easy time creating dashboards and reports. But reviews don’t tell the whole story. Let’s look at the platform ourselves to get a better understanding:
Is it easy to create reports for client reporting?
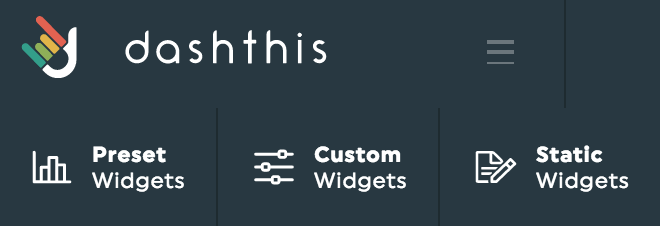
Yes, DashThis offers ready-to-use templates and drag-and-drop widgets for creating reports quickly. You can select from different types of templates:
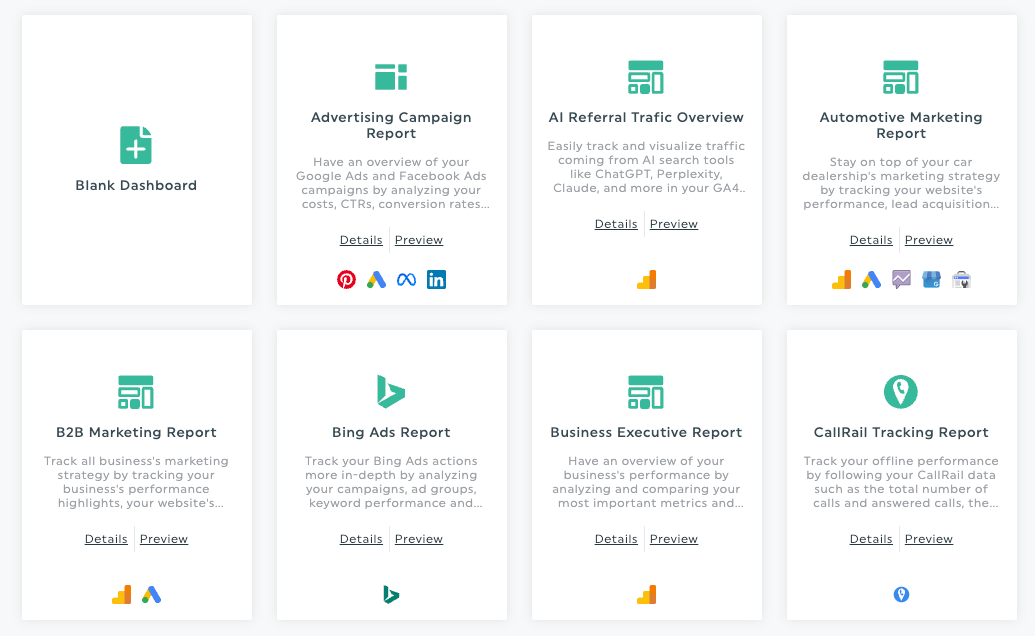
These report templates definitely contribute to DashThis’s reputation for being easy to learn initially.
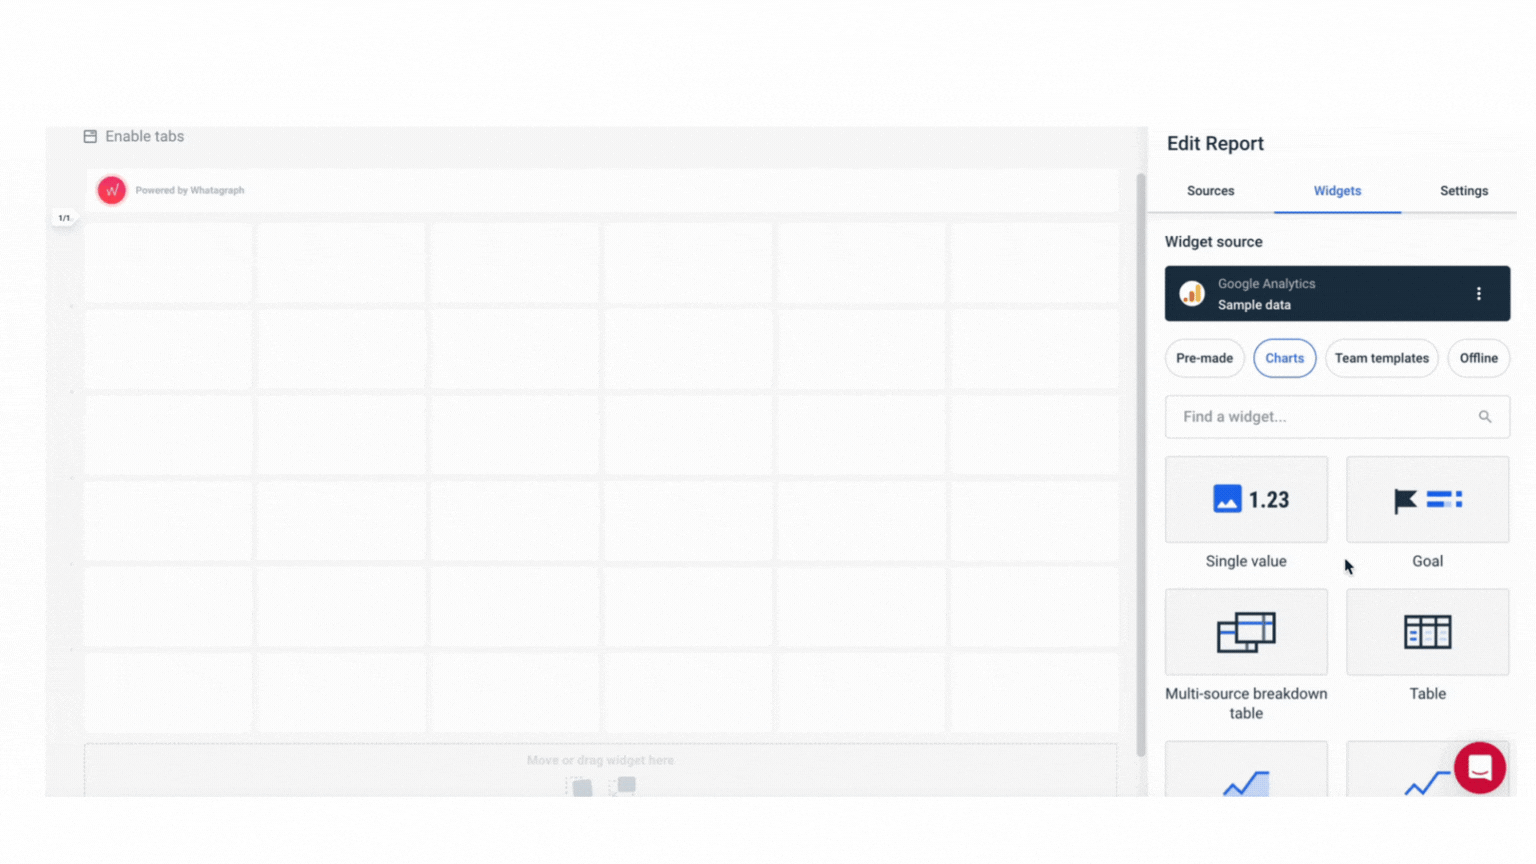
You can add widgets to your reports to visualize data. However, there are only nine different custom widgets available.
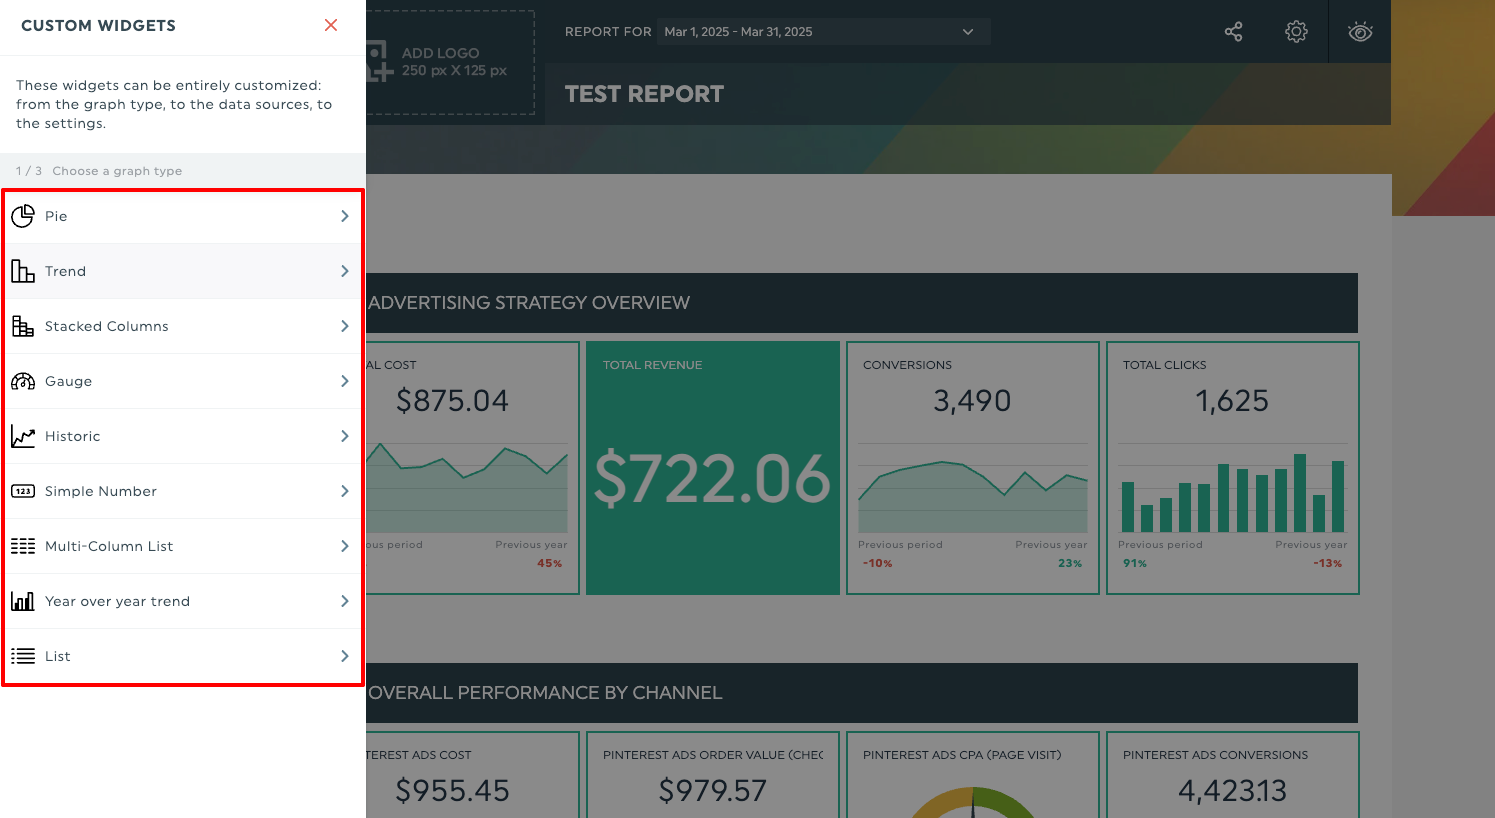 Comparatively, reporting tools like Whatagraph offer 20+ unique widgets for creating client reports.
How easy is it to edit dashboards?
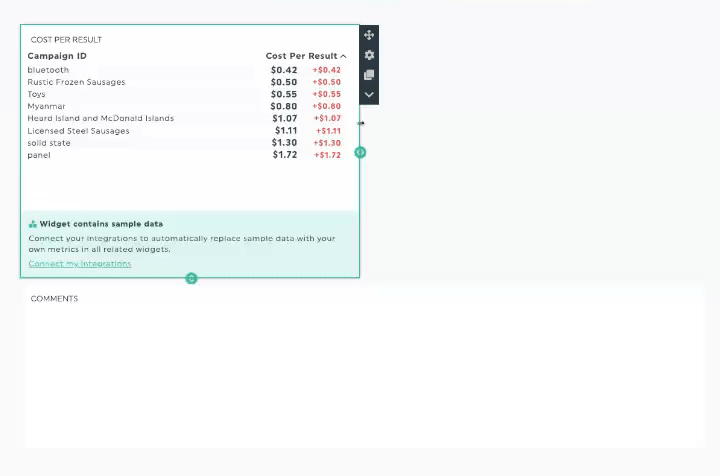
After adding your widgets, you can modify display preferences, change numeric values, and resize the widget.
Resizing widgets was a bit cumbersome in our opinion, as the editor didn’t intuitively pick up on the width we wanted:
You also can’t drag and drop a new widget to a specific spot you want. It gets dropped to the nearest “free spot,” which is a bit of a bummer:
Whereas on Whatagraph, you can actually drag-and-drop widgets neatly onto the report canvas:
Plus, you can also resize these widgets anyway you want—horizontally or vertically—and also add new rows anywhere you want on the report.
But the biggest feature that makes it easy to edit dashboards on Whatagraph is our Linked reports.
On DashThis, if you want to edit a dashboard you’ve already built, you’d need to go into it individually and make changes. This is fine if you only have 1 or 2 dashboards, but becomes super time-consuming if you have 10+.
On Whatagraph, you can have one “Master” (or main) dashboard and link your other dashboards to it. Then, all you need to do is edit that Master dashboard and your changes will sync across all the dashboards linked to it.
This means if you have 10 dashboards, you only need to edit ONE, saving you so much time and hassle.
Here’s how it works:
DashThis is easy to set up and great for creating simple reports quickly, which makes it ideal for small teams. But as your agency scales, limitations in layout control, widget flexibility, and lack of bulk editing can slow you down.
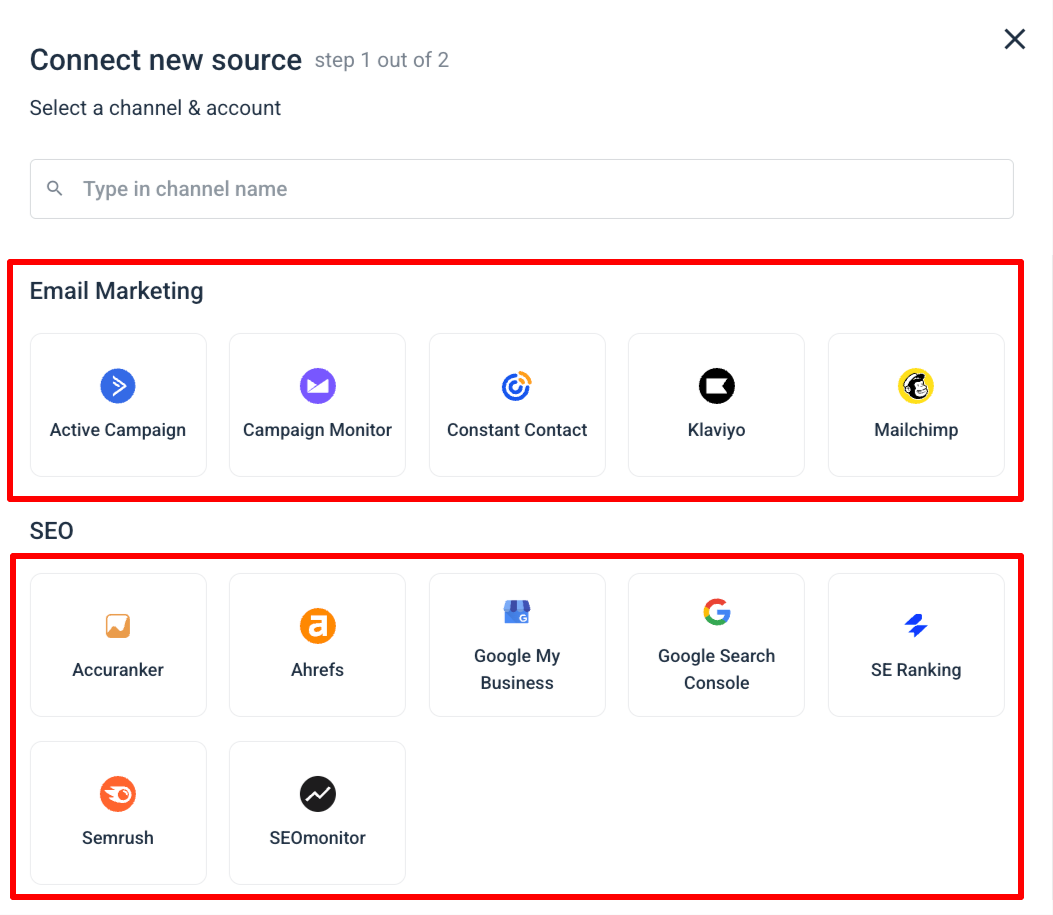
Feature Deep Dive #2: DashThis Integrations
A wide range of integrations (and their reliability) are hallmarks of a good reporting tool. DashThis, unfortunately, falls short here.
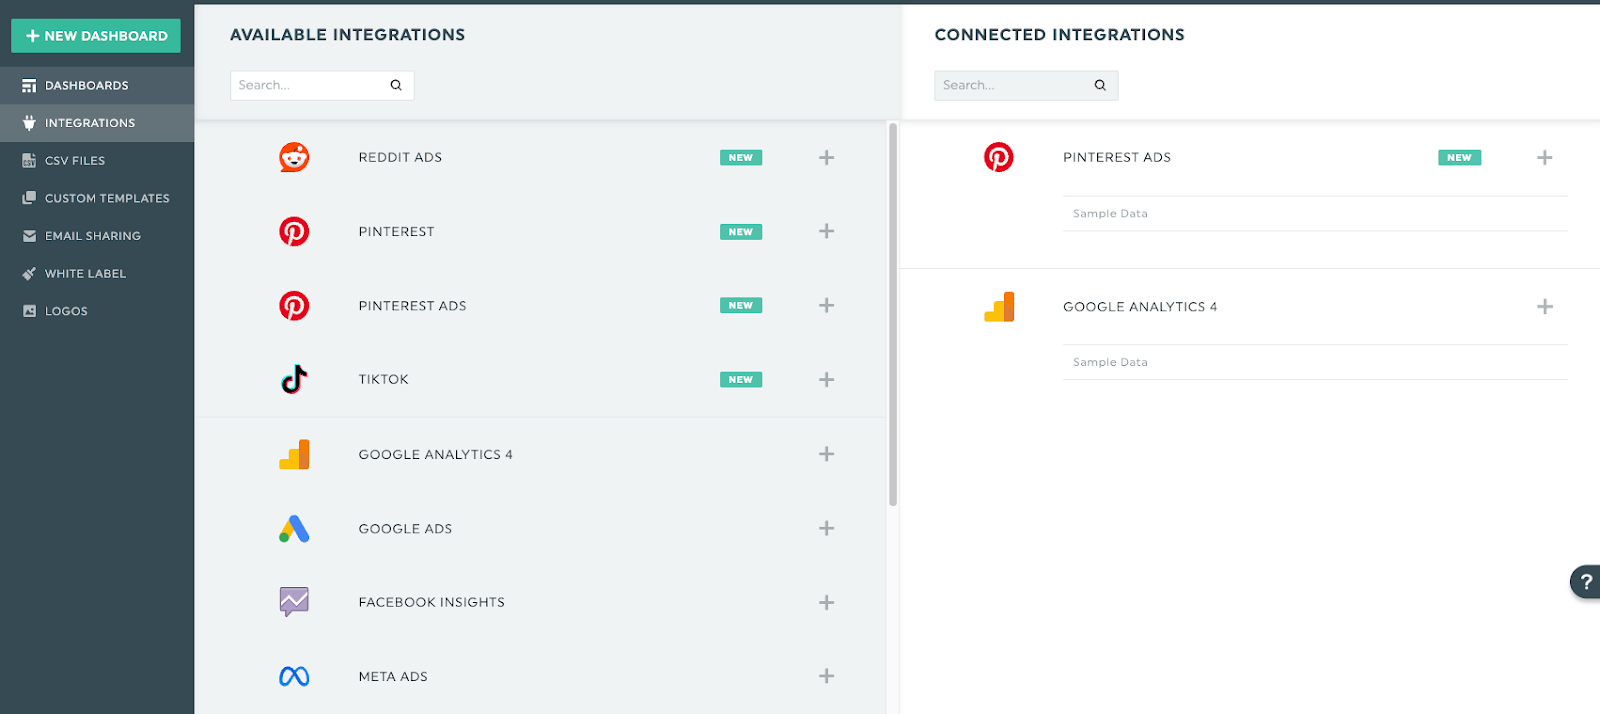
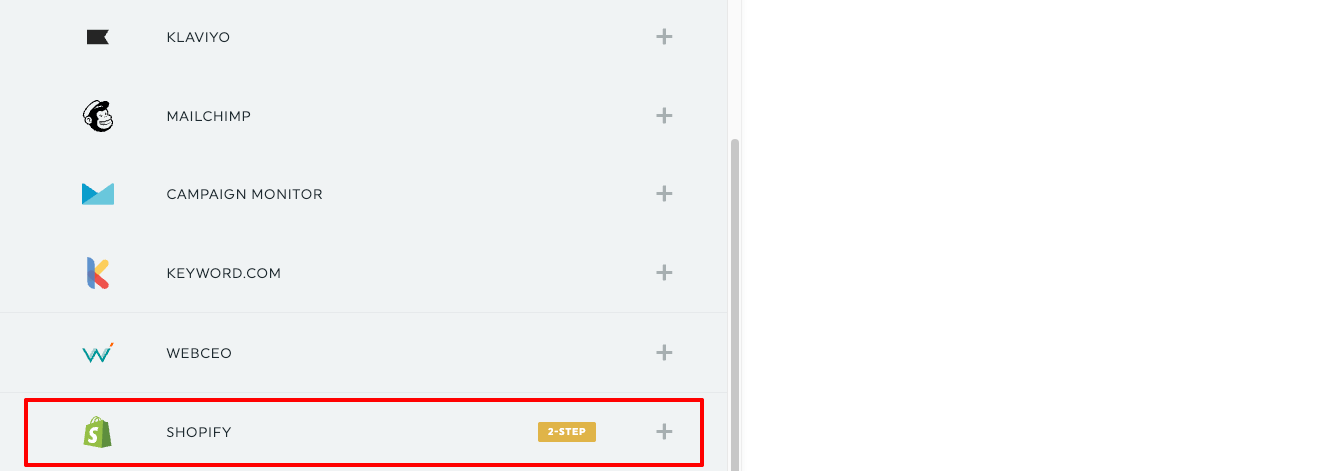
We calculated that DashThis has 29 integrations in total, covering key areas like PPC, SEO, email, ecommerce, and social media.
DashThis tends to offer just one integration per category—for example, only Shopify for ecommerce.
Meanwhile, alternatives like Whatagraph support 55+ integrations—with multiple CRM, ecommerce, SEO, and email marketing platforms.
Does DashThis support custom APIs?
DashThis doesn’t support custom APIs. The only way to import data (outside of their integrations) is by uploading a CSV file manually.
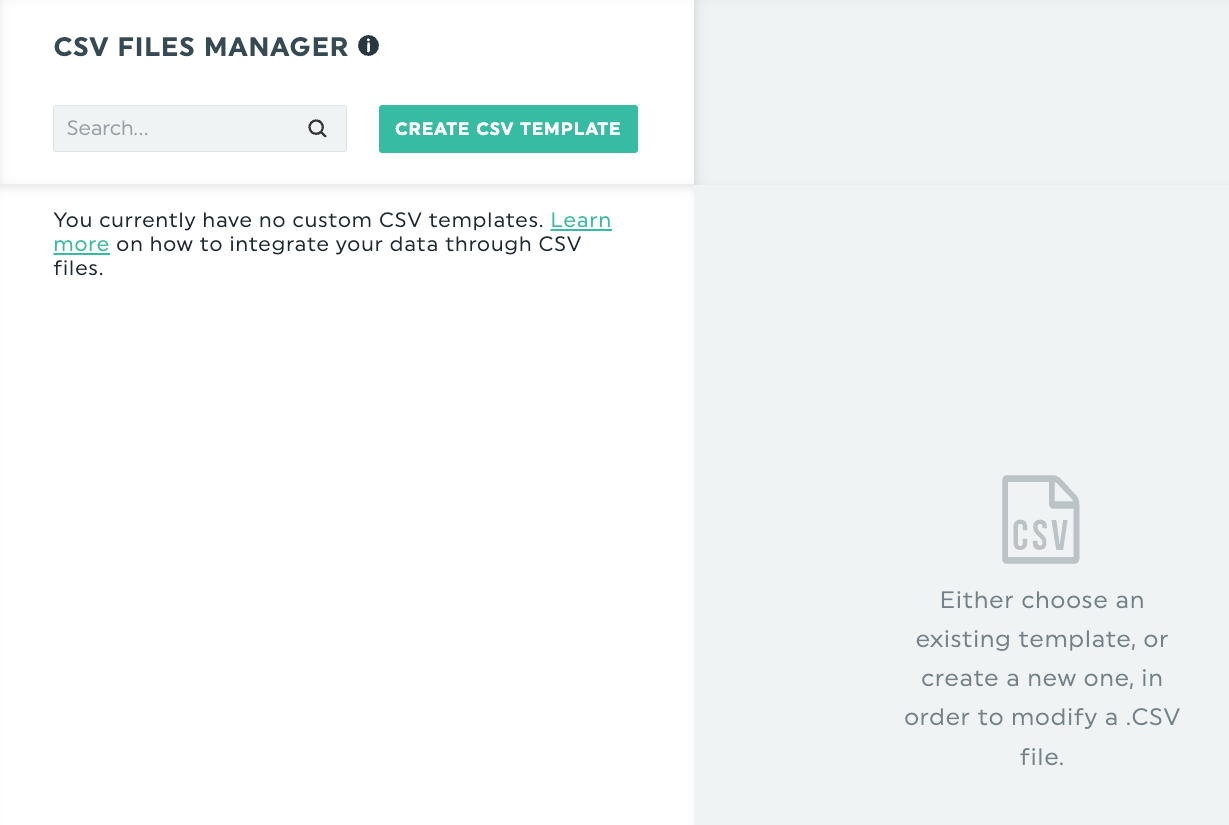 Due to the lack of a custom API, DashThis might not be the right fit for you if you need data from more niche platforms.
CSV importing is the only data importing option, but it’s time-consuming and you’ll need to keep uploading new data all the time.
Guess what? Whatagraph does offer a custom API. You can use it to push data from any platform you want onto Whatagraph (if we don’t have a native integration built already).
Are the integrations reliable?
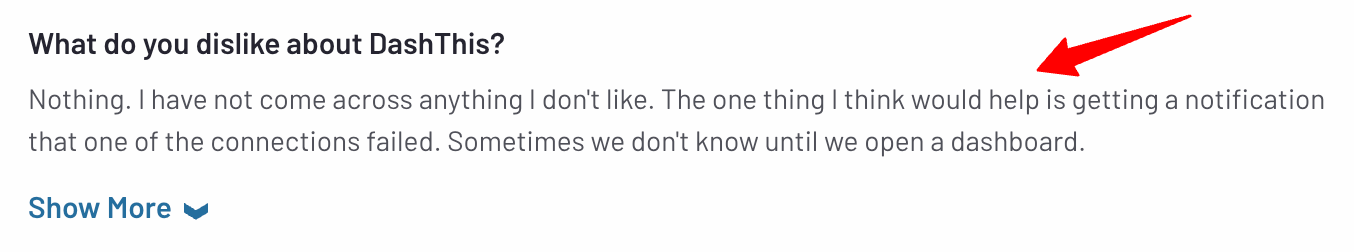
Data reliability is perhaps a reporting tool's most important feature. For DashThis, users have raised concerns on this area—saying “the data is not accurately reflected.”
This is a serious drawback, as inaccurate data can lead to your reputation taking a hit.
Some reviewers also wish there were notifications if the connectors fail. Connectors shouldn’t fail in the first place, but if they do, notifications should definitely be available.
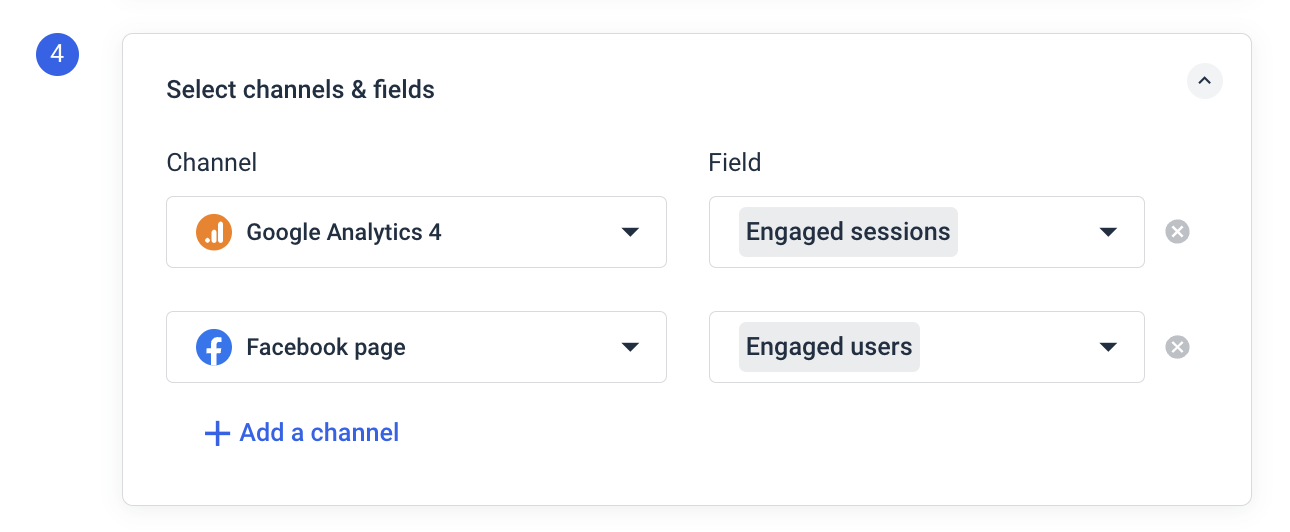
DashThis offers 29 integrations with Facebook, Instagram, LinkedIn, Google Ads, Google Analytics, and other marketing platforms—but lack of custom APIs and data reliability are real concerns for users.
Feature Deep Dive #3: Data Organization, Blending, and Filtering on DashThis
It’s not enough that you bring your data into a reporting platform. It’s also important that you can organize, standardize, and merge data from different sources so you’ll get the most holistic view of performance on your reports.
Unfortunately, this is where you’ll run into huge limitations with DashThis.
Being a “starter” reporting tool (at a lower price point), DashThis doesn’t offer advanced data transformation options except a few basic ones. Here’s what you can do on DashThis:
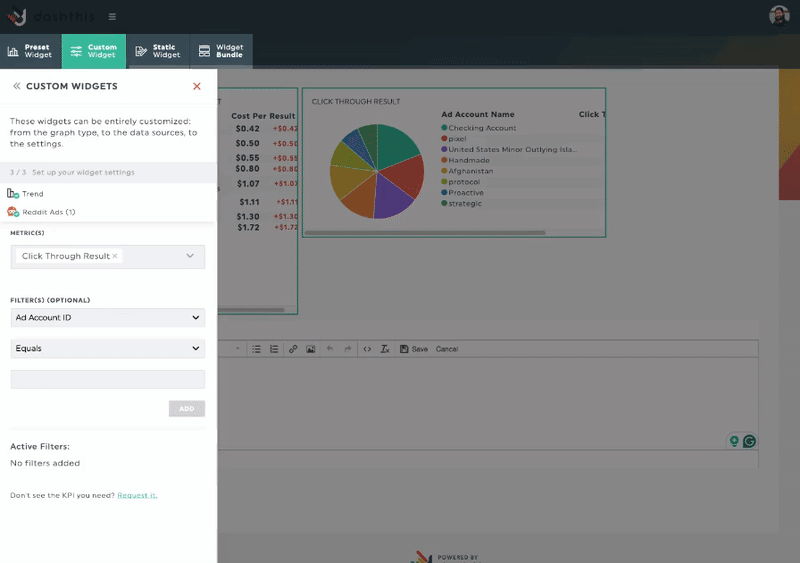
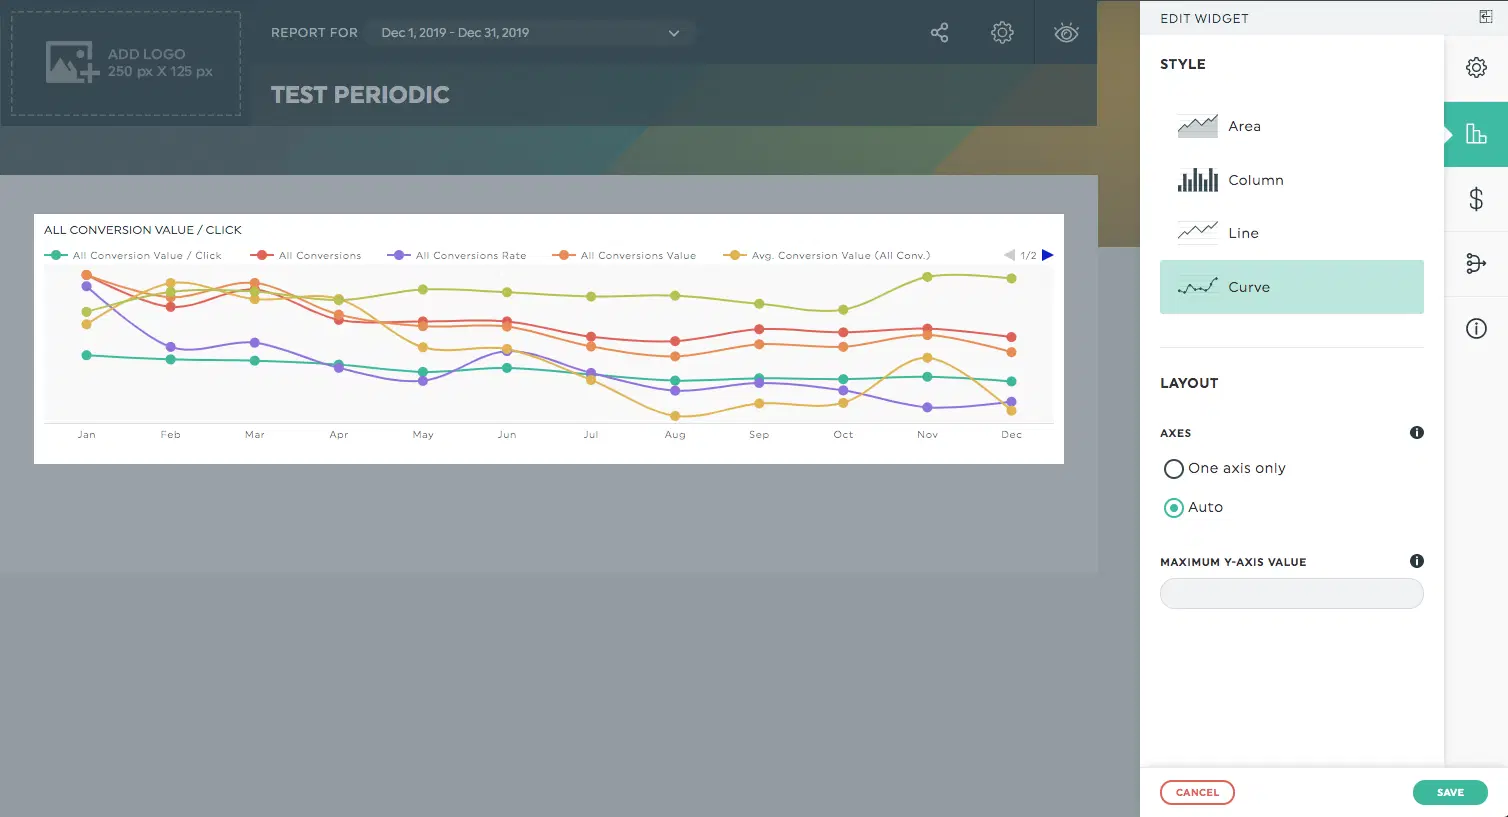
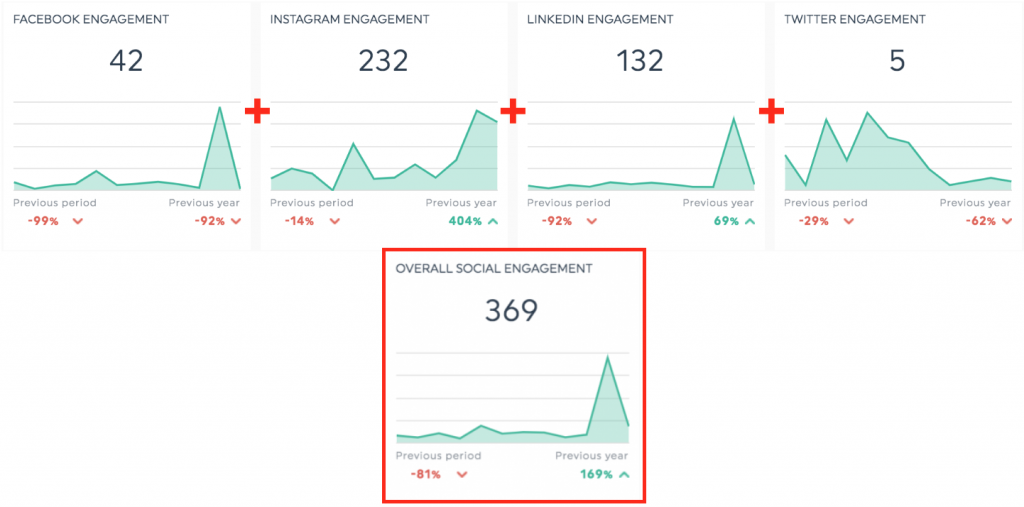
1. Show multiple KPIs in one trend widget
DashThis allows you to combine up to 6 metrics into a single Trend widget to compare performance over time. Here’s how it works:
- Go into Edit Mode on your dashboard
- Open the Custom Widgets panel
- Select the Trend widget
- Add up to 6 different KPIs into one visual
- Customize the graph type (e.g. switch from columns to lines)
This is useful for quick comparisons—but it’s a visual overlay only. The data isn't blended or transformed under the hood.
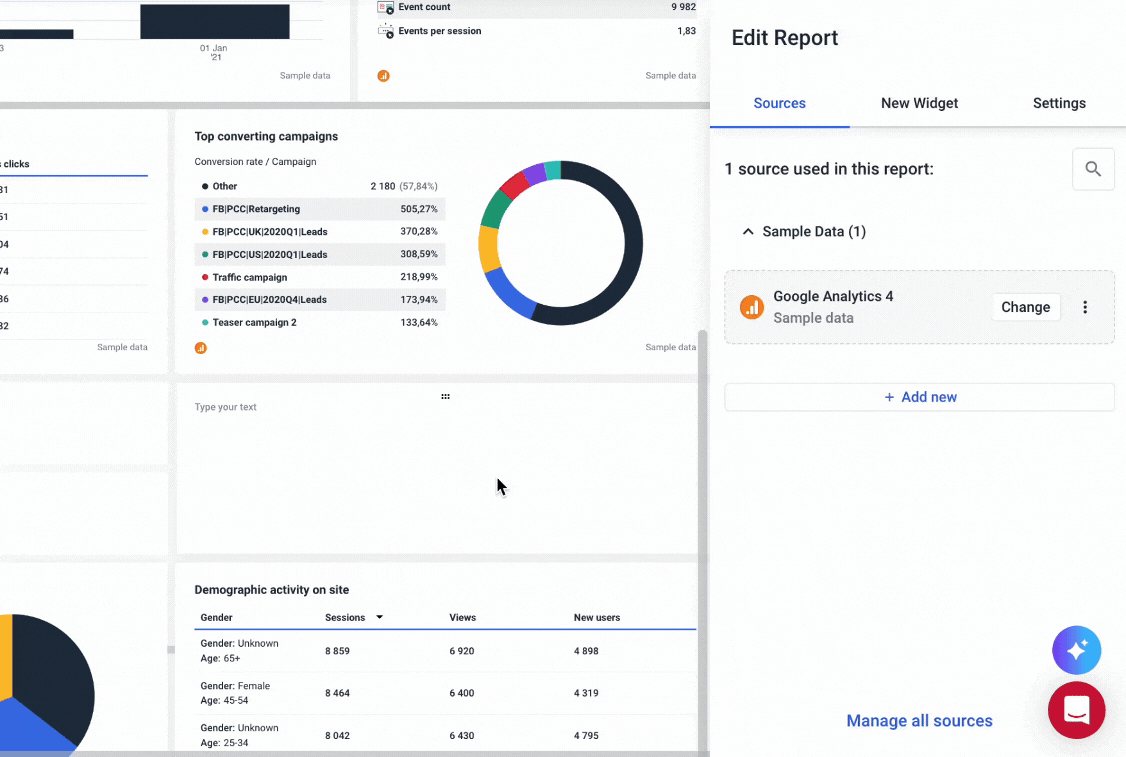
2. Merge widgets (with caveats)
DashThis supports a “Merge Widgets” feature, allowing you to combine data from multiple sources—but only if the graph types and KPIs are compatible.
Use cases for merging widgets:
- Combining cost data from Google Ads + Bing Ads
- Merging the same metric across different client accounts
- Summing related metrics (e.g., Conversions + Purchases)
- Grouping filtered campaign-level metrics (e.g., Facebook spend from Campaign X + Y)
⚠️ Merge limitations:
- Irreversible: You can’t unmerge once combined
- Compatibility required: Widgets must use the same graph type
- No CSV merges: You can't merge a CSV widget with a built-in integration
- Static result: Post-merge, filters and metrics can’t be adjusted
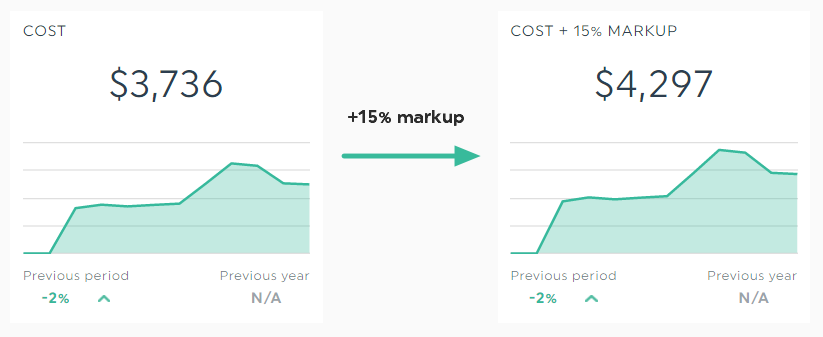
3. Add Agency markup for cost KPIs
Agencies billing clients with a % markup on ad spend can reflect this directly in reports:
- Available only on widgets that use cost metrics (e.g., Google Ads “Cost” or Facebook “Amount Spent”)
- Add a percentage or fixed value via the “Markup Options” in the widget editor
- Some platforms (like Google Ads or Bing) come with preset widgets that already apply standard markups (e.g. +15%)
This is a quick fix for client-facing cost transparency—but again, there’s no formula logic or flexible calculations involved.
On Whatagraph though, we give you full flexibility over how data is combined, standardized, and transformed. You can create unlimited data blends, custom metrics, and custom dimensions on more advanced pricing plans. It only takes seconds to create them too. Here's what each is good for:
Here’s what you can do:
- Data blends: Great for combining different sources together into one unified data source. Helps keep your reports neat and tidy.
- Custom dimensions: Great for unifying names of various cross-channel dimensions and grouping data points from various integrations.
- Custom metrics: Great for unifying and changing names permanently for various metrics.
The best part is you can create all these natively inside of your report. You don’t need to waste time going back and forth from one workspace to another.
This granular data transformation is exactly what Stef Oosterik, Quality Manager at Dtch. Digitals agency loves about us. He said:
Clients can see the total results in one place, without jumping between different sheets or reports. This avoids confusion, especially for those who might not fully understand online marketing.
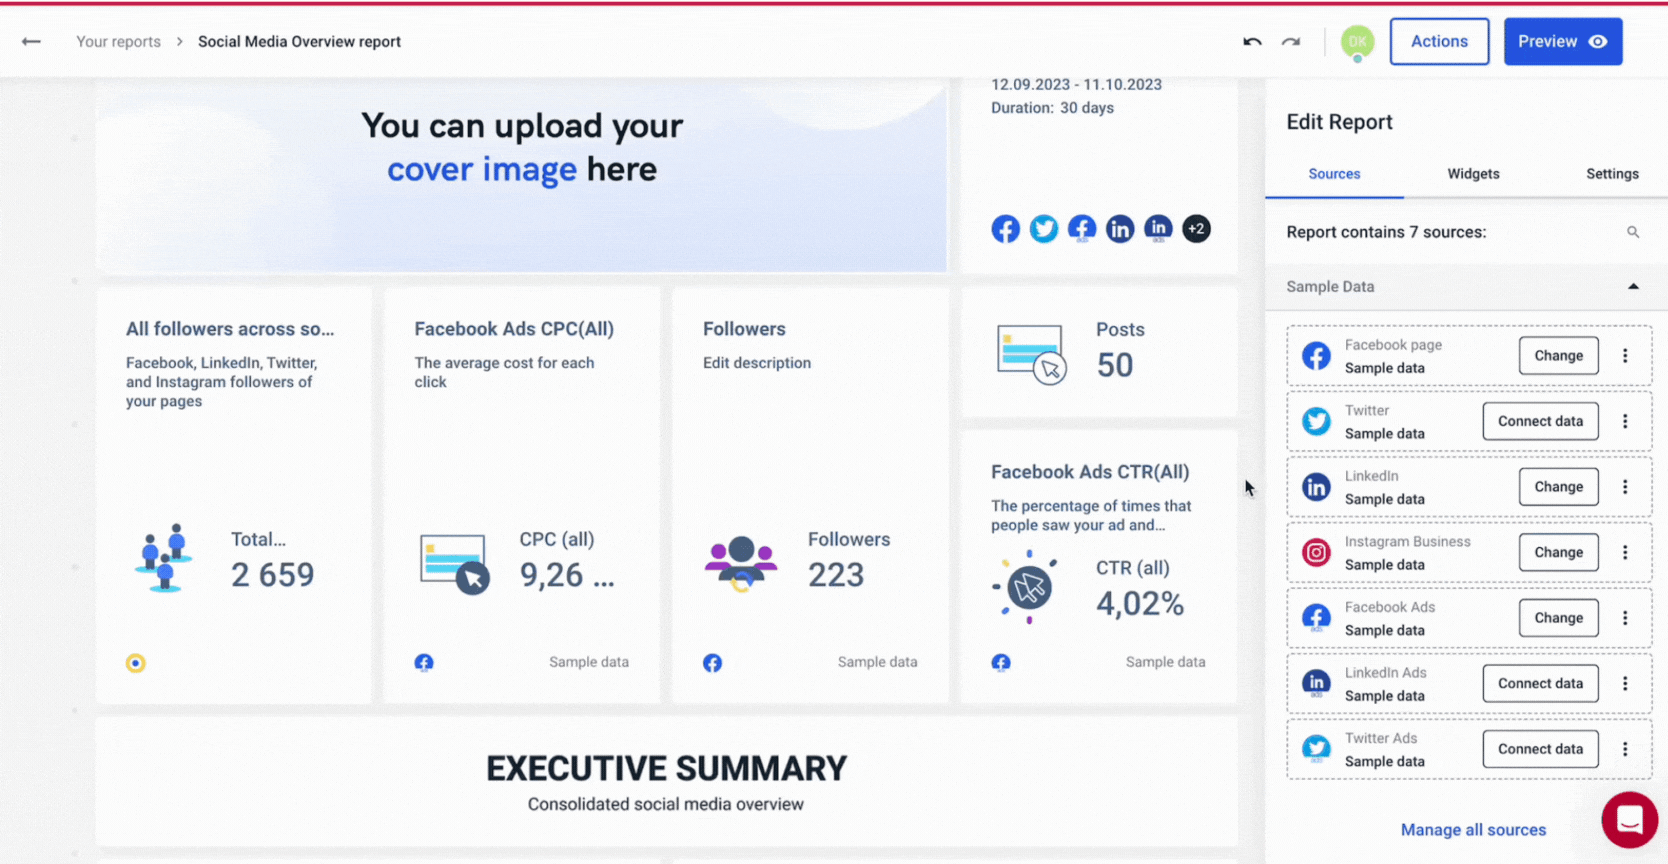
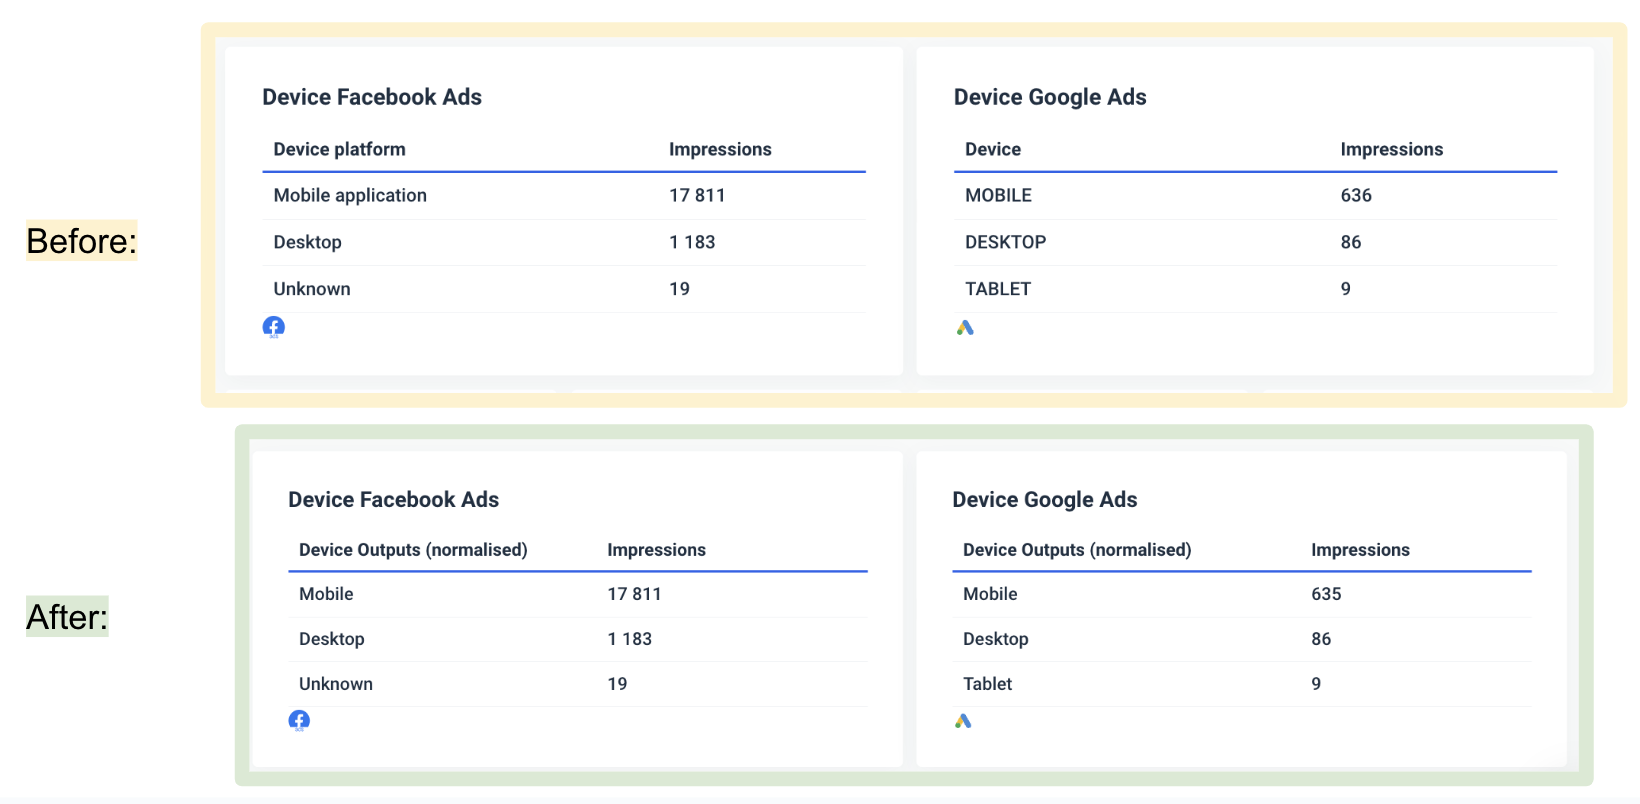
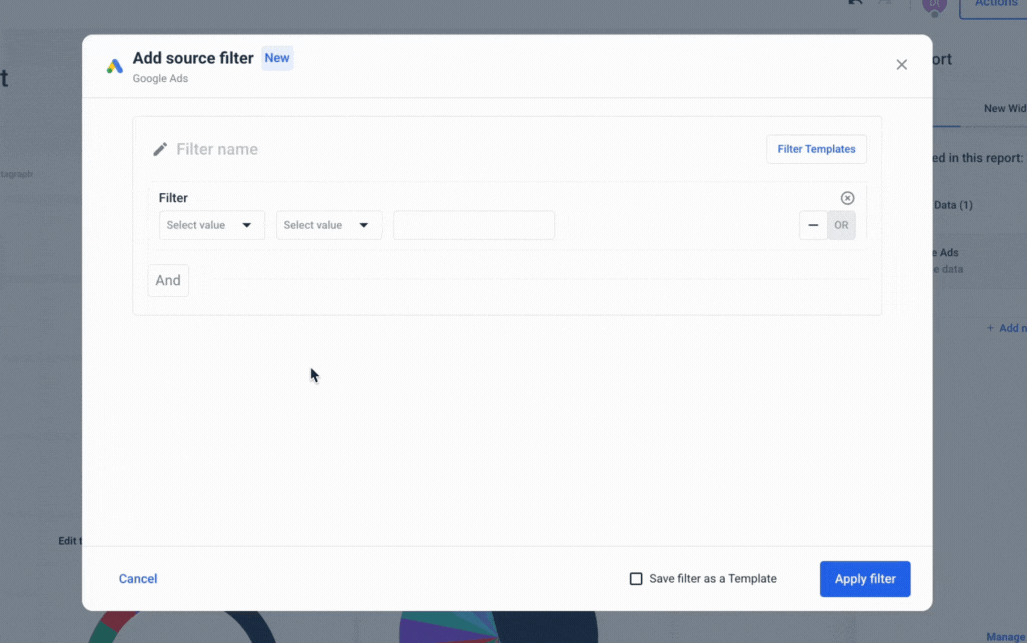
Another key feature that DashThis doesn’t offer, but Whatagraph does is our Source Filter.
Previously, you could only add filters on the widget level if you wanted to slice and dice your data. For instance, if you had a report with 20 Facebook widgets, you’d need to go through each of them to apply the same filter.
With Whatagraph’s Source Filter, you can simply go to the Facebook source that’s connected to these 20 widgets, apply the filter to the source once, and it will be applied to all widgets immediately.
This saves so much more time and hassle, and you’ll be able to slice and dice your data any way you want.
We also recently launched Performance Monitoring, which makes it even easier and faster to organize your scattered data and get actionable insights from it.
You can:
- Group 100s of scattered data sources into unified Source Groups in seconds
- Add custom tags to your data and filter it by client, business type, location, Account Manager, or whatever floats your boat
- Visualize your key metrics in one view and easily spot performance trends

DashThis offers some surface-level ways to organize and group data. But if you're looking to build complex reports that pull from multiple sources, aggregate KPIs, and apply granular filtering or calculated logic, you're likely to hit a wall.
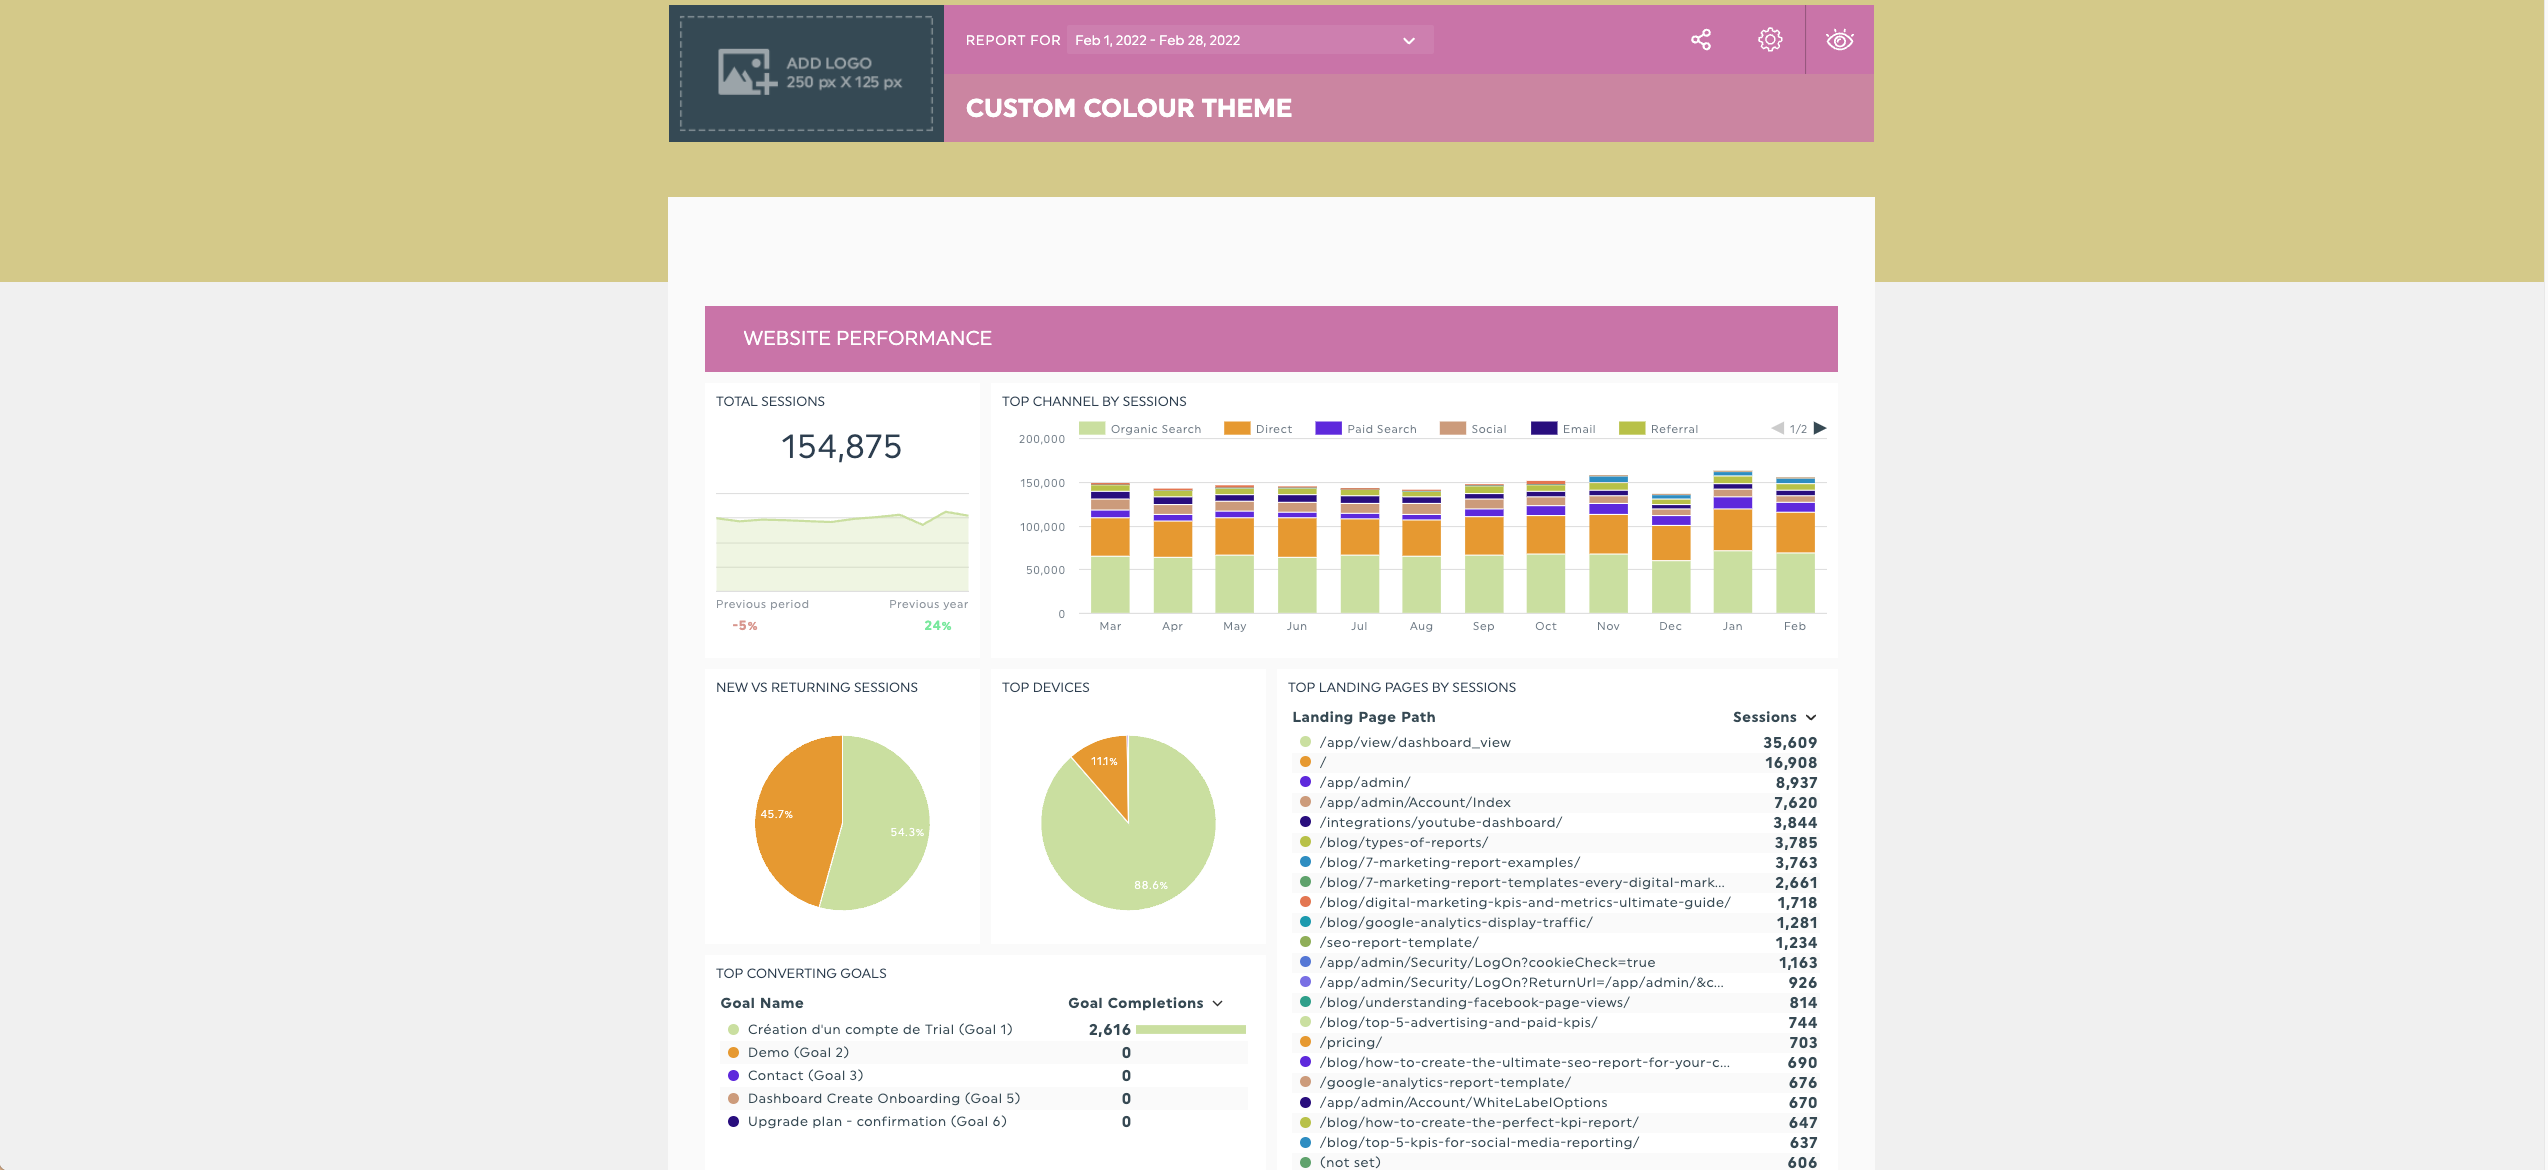
Feature Deep Dive #4: DashThis Reports and Dashboards
Reports and dashboards are where reporting tools set themselves apart, and DashThis is no exception. Let’s see where DashThis stands in this area.
How customizable are the dashboards?
DashThis is an entry-level reporting tool, which is reflected in its customization capabilities. Doing simple changes like adding new widgets, changing headings, and adding comments is relatively easy.
Here’s a breakdown of what you can customize inside the editor:
1. The header area
This is the top section of your dashboard and sets the visual tone. You can customize:
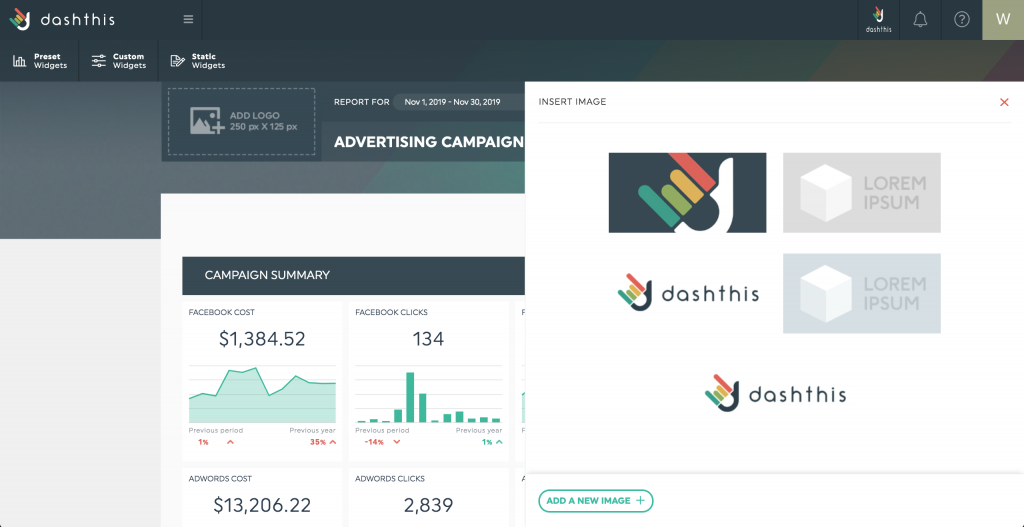
- Logo: Upload a custom logo (max size 250 x 125 pixels) to personalize the report for your agency or client.

- Color theme: Choose from pre-made themes or request a fully custom theme aligned with your brand colors.
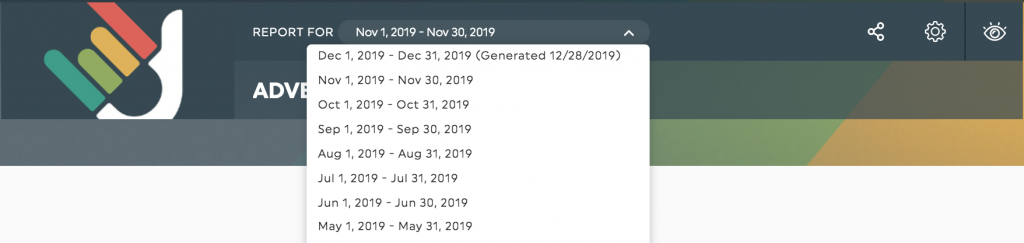
- Date range: The time period displayed in the header will vary depending on the type of dashboard:
- Periodic: Shows completed time periods with dropdown to toggle between them.
- Campaign: Shows start and end dates for both current and compared campaigns.
- Rolling: Doesn’t show a date in the header—specific dates are embedded in widgets.
2. Widgets
Widgets are the building blocks of your dashboard, and DashThis gives you several ways to build them:
- Preset widgets: Plug-and-play metrics based on your connected data source (e.g., Google Ads or Meta).
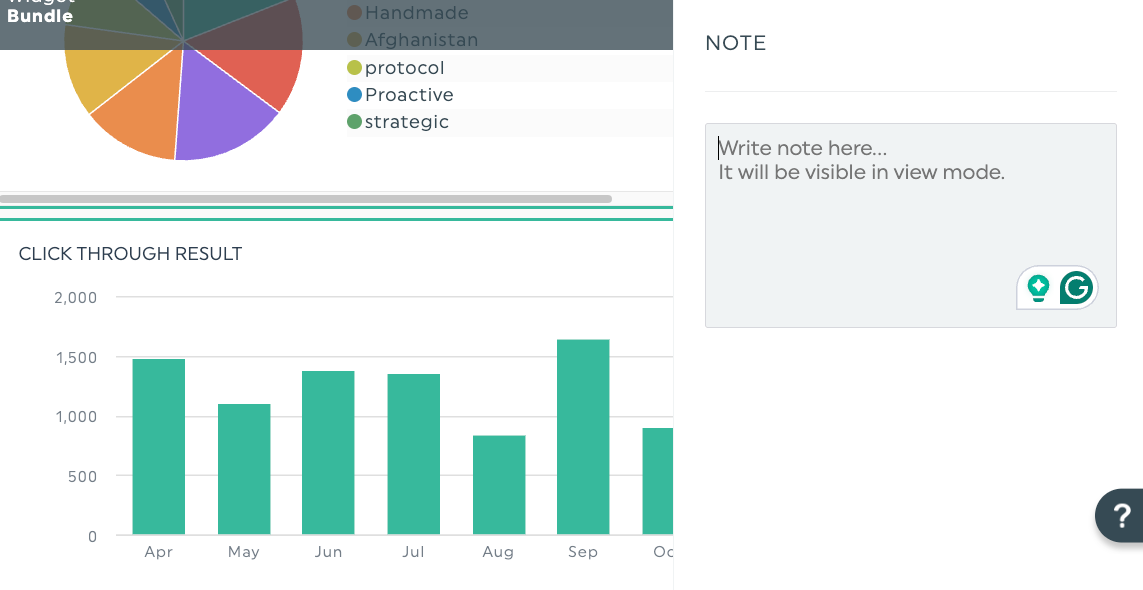
- Custom widgets: Offers nine widget types like pie charts, stacked columns, line graphs, gauges, and more.
- Static widgets: Add non-data elements like comment boxes, section headers, and CSV data uploads.
Once added, you can:
- Move: Drag and drop widgets to rearrange layout.
- Resize (some widgets only): Adjust size using corner handles.
- Edit: Tweak KPIs, display format, or apply markup.
- Add notes: Include contextual insights that appear as clickable icons.
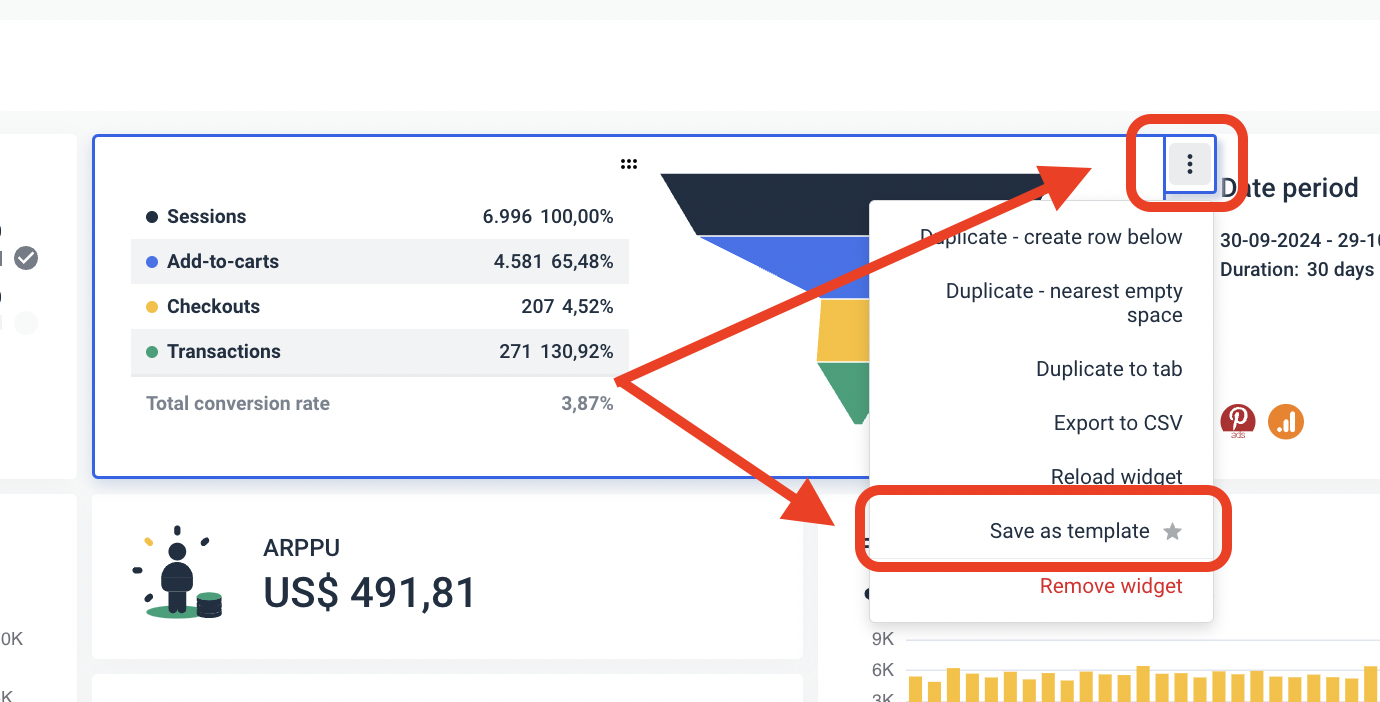
- Refresh data: Manually pull the latest data if needed.
- Delete: Remove a widget entirely (but you can’t undo this).
This is where the dashboard customization ends—which is pretty basic when compared to a reporting tool like Whatagraph, or even AgencyAnalytics.
For example, on Whatagraph, you can customize each widget to your heart’s content. You can:
- Write custom titles and descriptions
- Change the currency display
- Hide or show footers
- Choose custom colors
- Choose icons from an icon library
Want even more customization? You can create custom widgets from scratch – with the exact data and filters you want to see – and save them as “templates” so you can add them to any reports you want.
Whatagraph also comes with thoughtful design features that make your user experience smooth as butter. You can:
✅ Change the orientation of your reports as Landscape or Portrait
✅ Add new rows anywhere you want on your dashboard
✅ Adjust the width and height of your charts and graphs right on the dashboard
✅ Save reports as “templates” and re-use them the next time
✅ Add multiple “Tabs” within a single report to visualize performance from different channels or campaigns. This prevents lengthy reports that take ages to load.
Patrick C.,’s recent review highlights our core offerings best:
Whatagraph is extremely flexible, the visuals are beautiful (which is important for having clients be engaged in the reports), very customizable to make complex data easy to ingest for the client.
What white-labeling options are available on DashThis?
DashThis offers basic but functional white-label features to help agencies present dashboards under their own brand. While the customization doesn’t go as deep as some more advanced tools, here’s what you get:
1. Brand customization
You can visually tailor your dashboards in a few ways:
- Upload your own logo: Place your agency’s or client’s logo in the dashboard header. Note that logo size is fixed (250 x 125 pixels), and non-2:1 logos may stretch awkwardly.
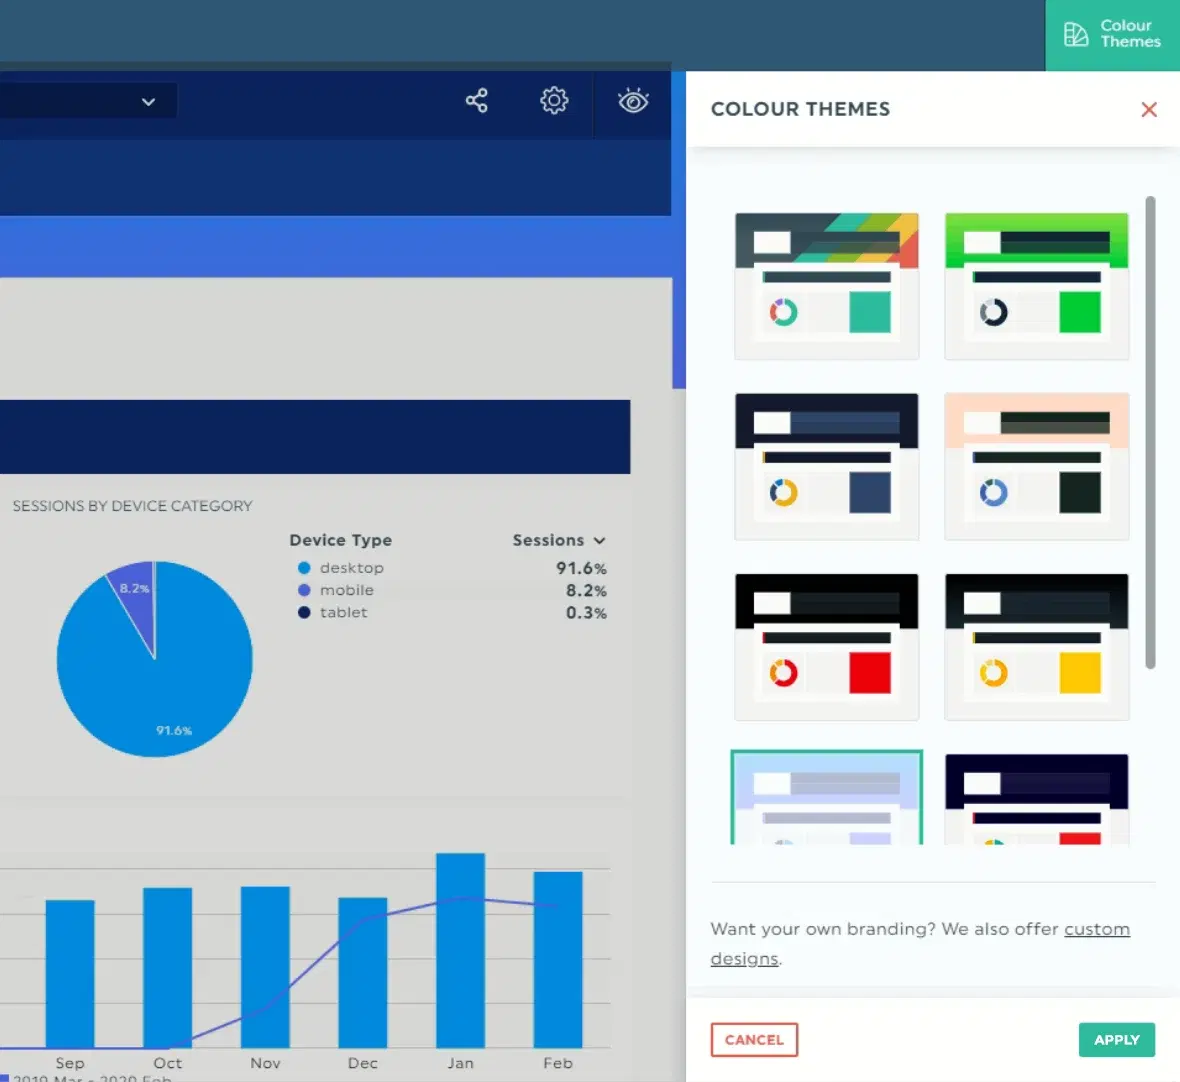
- Preset color themes: Choose from 12 built-in themes to match your brand or client preferences. Themes are applied per dashboard and won’t carry over automatically if you duplicate or template a report.
- Custom color themes: If you manage 10+ dashboards, you can unlock custom color themes. This lets you fully personalize background, header, fluctuation, gauge, and data colors using hex codes.
Important: Custom themes must be manually applied to each dashboard. Even if you use a template or clone a dashboard, the default DashThis theme will override your previous design—so you’ll need to reapply the theme each time.
Where DashThis keeps white-labeling fairly surface-level and manual, Whatagraph offers a more advanced, scalable, and flexible approach to branding—designed for agencies managing multiple clients and dozens (or hundreds) of reports.
Unlike DashThis, where you have to apply themes one dashboard at a time, Whatagraph lets you roll out consistent branding at scale—saving you hours of manual work.
You can apply custom themes at three levels:
- Global team level: Set a universal brand theme (colors, logo, fonts, etc.) and have it automatically applied to all new reports created by your team. No need to manually re-style each new dashboard.
- Report level: Override or fine-tune branding for a specific client or report if needed.
- Widget level: Apply color settings to individual widgets for granular styling control (e.g. highlight specific KPIs in brand colors).
Inside the Custom Branding panel, you can personalize:
- Color schemes (primary, secondary, widget accents)
- Logo and favicon
- Email styles (email header, footer, sender name, and more)
Plus, unlike DashThis, these settings don’t reset when duplicating templates or cloning dashboards. That means you can standardize your branding workflows without reapplying themes from scratch.
2. Custom domain
With a plan that includes 10 dashboards or more, DashThis lets you fully white-label the dashboard URL using a custom domain.
This also includes:
- Removing the "Powered by DashThis" footer
- Sending dashboards from your own custom email address
- Unlocking full access to custom theme creation
Just note: If you want different domains for different clients, you’d need separate DashThis accounts. Only one custom domain per account is supported.
Just like DashThis, Whatagraph supports custom domains—but goes further in how deeply it integrates with your brand:
- Replace the default app.whatagraph.com URL with a branded one like reports.youragency.com
- Automatically send reports and scheduled emails from your own domain, using your company name in the sender field
- Fully remove Whatagraph’s branding for a 100% white-labeled experience
Are there AI features for insights?
DashThis doesn’t offer AI features for insights. This means you need to manually sum up potential campaign issues, trends, and data.
Comparatively, Whatagraph solves this with two innovative AI features.
- AI data chatbot: Ask our AI chatbot any questions about your connected data and campaigns, just like you would talk to your colleague or ChatGPT.
- AI summaries for reports: Generate AI report summaries based on your data and add them directly to your reports.
What are the sharing options?
DashThis gives you three options for sharing your data: through PDF, email, or a live link.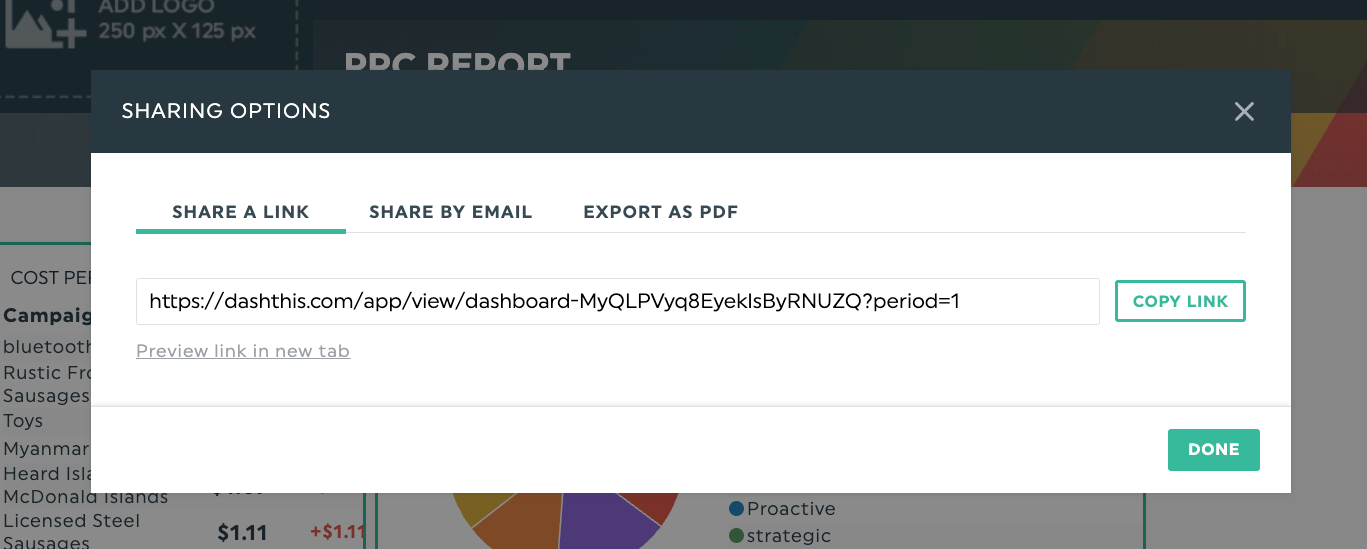
Most reporting tools offer these three default options. But what if you want to ship your data to warehouses or other destinations? DashThis doesn’t unfortunately support that.
On Whatagraph, you have the same sharing options, and you can also ship data from any source to Looker Studio and BigQuery.
You can build basic dashboards, but more advanced linked templates, AI summaries, and data merging are missing.
How does Whatagraph Compare Against DashThis?
So far we’ve given you a detailed review of DashThis and where Whatagraph can help overcome its limitations. But you might be thinking—what is Whatagraph exactly? We explained more below.
Whatagraph is a marketing intelligence platform that makes it extremely easy to connect, organize, visualize, and share marketing data across all your channels.
Here’s how Whatagraph resolves some of the challenges DashThis customers face:
1. Wide range of integrations
- The DashThis challenge: DashThis only has 25+ integrations with marketing platforms, not including more niche ones like SE Ranking or Quora Ads.
- The Whatagraph solution: Whatagraph offers 55 integrations, including with analytics, PPC, social media, SEO, ecommerce, and email marketing platforms. We constantly add new integrations, and a custom API is also available.
One G2 user commented on Whatagraph’s integrations:
The ability to integrate multiple data sources and create customized reports quickly is a great advantage.
2. Real-time, accurate data with 99.95% uptime
- The DashThis challenge: DashThis users report that the data can be unreliable, and the connector can break.
- The Whatagraph solution: Whatagraph’s integrations are fully managed, which means they’re more accurate and stable. We offer an uptime guarantee of 99.95%, so you never have to compromise on your client’s reports.
3. Easier to use
- The DashThis challenge: While it’s easy to create basic reports, managing dashboards and reports one by one is time-consuming.
- The Whatagraph solution: Whatagraph is also easy to use but built for growth. The key difference is master templates and linked reporting. When you update a main template (like adding a new goal or metric), all linked client reports are updated automatically. This eliminates repetitive edits and saves agencies a ton of time as they scale.
4. Fully-customizable dashboards
- The DashThis problem: Dashboards are generally intuitive to use, but not that customizable.
- The Whatagraph solution: With Whatagraph, you can create reports from a blank page, from ready-made report templates, or using our Smart Builder. The widgets are fully responsive, and you can resize them however you want.
Don’t just take our word for it, see what this G2 user said:
Whatagraph's drag-and-drop widgets are so simple to use, they practically make the report FOR you. And because most marketing reports are really dull, I love small touches like customizing icons for widgets!
Want a full breakdown? Check out our guide on DashThis alternatives.
Final Verdict: When to use DashThis and When to Switch to Whatagraph
With so many similarities on the surface, it can be hard to decide between DashThis and Whatagraph—especially when both platforms promise easy-to-use reporting, multi-source dashboards, and white-label options.
But if you’re an agency managing dozens of clients and campaigns (or you plan to scale into this level), Whatagraph makes it easier to deliver holistic, accurate reports across all clients.
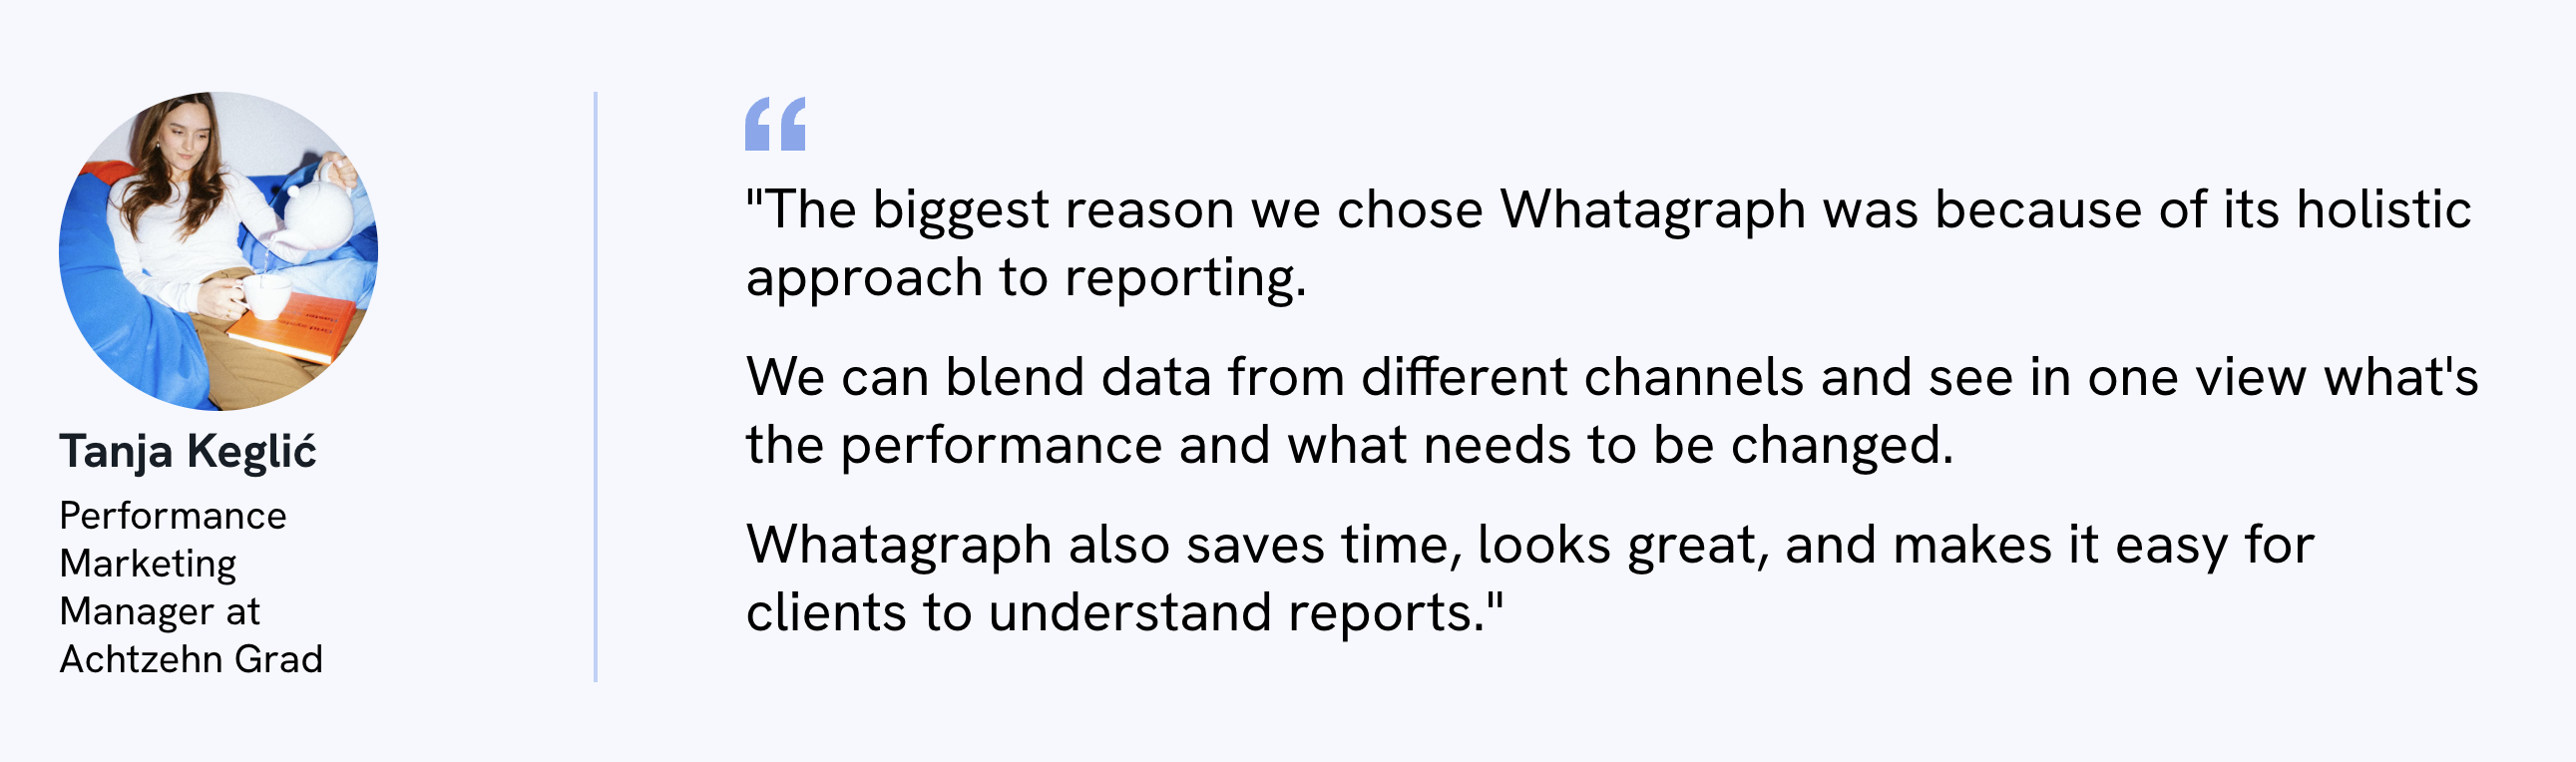
In fact, this is why one of our customers, Tanja Keglić, Performance Marketing Marketer at Achtzehn Grad agency chose us:
Choose DashThis if:
- You need to create simple, visual reports quickly without a learning curve.
- You’re a freelancer or small agency with limited reporting needs.
- You want a budget-friendly option with straightforward pricing.
- You don’t need to blend or calculate data—just show metrics as-is.
- You’re okay with basic white-labeling (logo, preset color themes, simple domains).
In short, DashThis is a starter tool for agencies looking to get a few clean reports out the door with minimal setup. It shines when you’re just getting started and need something simple and affordable.
Choose Whatagraph if:
- You manage multiple clients or campaigns and want scalable reporting workflows.
- You need to create custom metrics, dimensions, or blended KPIs across channels.
- You want to automate reporting using templates, linked reports, and AI summaries.
- You’re looking for deep customization: branding, widget design, layouts, filters.
- You need to connect niche tools or offline data via API, CSV, or warehouse exports.
Whatagraph is ideal for agencies that are scaling. It’s built not just for sharing reports—but for organizing your reporting ops in a way that’s scalable, efficient, and fully client-ready.
Want to see if Whatagraph is the right fit for you? Talk to our team today.