What is Google BigQuery and How Does it Work? – The Ultimate Guide
Companies increasingly rely on data-driven decision-making and embracing an open data culture where the data is not siloed among multiple vendors, behind multiple APIs with their limitations. Data warehouses like Google BigQuery, Snowflake, Amazon Redshift, and Microsoft Azure play a big part in driving the innovation. In this guide, we talk about BigQuery, an enterprise-grade data warehouse based on Google Cloud infrastructure.

Jan 11 2023●7 min read

What is Google BigQuery?
Google BigQuery is a serverless, highly-scalable data warehouse with a built-in query engine. The engine is powerful enough to run queries on terabytes of data in seconds and petabytes in only minutes.
The story of BigQuery began in late 2010 when the site director of the Google Seattle office commandeered several engineers and asked them to build a data marketplace that wouldn’t require users to download terabytes of datasets to their own machines.
So they employed a principle popularized by Jim Gray, the database pioneer:
“When you have big data, you want to move the computation to the data, rather than move the data to the computation.”
So the engineers decided to build a computer engine and storage system in the cloud.
As mentioned before, BigQuery is fundamentally different from on-premises cloud data warehouses like Redshift and Microsoft Azure.
It’s the first data warehouse that offers a scale-out solution. This means that the only limit in speed and scale is the amount of hardware in the data center.
This is a similar approach we had when designing Whatagraph’s data transfer feature. We wanted to give every user the same level of speed and scale, no matter the data stack they use.
Basically, we had two types of users in mind:
- Small non-tech teams
- Marketing agencies that handle hundreds of clients, each with their own data stacks
In both cases, Whatagraph saves the time needed to load data from multiple sources to Google BigQuery.
With Whatagraph, the data transfer process has never been simpler.
No code knowledge or data engineering is required – just point and click.
Let’s take a look at features that make BigQuery stand out and how to use it.
Decoupled compute and storage
In many data warehouses, compute and storage are located together on the same physical hardware. This means that to add more storage, you might need to add more compute power and the other way around.
That wouldn’t be a problem if everyone’s data needs were similar.
But in reality, some data warehouses are limited by compute capacity, so they slow down at peak times. Other data warehouses are limited by storage capacity, so maintainers must figure out what data to delete.
When your compute and storage are separated, as BigQuery does, you never have to throw out data, unless you don’t need it anymore.
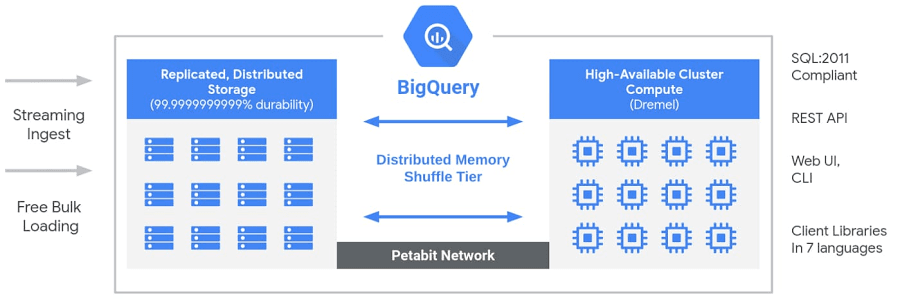
Let’s say you want to calculate something differently and need the raw data to re-query it. This wouldn’t be possible if you discarded the source data to make space.
Scalable compute is also important. BigQuery resources are represented as slots, about half of a CPU core. These slots indicate how many physical compute resources are available.
So if your queries run too slow, add more slots. Do you want to have more people creating reports? Add more slots. Need to cut back on expenses? Decrease the slots.
Google BigQuery has users with petabytes of data who use a relatively small amount daily. Other customers store only a few gigabytes but perform complex queries using thousands of CPUs simultaneously.
Thanks to decoupled compute and storage, BigQuery can accommodate a wide range of customer needs.
Storage and networking architecture
Thanks to its serverless architecture, BigQuery storage is decoupled from compute, allowing teams to scale functionalities independently on demand.
This results in immense flexibility and cost optimization for customers who don’t have to keep their expensive compute resources running all the time.
This differs from traditional node-based cloud data warehouses or on-premise massively parallel processing (MPP) systems.
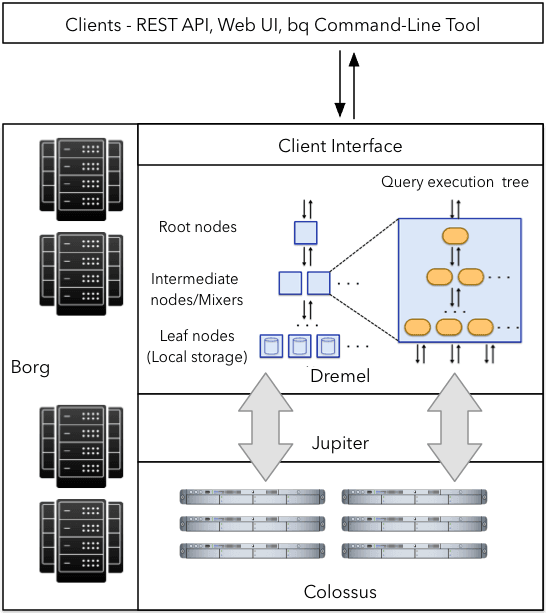
Under the hood, BigQuery employs a huge set of multi-tenant services powered by low-level Google Infrastructure technologies like Dremel, Colossus, Jupiter, and Borg.
- Dremel is a large multi-tenant cluster that executes SQL queries. It turns SQL queries into execution trees. The tree leaves are called slots, and they do the heavy lifting of reading data from storage and performing necessary computations. Dremel dynamically appropriates slots to queries on an as-needed basis. This enables simultaneous queries from multiple users and allows a single user to get thousands of slots to run their queries.
- Colossus is Google’s global storage system. BigQuery uses the columnar storage format and compression algorithm to store data in Colossus, which is optimized for reading large amounts of structured data. Thanks to Colossus, BigQuery users can scale up to dozens of petabytes of data seamlessly without investing in much more expensive compute resources as in traditional data warehouses.
- Jupiter is the petabit network that BigQuery compute and storage use to talk to each other. Google’s Jupiter network moves data extremely rapidly from one place to another.
- Borg is BigQuery’s orchestration ecosystem. Borg runs the mixer and slots, which allocates hardware resources.
The important aspect of BigQuery is that Google is continuously improving these technologies.
As a result, users get a scalable data warehouse that constantly improves in performance, durability, and efficiency,
More importantly, the decoupled architecture enables upgrades without downtime, which is often a problem with traditional solutions.
How to use Google BigQuery?
Now, let’s add some data into BigQuery and see how it works.
The first step is to choose the project you want and click Create Dataset.
Assign a Dataset ID — letters and numbers. You can select the data location, table expiration, and encryption. After that, click Create Dataset.
You can find your new dataset by clicking the Expand node button.
The next step is to create a BigQuery table in the dataset. You can:
- Create an empty table and fill it manually
- Upload a table from your device
- Import a table from Google Cloud Storage or Google Drive
- Import a table from Google Cloud Bigtable through the CLI
What file formats can you import into BigQuery?
You can load your data into BigQuery in these formats:
- CSV
- JSON
- Avro
- Parquet
- ORC
- Google Sheets
- Cloud Datastore Backup
You can’t import Excel files directly into BigQuery. Either convert your Excel files to CSV or convert Excel to Google Sheets first.
Upload CSV data to BigQuery
When you click the Create table button, you need to:
1. Choose source — Upload
2. Select file — click Browse and choose the CSV file from your device
3. File format — choose CSV, although the system automatically detects the file format
4. Table name — enter the table name
5. Check the Auto detect checkbox.
6. Click Create table
Upload data from Google Sheets to BigQuery manually
The workflow is similar to uploading CSV files, with some modifications.
Click the Create table button and:
1. Choose source — Drive
2. Select Drive URI — insert the URL of your Google Sheets spreadsheet
3. File format — choose Google Sheets
4. Sheet range — specify the sheet and data range to import.
5. Table name — enter the table name
6. Check the Auto detect box
7. Click Create table
Load data to BigQuery from Google Sheets and other platforms on a schedule
If you have a data set in Google Sheets that you need to import to BigQuery every day, you have two options:
Load data manually
OR
Automate the import to BigQuery using one of the integrations provided by Whatagraph.
Whatagraph can now natively move data from different sources to customers’ BigQuery accounts according to schedule.
These include the most popular marketing tools such as Google Ads, Facebook Ads, LinkedIn Ads, TikTok Ads, Instagram, and many more.
The manual method works fine for in-house marketing teams and certain use cases. Still, if you have hundreds of accounts and want to track metrics from multiple data sources, you will benefit from Whatagraph integrations.
Whatagraph is a fully managed data connector that completely automates loading data from your desired sources and transforming it into analysis-ready form without writing a single line of code.
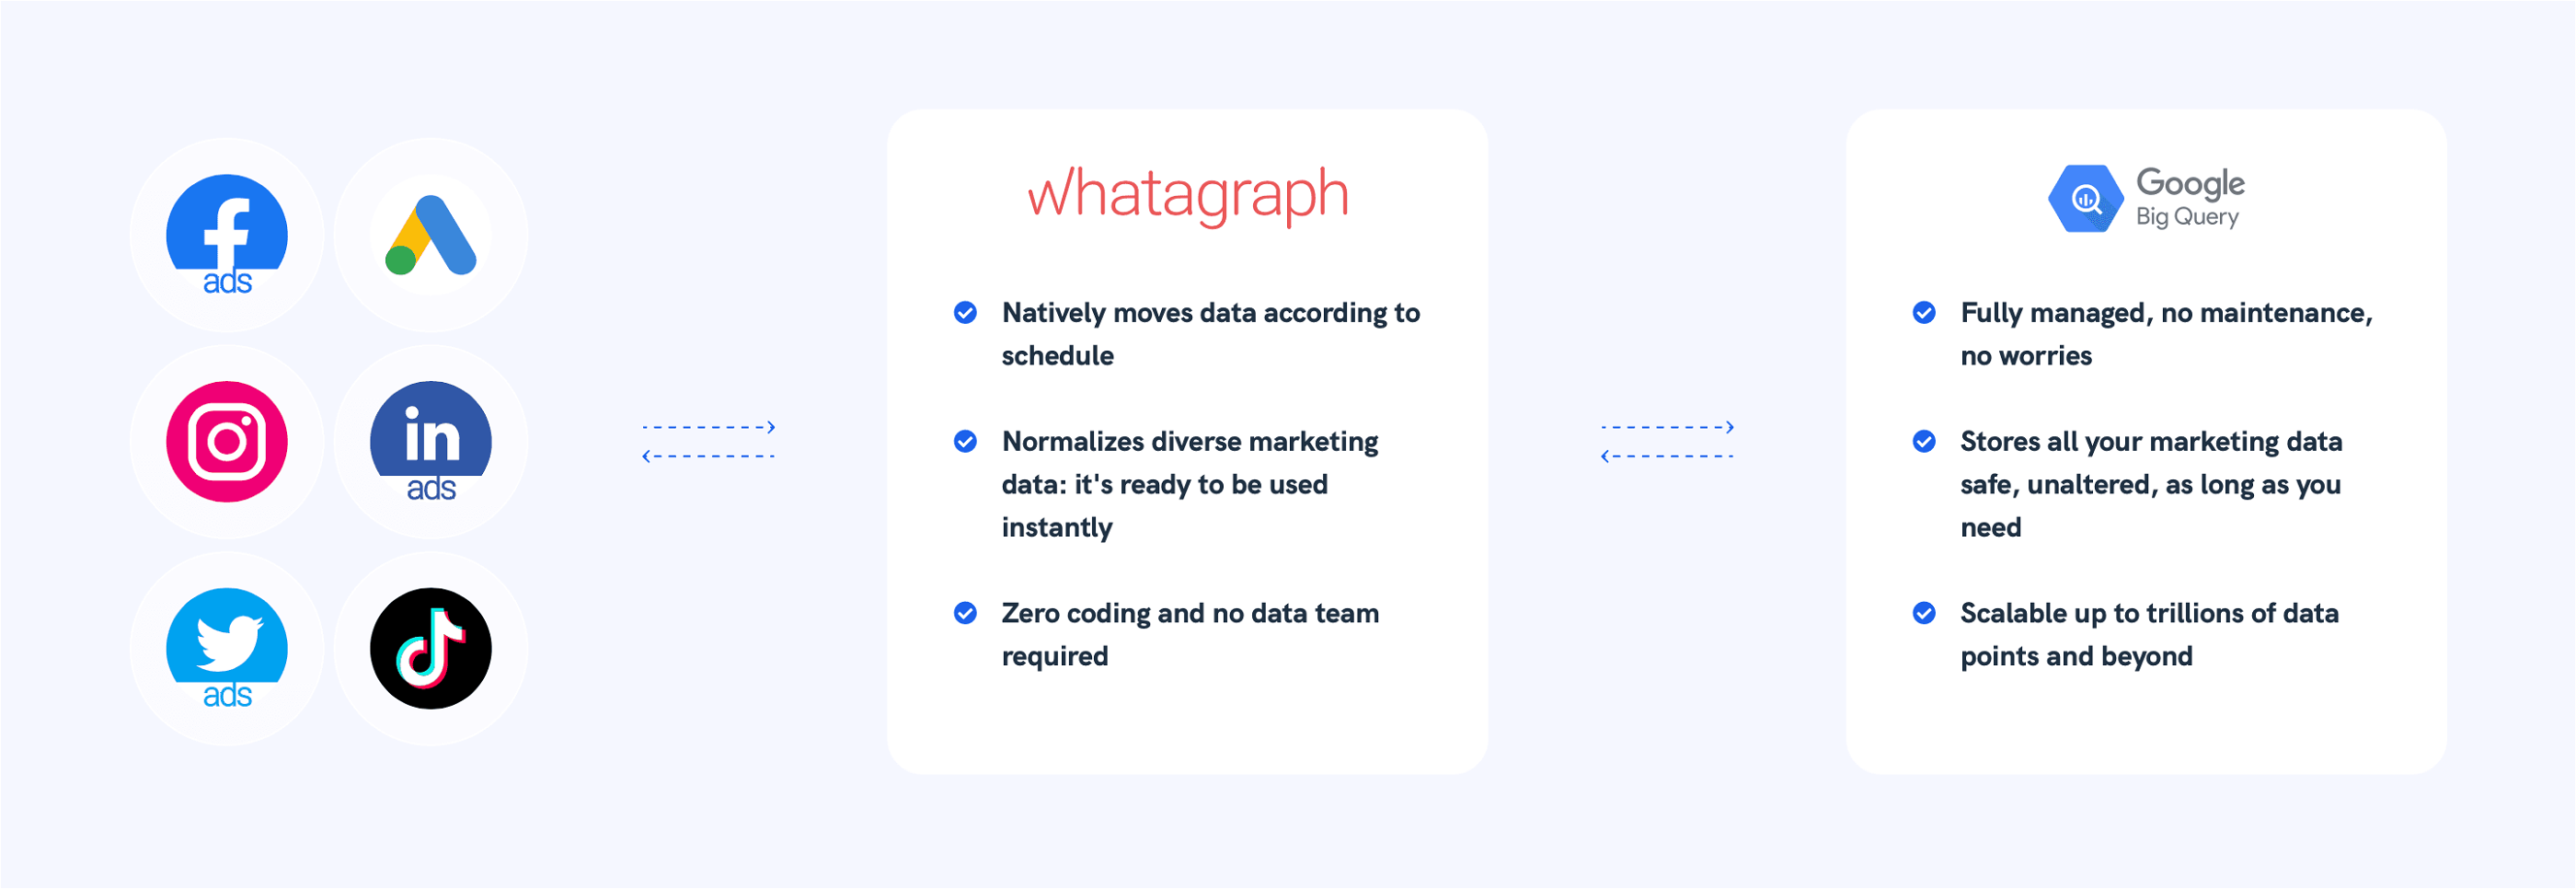
Whatagraph takes care of data integration and lets you focus on key business activities and draw more accurate insights on generating more leads.
If you’re looking for an easy-to-use solution to connect data from various marketing sources, keep your marketing data safe, or want to visualize your BigQuery data, book a demo call and find out how Whatagraph can help.
Google BigQuery ETL data load
A shortcut would be to Extract data from the data source, Transform it into a format that BigQuery accepts, upload this data to Google Cloud Storage (GCS) and Load it to BigQuery from GSC.
There are multiple ways of loading data to BigQuery. It gets pretty easy if you’re moving from Google Applications, such as Google Analytics, Google Ads, Data Studio, etc.
Google provides a robust BigQuery Data Transfer Service — Google’s own in-house data migration tool.
However, if you load data from other sources — databases, cloud applications, and marketing tools, you need to deploy engineering resources to write custom scripts.
Keep in mind that custom coding scripts to move data to Google BigQuery is both complex and time-consuming.
A third-party data pipeline platform like Whatagraph can make this a hassle-free process.
Why use Whatagraph to ETL data to BigQuery?
Easy to use: Whatagraph has a simple and interactive UI that requires minimal learning for new users.
Built to scale: As the number of sources and your data volume grows, Whatagraph scales to meet your needs.
Managed schema: Whatagraph eliminates the complex task of schema management and automatically detects the schema of incoming data and maps it accordingly.
BI engine: Google BigQuery uses standard SQL queries to create and execute machine learning models and integrate them with other Business Intelligence tools.
Data visualization: Visualize data stored in BigQuery back in Whatagraph using interactive dashboards.
Live support: The Whatagraph team is available 20 hours a day, 5 days a week, to offer customer support through live chat, e-mail, and support calls.
Flexible pricing: Clear, transparent pricing where you know what you pay for.
4 types of BigQuery analytics
BigQuery is optimized to run analytic queries on large datasets. This data warehouse supports several types of data analysis workflows:
1. Ad hoc analysis: Google Standard SQL allows users to run queries in the Google Cloud or through third-party apps.
2. Geospatial analysis: BigQuery uses geography data types and GS SQL geography functions to let users analyze and visualize geospatial data.
3. Machine learning: Create and execute machine learning (ML) models in BigQuery.
4. Business intelligence: BigQuery BI Engine allows users to build rich interactive dashboards and report without compromising performance, scalability, security, and freshness of data.
4 types of BigQuery data
BigQuery allows users to query the following data source types:
1. Data stored in BigQuery: Users can load data into BigQuery for analysis using BigQuery native data connectors or a third-party pipeline like Whatagraph.
2. External Data: You can query different external data sources like other Google Cloud services or database services.
3. Multi-cloud data: You can query data stored in other public clouds, such as Redshift or Azure.
4. Public datasets: If you don’t have your own data, you can analyze the datasets available in the public dataset marketplace. Google Cloud public datasets contain over 200 high-demand public datasets from different industries. Customers can query up to 1 TB of data per month at no cost.
Top 5 Google BigQuery data visualization tools
BigQuery has no visualization capabilities but integrates well with various visualization tools.
Here are some of the best tools for visualizing your BigQuery data.
1. Whatagraph
Whatagraph has a data connector for BigQuery that lets you transfer data from any marketing source to BigQuery.
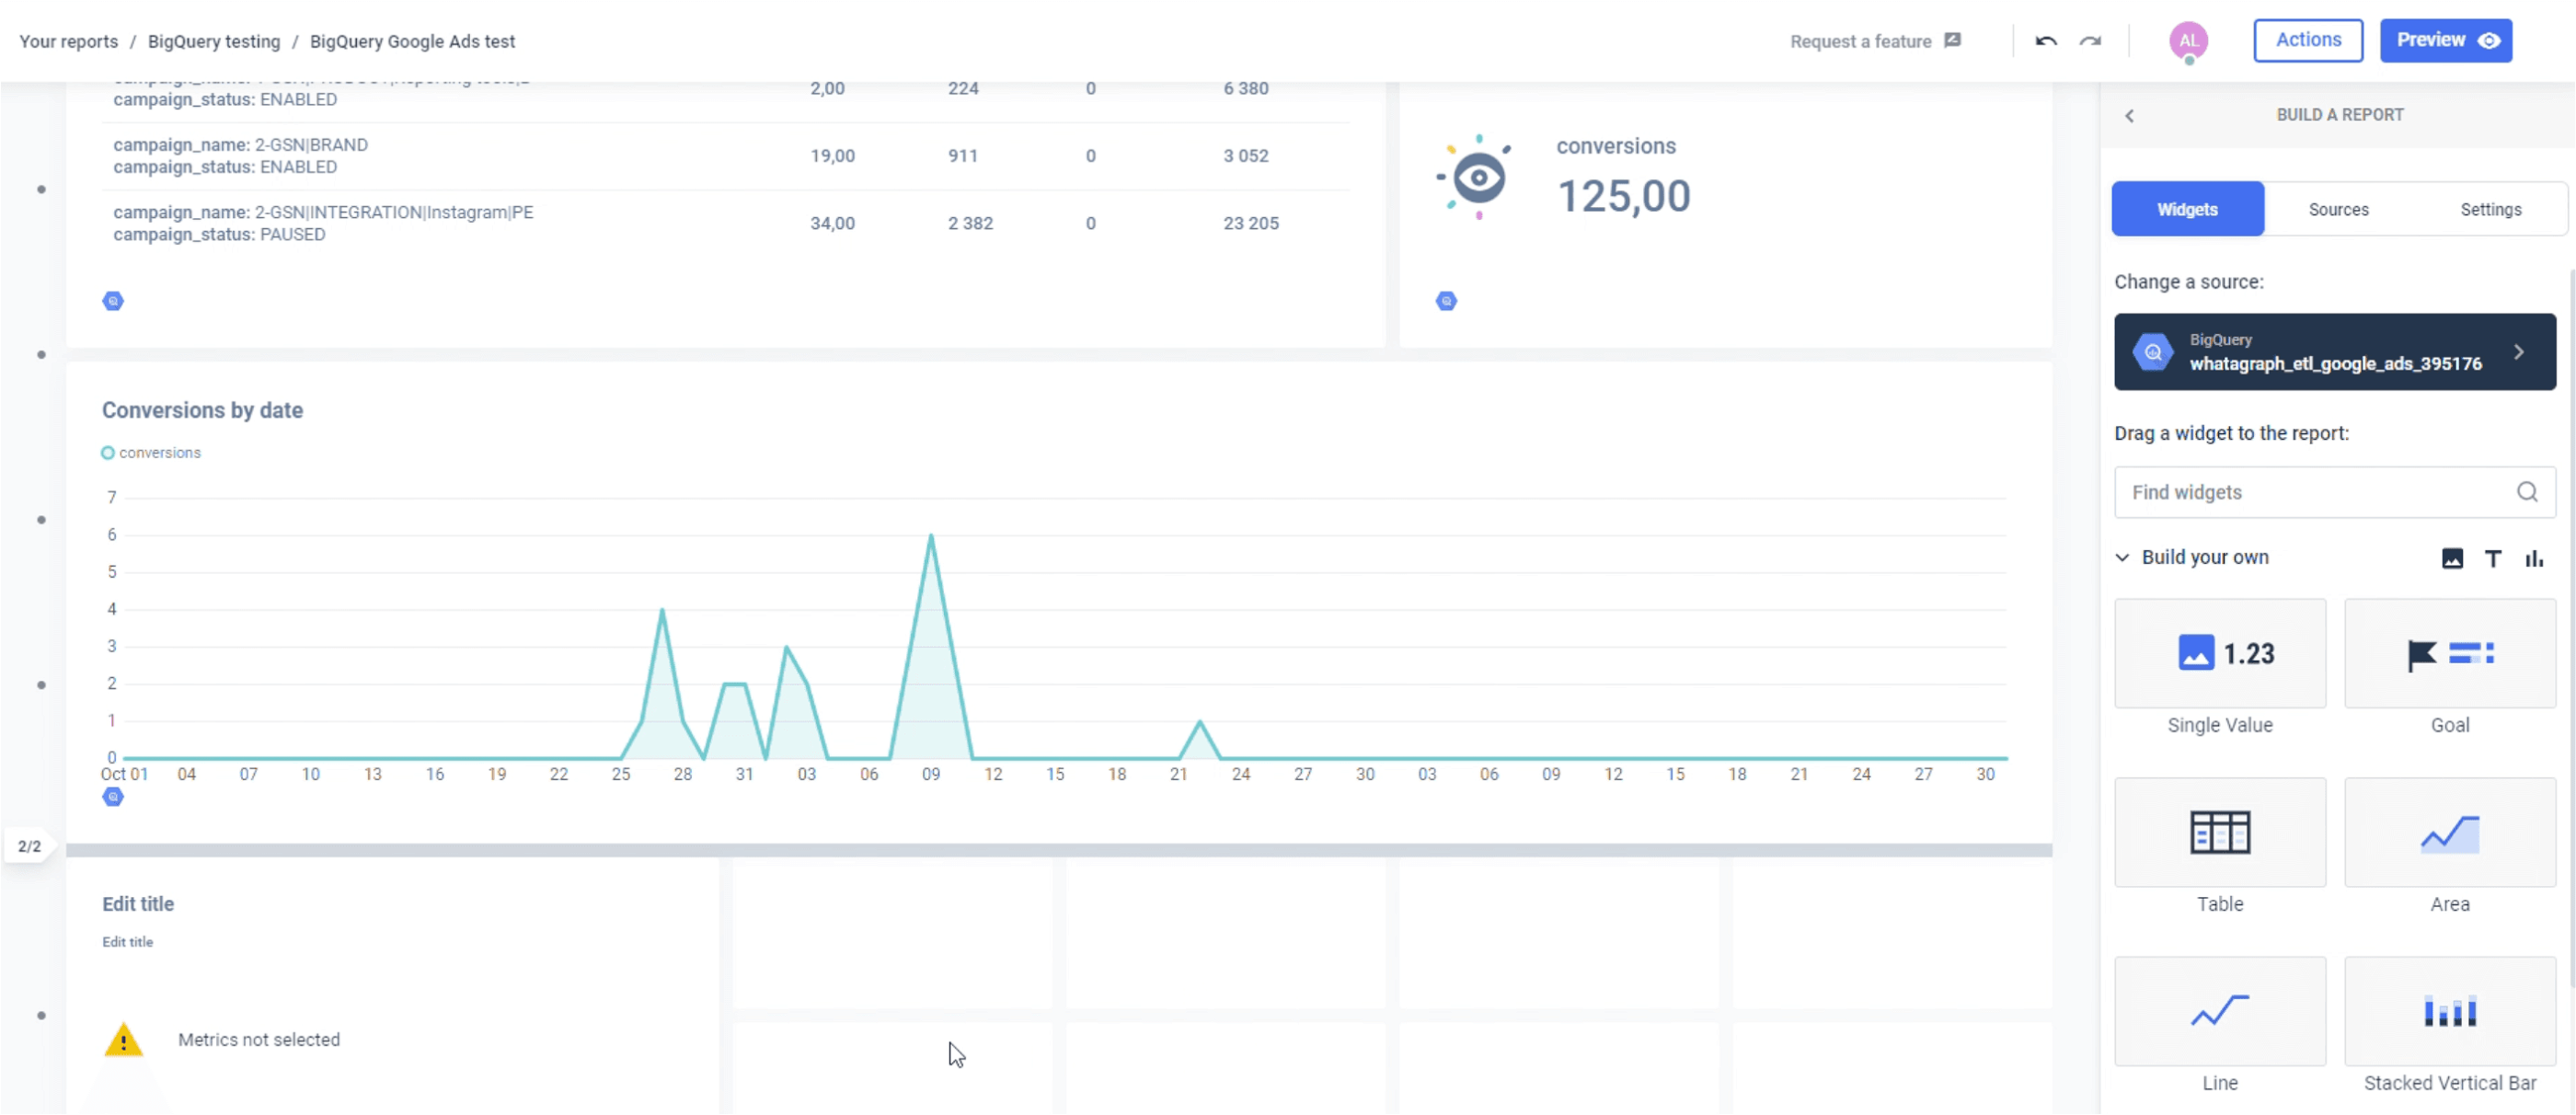
If you don’t know where to start, use our library of pre-made report templates to create reports that meet your company's specifications.
2. Tableau
This BigQuery data visualization and reporting tool is compatible with almost any database. Tableau also has a drag-and-drop feature and plenty of integrations. Still, it lacks some functionalities that you’d expect from a thoroughbred business intelligence tool.
3. Hevo Data
A no-code data pipeline that helps users load data from any source, such as MySQL, SaaS applications, Cloud Storage, etc. Hevo Data is a popular choice due to its scalable architecture and support of different business intelligence tools.
4. Power BI
Developed by Microsoft, this data visualization tool allows you to unify data from various external sources and create insightful reports. At an enterprise scale, it provides self-service analytics options and data centralization. The only drawback is that the tool enables data modeling only with Windows Desktop.
5. Looker
Another product from the Google Cloud Platform, Looker helps you create insightful visualizations and user-friendly workflow. Although it provides access to the full data sets and supports data centralization, it lacks advanced charting functionality.
Pros & cons of Google BigQuery in 2023
Pros
- Focus on data-driven insights
BigQuery allows you to have maximized query performance without having to manage any infrastructure and without having to create and rebuild indexes.
As customers have no infrastructure to manage, they can focus on uncovering meaningful insights using familiar SQL without going through a database administrator. As a result, cloud-based data warehousing becomes more economical because teams pay only for processing and storage use.
In addition, BigQuery integrates with various Google Cloud Platform (GCP) services and third-party tools.
- Analytics at every stage of the data lifecycle
BigQuery covers the entire analytics value chain, including ingesting, processing, and storing data, supported by advanced data analytics and collaboration.
At each stage of the data cycle, Google Cloud Platform provides scalable services to manage data. In other words, teams can select services tailored to their data and workflow.
- Ingest data from various sources
BigQuery supports multiple ways to ingest data into its managed storage. The specific method depends on the origin of the data. For example, many GCP data sources, such as Cloud Logging and Google Analytics, support direct exports to BigQuery.
BigQuery Data Transfer Service also allows data transfer to BigQuery from Google SaaS apps like Google Ads and Cloud Storage, Amazon S3, and other data warehouses like Teradata, Redshift, etc.
Streaming data, such as logs or IoT device data, can also be loaded to BigQuery using Cloud Dataflow pipelines or directly, via the BigQuery stream ingestion API.
- Secure Virtual Private Cloud (VPC)
BigQuery’s security model is tightly coupled with the rest of Google’s Cloud Platform, which gives users a holistic view of their data security.
What does that mean?
First, BigQuery uses Google’s Identity and Access Management (IAM) access control system to assign specific permissions to individual users or groups.
BigQuery also inherits Google’s Virtual Private Cloud policy controls, which protect against users who try to access data from outside your organization or export it to third parties.
The best thing is that both IAM and VPC controls are designed to work across the Google Cloud Platform, so there’s no worry that certain products create a security hole.
Google Cloud has more than two dozen data centers worldwide, with new ones popping up quickly.
So, for example, if you have business reasons for keeping data in the US, you can do it. Create your dataset with the US region code, and all your queries against stored data will be done within that region.
Cons
- Too powerful for some users
Google BigQuery is designed to handle very large datasets at super-fast speeds. As such, it might not be the right solution for businesses operating only in small datasets.
- Pricing can add up
Google BigQuery is reasonably priced, and separated storage and compute give businesses better control over pricing. However, the costs can add up for businesses that don’t pay attention to the tools they use or the scale of their operations.
- Unique SQL
BigQuery uses a unique SQL implementation that helps to smooth data querying. The problem is that several BigQuery SQL dialects can be confusing, especially for new users. On the bright side, it allows customers to restore standard SQL.
Google BigQuery pricing
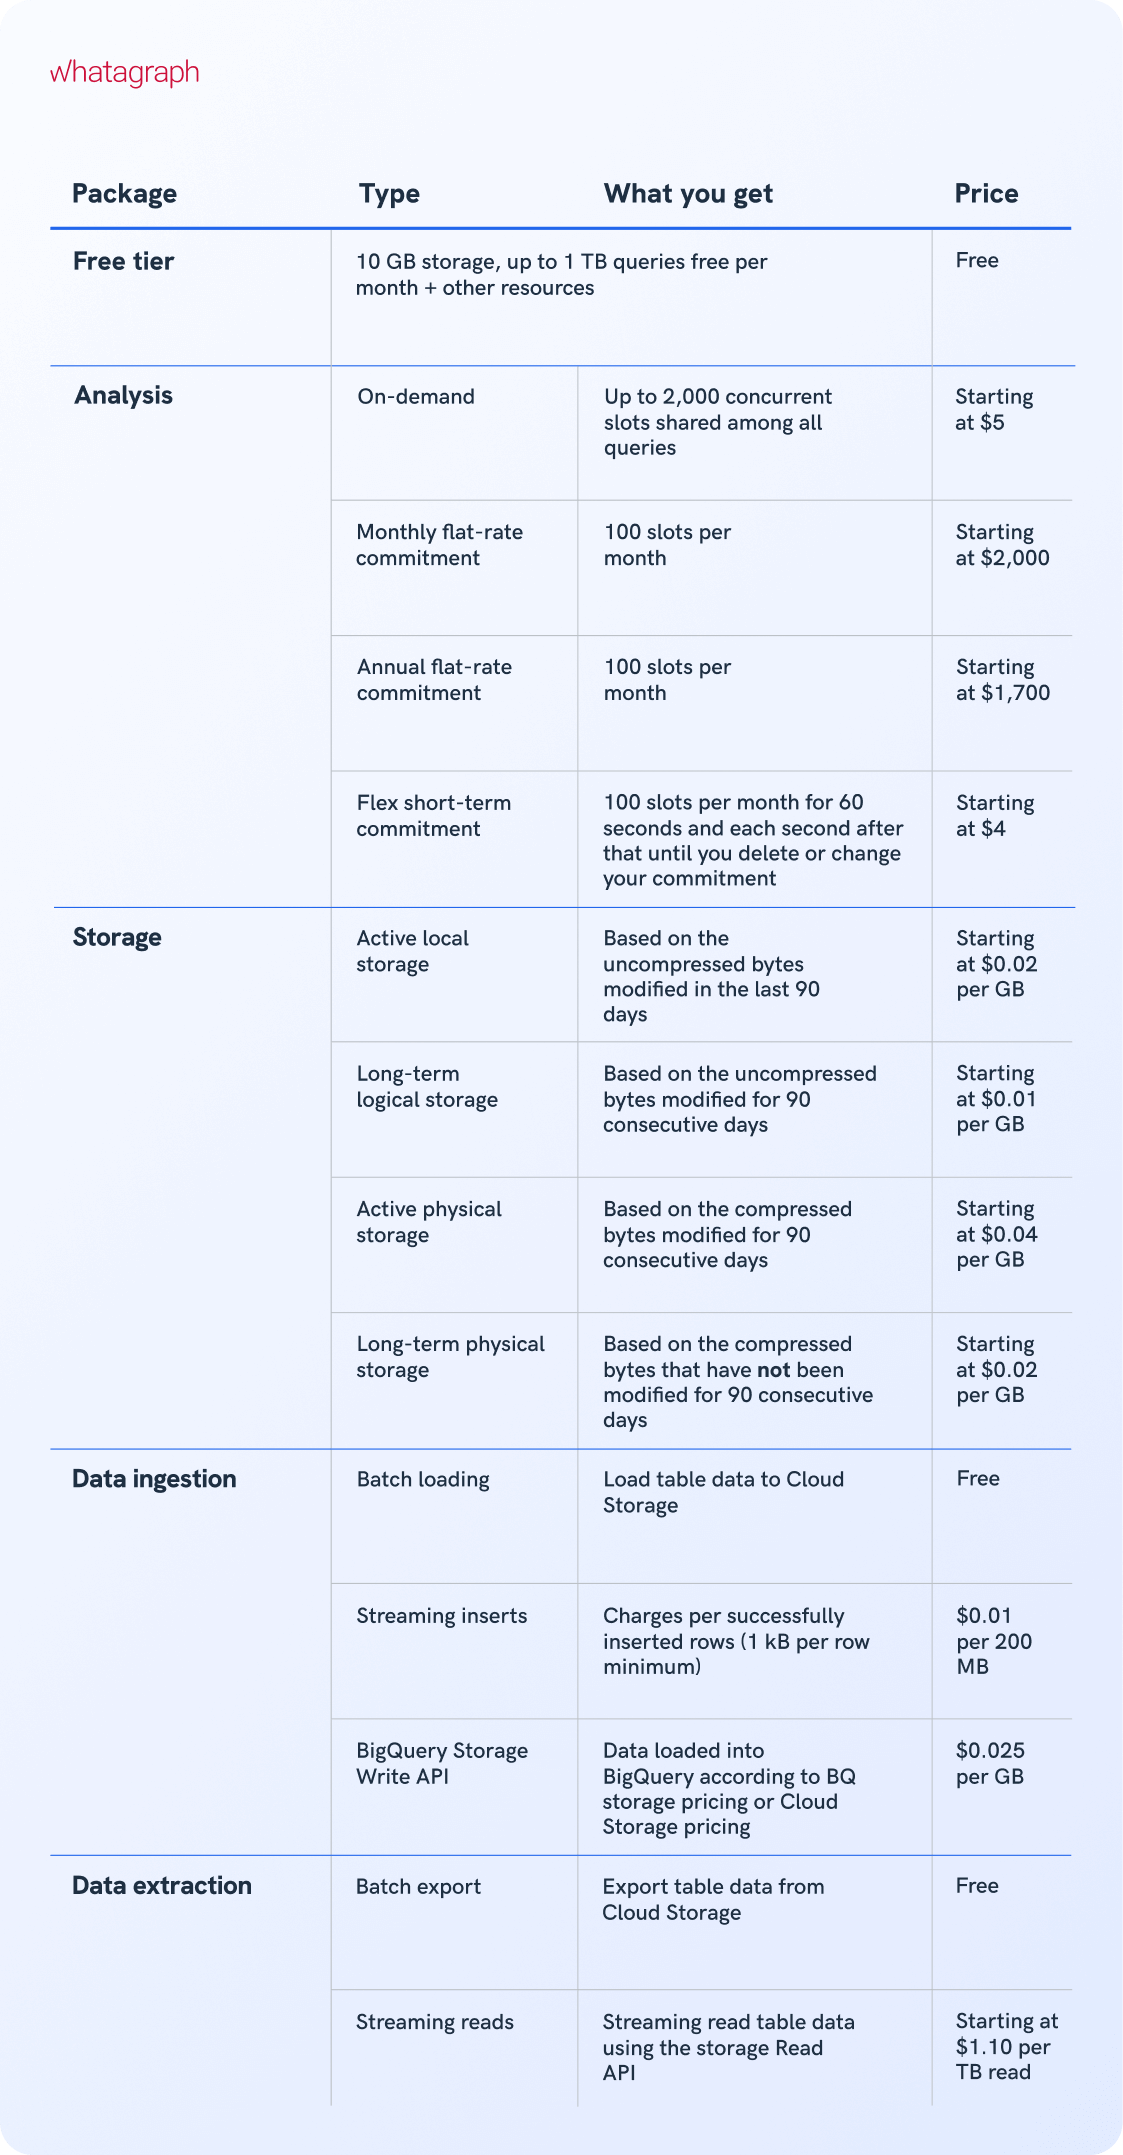
BigQuery pricing depends on analysis type, storage, data ingestion and extraction, and additional services. Loading and exporting data are free.
Let’s take a look at the BQ pricing model.
Conclusion
BigQuery has matured into a sophisticated, capable, and secure data warehousing service that can process terabytes of data within a few seconds. As part of Google’s Cloud Platform, it enables seamless data migration and aggregation from Google platforms. However, if you need to integrate data from different sources, open-source libraries, or business intelligence tools, try Whatagraph.

WRITTEN BY
Nikola GemesNikola is a content marketer at Whatagraph with extensive writing experience in SaaS and tech niches. With a background in content management apps and composable architectures, it's his job to educate readers about the latest developments in the world of marketing data, data warehousing, headless architectures, and federated content platforms.


