Daily Report Template
Keep track of all your vital marketing metrics day after day. Bring the most up-to-date metrics from all your marketing tools to one location with our daily report. Why wait the whole month to see the results of your marketing efforts? Check the progress of your marketing campaigns first thing in the morning. All the essential marketing analytics insights in one place.
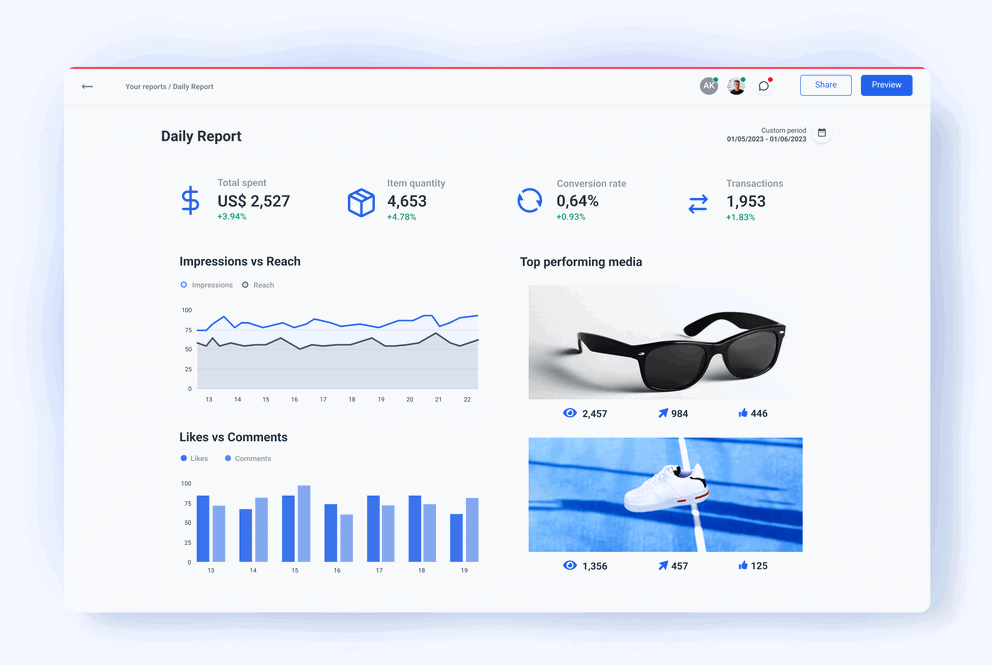


All-in-one daily report for tracking your campaign performance
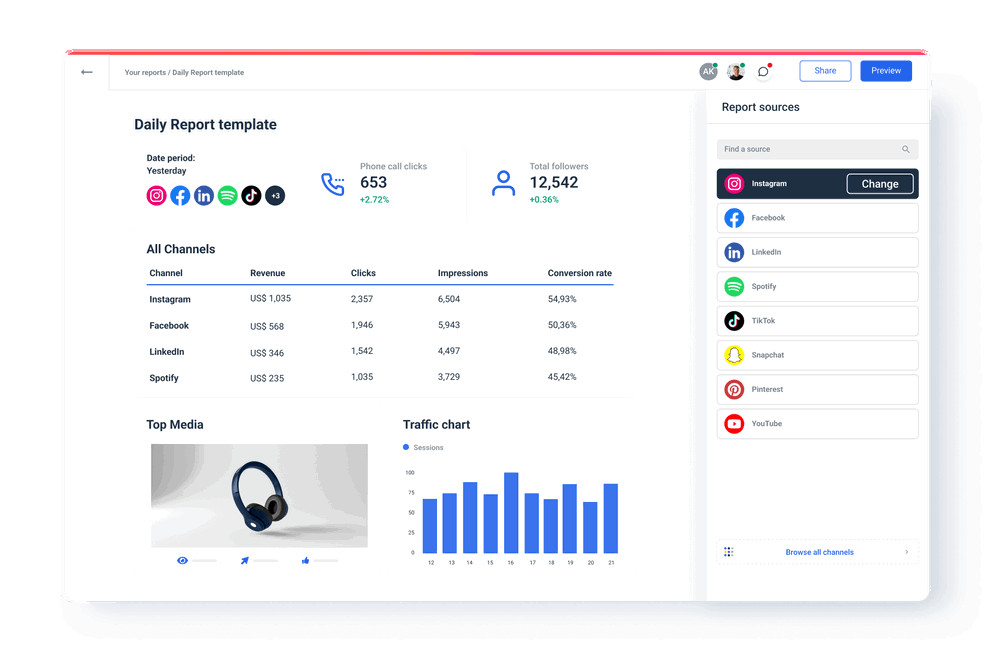
Gather data daily from all your marketing platforms
Our daily report gives you the latest marketing developments in just a few clicks. Automatically track essential marketing KPIs from your platform of choice — email marketing, social media, SEO, paid media, web analytics, or e-commerce. Connect any marketing source you have through native integrations or custom API and effortlessly visualize cross-channel performance data. Compare conversion metrics from related marketing channels or blend them for a total score.
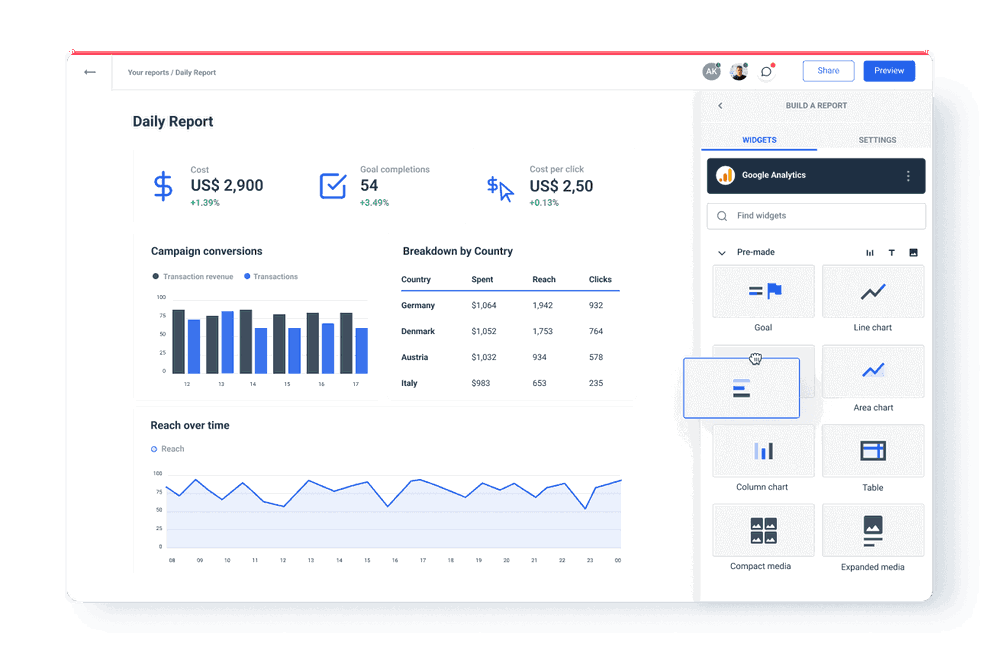
Create custom reports that fit your client’s needs
Building great visual reports is no easy task — especially when handling multiple clients as an agency or managing multiple marketing platforms within a firm. Whatagraph has various report widgets and customization options available to you that make report building a breeze. Change any part of your daily report in seconds: Drag in a new widget or replace the old one. Change the metrics and dimensions for every widget, bring in another source, or apply a filter. Use custom formulas to blend data, unify dimension names across channels, or create new metrics.
Deliver valuable marketing insights fast
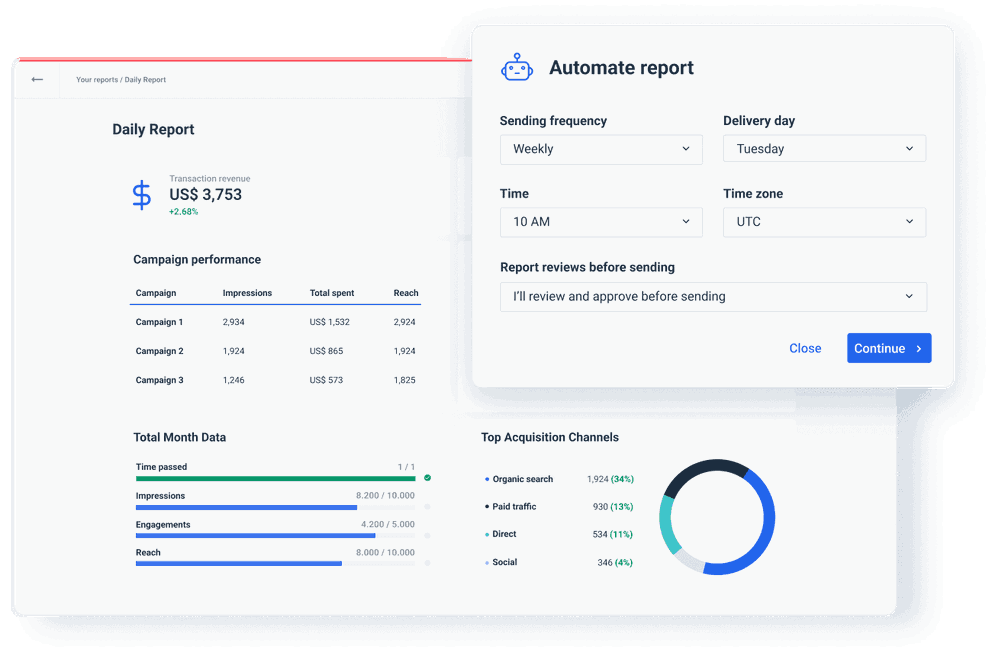
Assess the performance of your top marketing platforms and campaigns at a moment's notice using our daily marketing report. The data refreshes every 30 minutes, so you’ll never fall behind the current status. Schedule daily send-outs directly from the platform. These automated emails can remind you to check your marketing data every day. Just add the recipients and delivery time, and every client and stakeholder will get their daily reports on time, freeing your marketing team from manual sending.
What is a daily report?
A daily report is a marketing performance report that contains the most important metrics of different marketing activities you can monitor on a daily level, such as average session duration, keyword rankings, and other search engine optimization metrics. The main goal of this type of report is to identify threats so you can react immediately and make informed decisions early on.
All reporting features you need for daily insights


Frequently Asked Questions
How do you write a daily marketing report?
You write a daily marketing report following these steps:
1. Determine the purpose of the daily report
2. Define the marketing goals to track daily
3. Identify the information you need
4. Organize marketing data in a way that tells a story
5. Save the report outline for future daily reports
6. Automate daily sending or share a live link for real-time access
What should be in a daily report?
You should include the number of people coming to your client’s site and where they come from. Also, include data on how visitors are engaging with your site.
You can also include a section showing your marketing budget allocation across different channels.
If the client’s content marketing involves regular blog posts, show which is the most popular. The same goes for top product landing pages and social media posts. Whatagraph’s daily report has media widgets to display the top-performing posts with selected metrics.
How do you create a daily report in Whatagraph?
The best way to create a daily report in Whatagraph is to start from a blank page and use our intuitive drag-and-drop builder. Add the marketing channels you need data from and drop the widgets to the page. Once you get all the essential daily marketing metrics in one place, use the sending automation functionality to schedule the report for daily send-out, and your report is ready to go.
What marketing data sources does Whatagraph support?
Whatagraph has native integrations that allow you to easily connect data from a wide range of marketing platforms such as Google Analytics 4, social media channels like Instagram and LinkedIn, PPC channels like Facebook Ads, Google Ads, SEO reporting tools like Google Search Console, Semrush and Ahrefs, and CRMs like HubSpot and Salesforce.
You can also connect data from any source via a custom API, or by exporting it to Google Sheets or Google BigQuery.
Can I export my daily report?
Yes, you can export the whole daily report, a widget, or a group of widgets as CSV files or Excel spreadsheets.
What metrics and key performance indicators should I include in a daily report?
The key metrics and KPIs you should include in your daily report depend on your business goals, marketing strategy, and channels you’re using to reach your target audience, but if you don’t know where to start, here’s what you should consider:
Website Traffic:
- Total website visits
- New vs. returning visitors
- Pageviews per session
- Bounce rate
Social Media Metrics:
- Followers/likes
- Engagement rate (likes, comments, shares)
- Click-through rate (CTR) on shared links
- Impressions
Email Marketing:
- Open rate
- Click-through rate (CTR)
- Conversion rate
- Unsubscribe rate
Advertising Performance:
- Cost per click (CPC)
- Click-through rate (CTR)
- Conversion rate
- Return on ad spend (ROAS)
- Return on investment (ROI)
Lead Generation:
- Number of leads generated
- Conversion rate of leads to customers
- Cost per lead
Content Marketing:
- Blog views
- Downloads of gated content
- Social shares of content
SEO Metrics:
- Keyword rankings
- Organic traffic
- Backlink growth
Make sure to represent each metric with an appropriate graph, chart, or another data visualization to make the information more digestible and easier to find.
How to turn my daily report into a weekly marketing report?
You can easily turn your daily report into a weekly report by setting the sending frequency to “weekly”. Instead of every day, the recipients will get the report with data that has accumulated over the week.
Other useful report template examples to track business performance
View All TemplatesNo credit card required



It’s good to be loved! Our clients are not shy about expressing it.
I made a switch from GDS and Sheets for reporting to Whatagraph, and I am saving literal hours each week on performance report creation. Our small firm actually managed to onboard 2 new clients as a result of all the time we saved on managing data and reporting. The customer service is also really helpful and easy to reach.
Having active customer support to help fix any issues was a big contributor, but we also really liked the ability to save templates and connect sources to multiple charts/widgets at once without having to edit them individually. And having the grid layout is much easier to stay consistent with than the free form setup that Data Studio has.
The system has standard templates that are easy and fast to use. Also you can build your own report with lightning speed. It is very easy to use, has a lot of integration, and let get started very fast.
We love Whatagraph - we would definitely recommend and our account manager is great! I love how easy this tool is to use, everyone on the team finds it much more user-friendly than other dashboards. Integration was easy, we sent some example reports to the team who duplicated these for us. We literally had to log in and send it to our clients!
We are showing our clients the work that we're doing for them and this is incredibly important for our clients ROI. They want to see results and having a tool like Whatagraph that can show data from virtually every source we use is hugely important.
The tool is easy to use; you do not need to have development resources. Even my junior project managers are capable of making campaign reports in minutes. There are a lot of pre-made templates you can use as well as many pre-made widgets.
Really easy to connect data sources within the tool. The library of report templates has been helpful. The customer support team has been responsive to all of our needs. Our team enjoys the simplicity of setting up the reports and how the data is presented.


