

What is a LinkedIn analytics report template?
A LinkedIn analytics report template is a pre-built layout that pulls your LinkedIn page data into one structured, visual format - so you can track performance and share results with clients or stakeholders.
For most marketers, LinkedIn reporting means logging into LinkedIn's native analytics, exporting a spreadsheet, formatting it manually, and trying to turn raw numbers into something a client or manager will actually understand. That process repeats every single reporting cycle, for every single account.
The scale of this problem is growing. According to HubSpot’s 2026 report, 42% of marketers are now using LinkedIn as part of their marketing strategy - an 11% jump from 2024.
And LinkedIn's value as a B2B channel keeps climbing: Dreamdata’s 2026 Benchmark Report found that LinkedIn ROAS reached 121% in 2025, outperforming both Google Search (67%) and Meta (51%).
More budget going into LinkedIn means more pressure to report on it accurately - and more time lost if the process is still manual.
A well-built LinkedIn report template solves that. It gives marketing teams and agencies a consistent, repeatable way to:
✅ Track key LinkedIn metrics like follower growth, impressions, engagement rate, and page views in one place
✅ Break down post performance and content types to see what's resonating with your audience
✅ Visualize audience demographics - including industry, job function, and location - to confirm you're reaching the right people
✅ Share results with clients or leadership through live links, scheduled emails, or branded PDFs
✅ Compare date ranges and spot trends without manually pulling data every time
Once your LinkedIn report template is live:
- Clients can ask questions about the data inside the report and get plain-language answers instantly
- IQ writes performance summaries automatically, pulling from your actual report data
- IQ Themes brands the entire report to match your client in seconds - just upload a logo or image
You can also connect your LinkedIn data to your favorite AI tool like Claude and analyze the data in plain language with Whatagraph's MCP.
For agencies managing dozens of clients, these features make a real difference. After switching to Whatagraph, Peak Seven now saves 63 hours a month on reporting - time that goes back into strategy, client communication, and growth.
I immediately knew Whatagraph was going to save us a lot of time, and that we were going to have accurate reporting. It took us to the next level with our clients and within our team. - Kim Strickland, Digital Marketing Specialist at Peak Seven
What To Include in a LinkedIn Analytics Report Template?
Based on stunning LinkedIn reports we’ve seen created by marketers, here’s what your LinkedIn analytics report should include:
1. Performance Summary
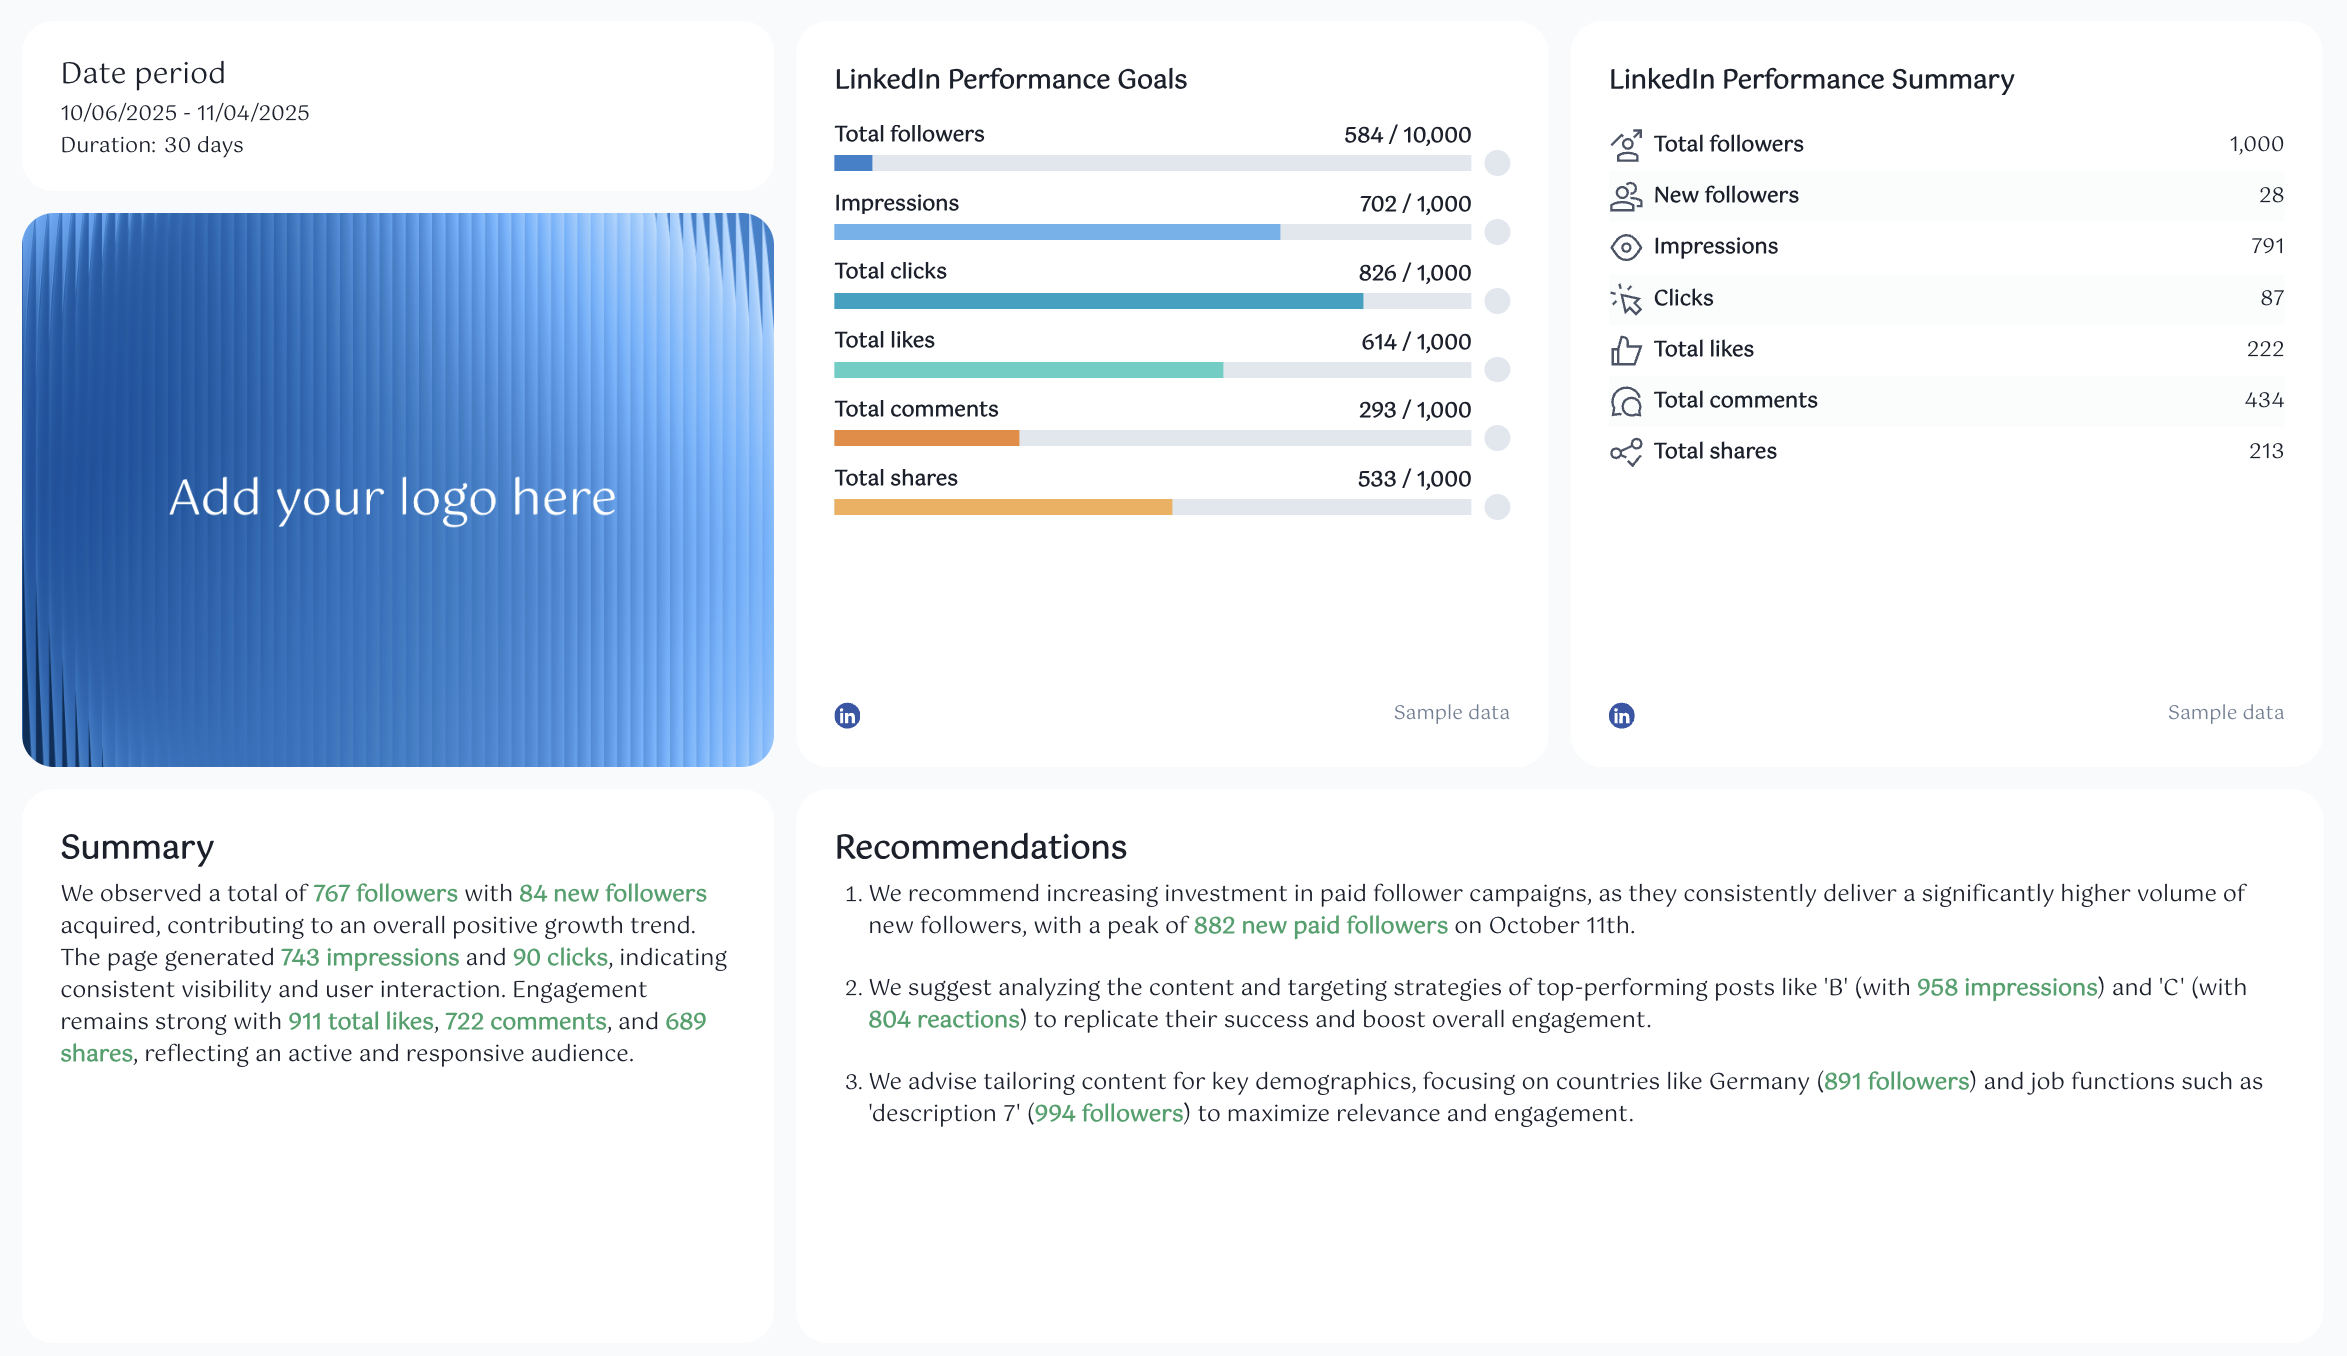 Start your LinkedIn report with a snapshot of overall results.
Include:
- Date period: define your reporting range (for example, “October 6 to November 4”).
- Performance summary: total followers, new followers, impressions, clicks, likes, comments, and shares.
- Goals widget: visualize progress toward follower, impression, and engagement targets.
- Summary and recommendations text widgets: powered by Whatagraph IQ.
This section is important because raw numbers without context rarely tell clients anything useful.
As Janet Mesh, CEO & Co-Founder of Aimtal, puts it: "One of the biggest mistakes that marketers make when creating reports is just adding screenshots of performance charts without any context or analysis."
That's exactly what Whatagraph IQ is built to fix. Instead of writing performance summaries manually, IQ automatically analyzes your LinkedIn data in the report and generates insights for you.
IQ content types include Summary, Wins, Issues, Recommendations, or Custom prompts, available in 18 languages. There are no hallucinations nor data breaches since the data stays in Whatagraph and is not transferred to an external tool like ChatGPT.
2. Followers Breakdown
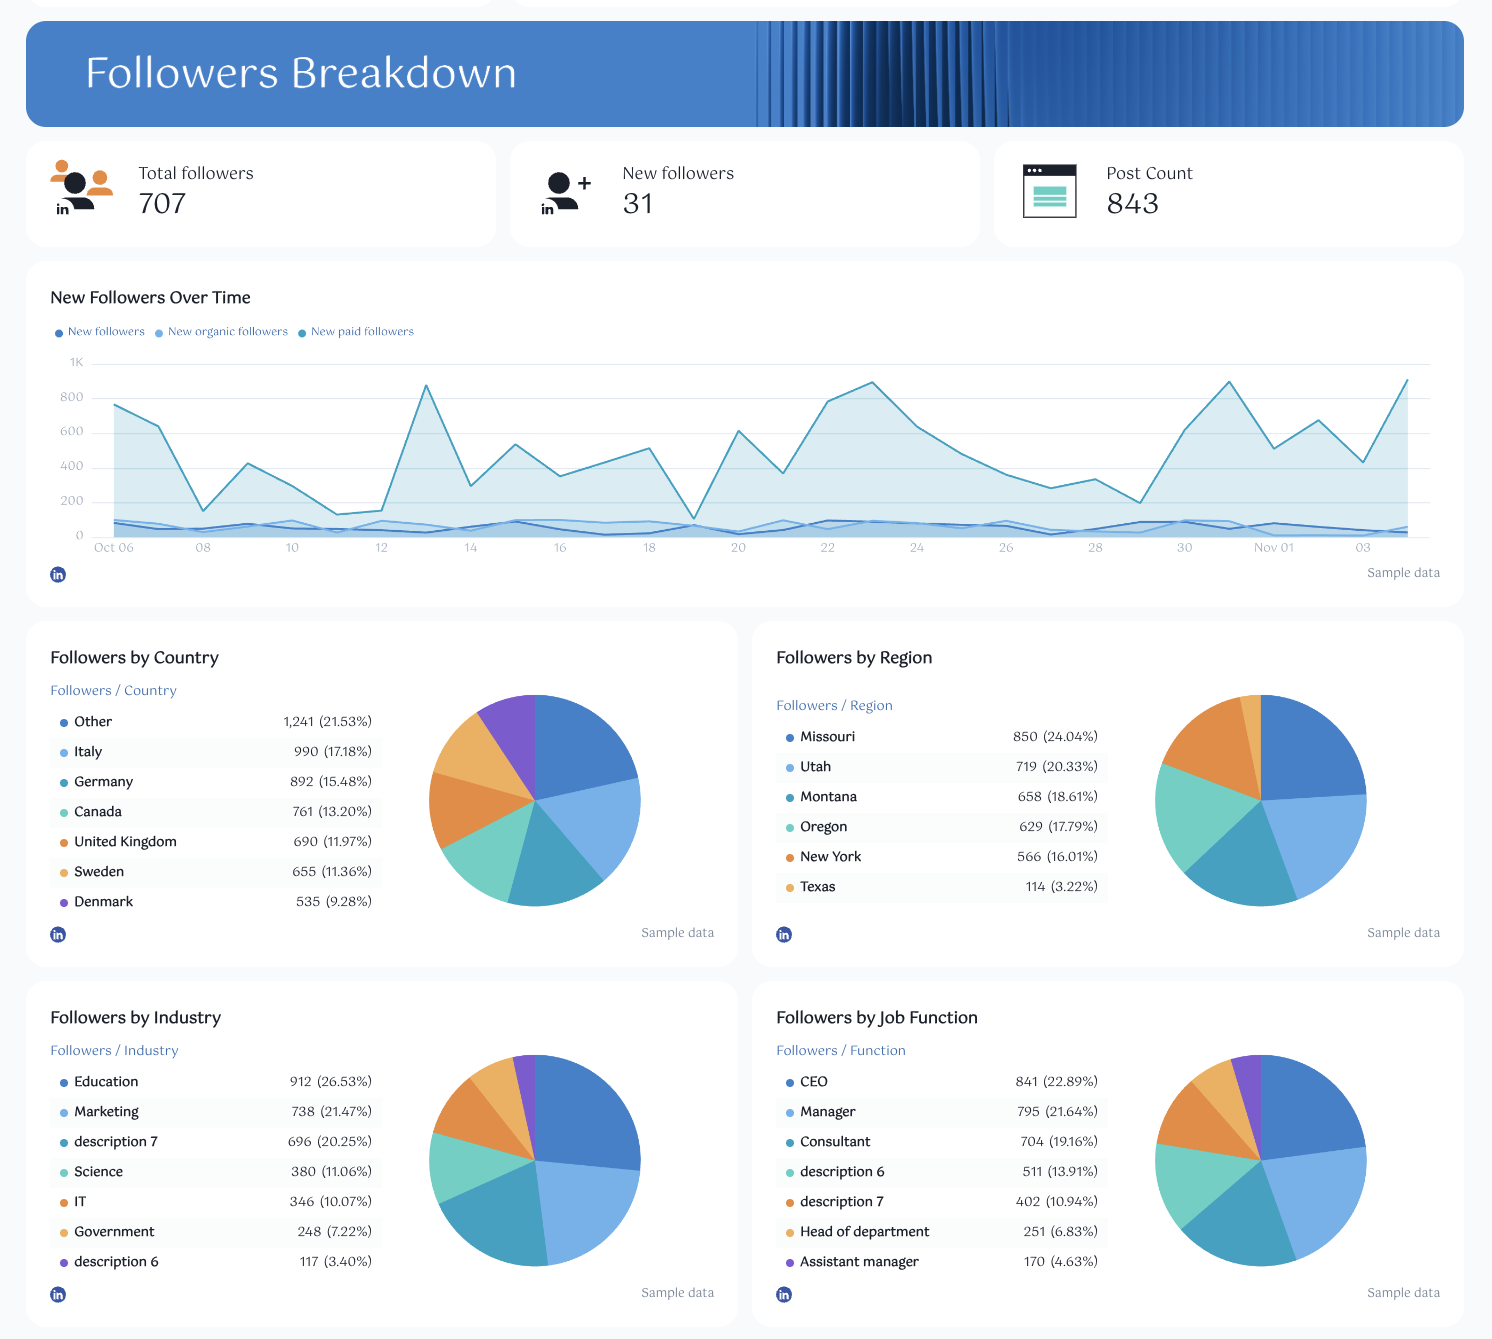
This section highlights audience growth trends and demographics.
Include:
- Total followers, new followers, and post count.
- New followers over time: a line chart showing audience growth.
- Pie charts breaking down followers by country, region, industry, and job function
This helps you understand where your followers come from, which industries engage most, and which job functions drive visibility. It’s essential for digital marketing teams that want to optimize their LinkedIn marketing strategy and focus on high-value segments.
3. Impressions & Clicks Breakdown
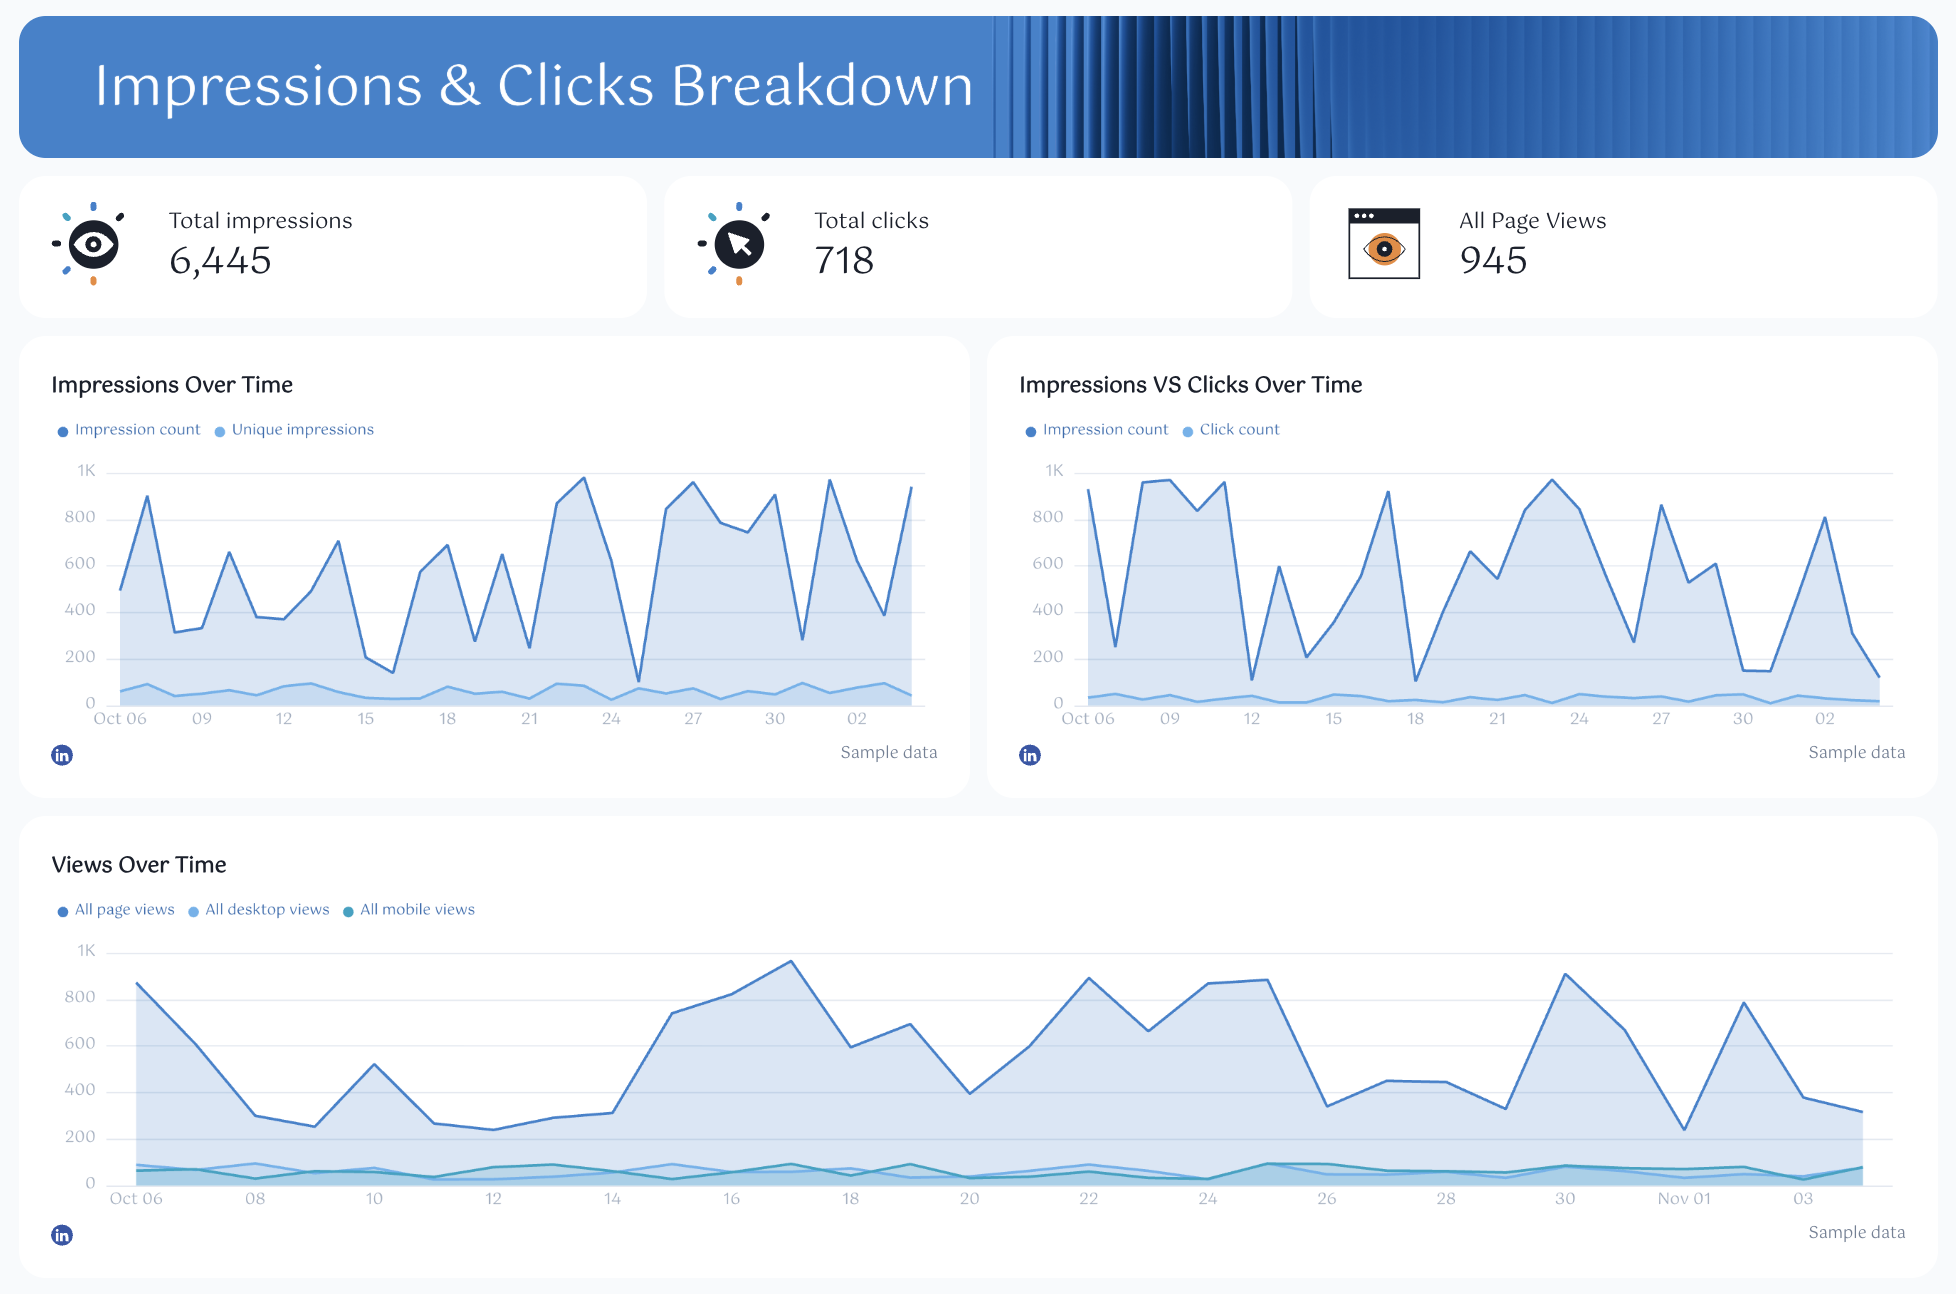
Next, analyze post performance and visibility across your LinkedIn page.
Include:
- Total impressions, total clicks, and all page views.
- Impressions, clicks, and views over time to monitor visibility trends.
- Impressions vs. clicks over time graph to calculate click-through rate and conversion rates.
- A Top Industry by Page Views table (you can also break this down by country, region, or job function) to identify your most engaged audience segments.
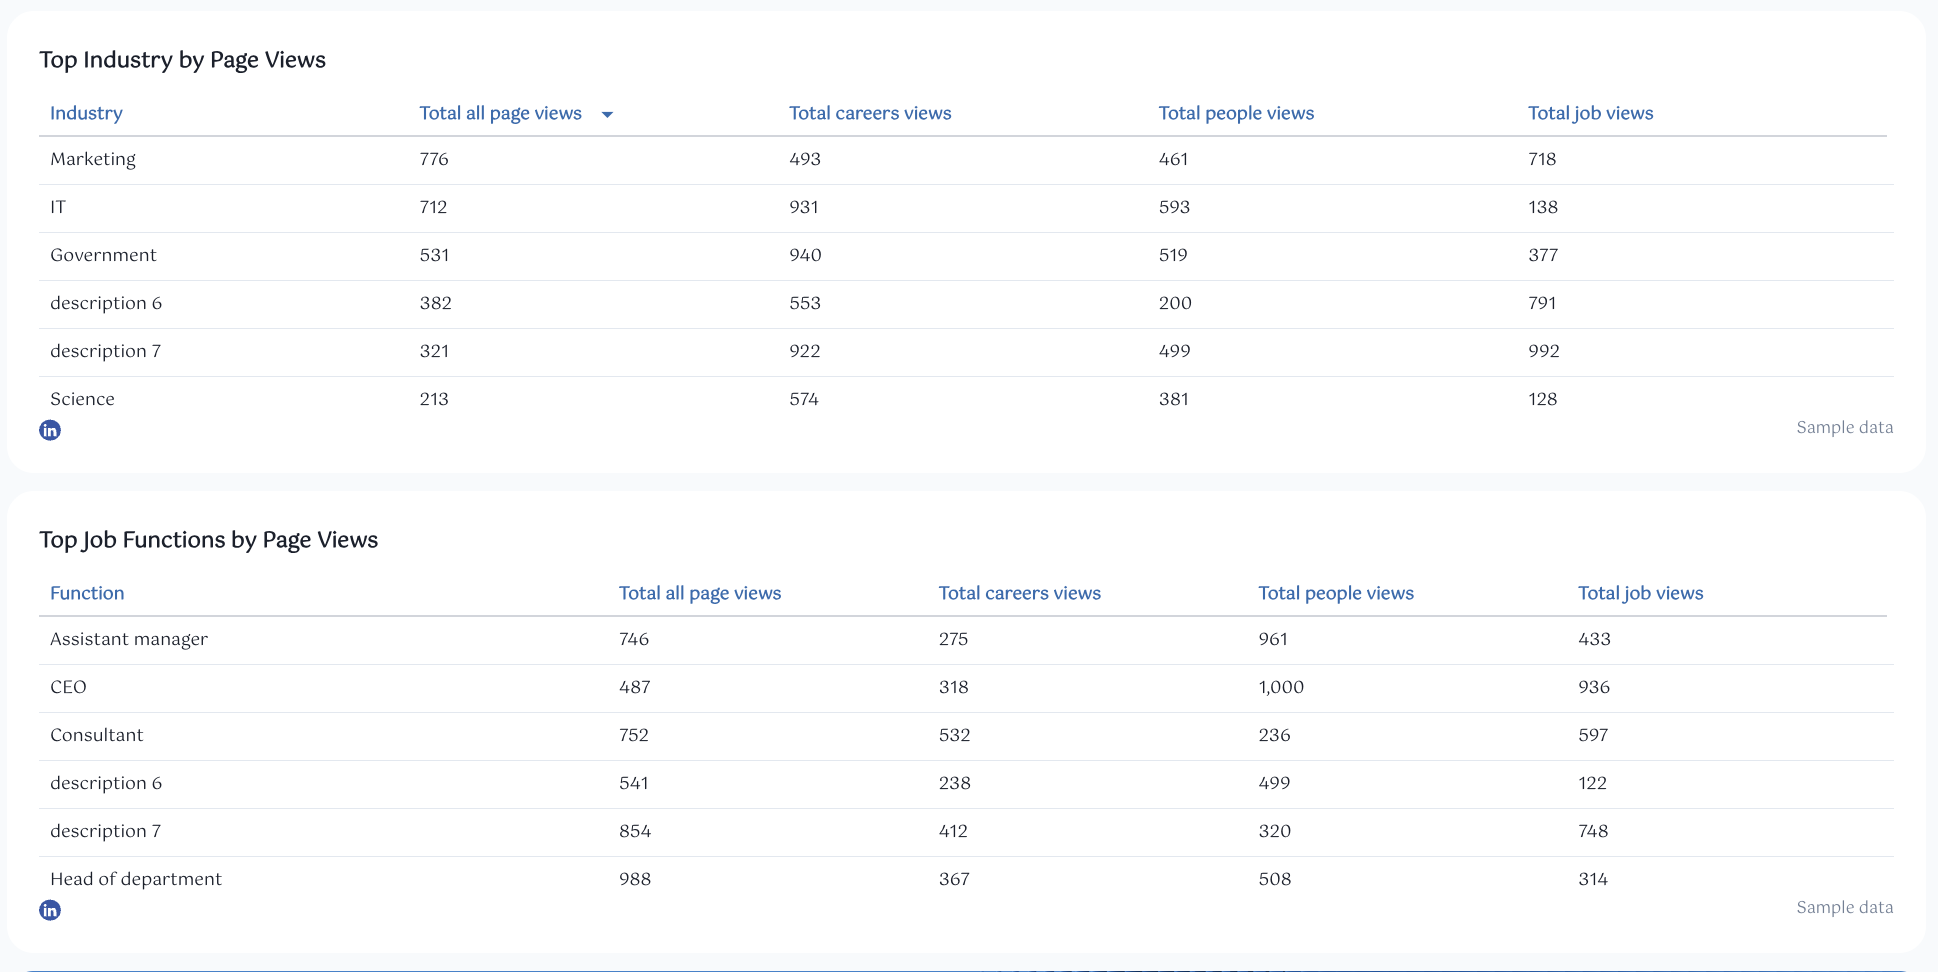
Each row can show key performance metrics such as impressions, clicks, followers, or reactions, helping you optimize your ad spend and target your lead generation efforts effectively.
4. Engagement Breakdown

This section measures how your audience interacts with your LinkedIn content.
Include:
- Total engagement and engagement rate.
- Likes, comments, and shares.
- Social engagement over time: track how engagement changes throughout the reporting period.
- Total reactions: breakdown by reaction type (Like, Empathy, Praise, Maybe, Interest, Appreciation).
- Reactions over time: visualize which posts or days drive the most reactions.
Add a carousel chart showing your top-performing LinkedIn posts, with key metrics like impressions, clicks, and reactions. This helps your marketing team quickly identify which content performs best.
Finish the section with a table of LinkedIn posts by date, displaying impressions, clicks, engagement, and engagement rate. This view makes it easy to evaluate content performance over time and find trends that can inform your next campaign.


