Twitter Dashboard Template
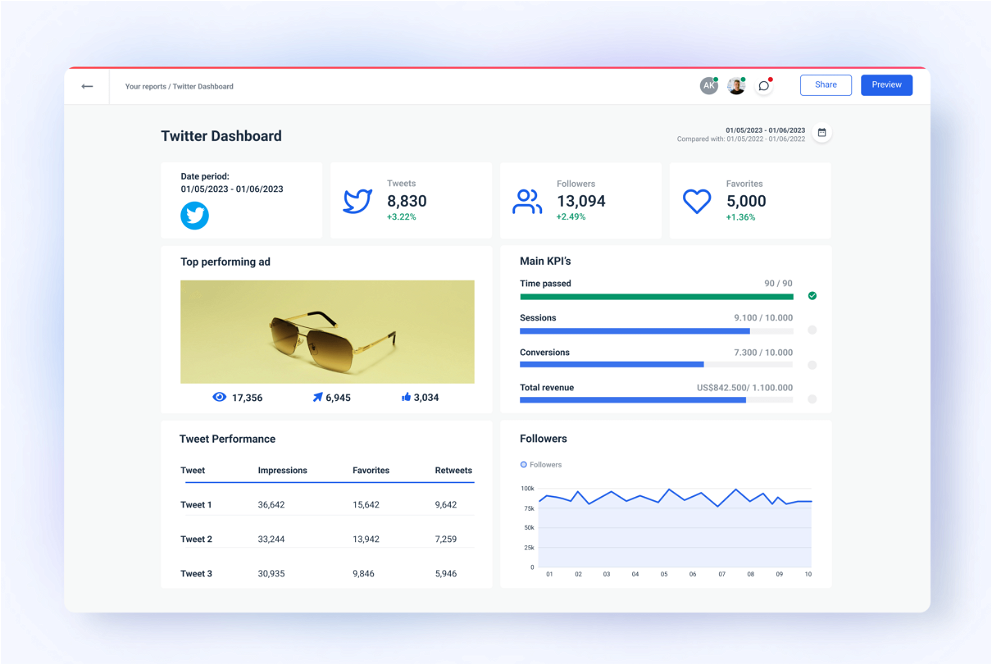
Grab this killer dashboard template and analyze your Twitter performance at a glance. See how your tweets are performing in real time along with all your Twitter KPIs and metrics.
What Is a Twitter Analytics Dashboard?
A Twitter analytics dashboard template is a reporting template in Whatagraph that you can use to create a Twitter dashboard in minutes. It includes all the key metrics you can find in a Twitter account so all you have to do is connect it and you can start reporting on your clients’ accounts.
Use a pre-built Twitter dashboard template
Stay up-to-date with vital performance metrics
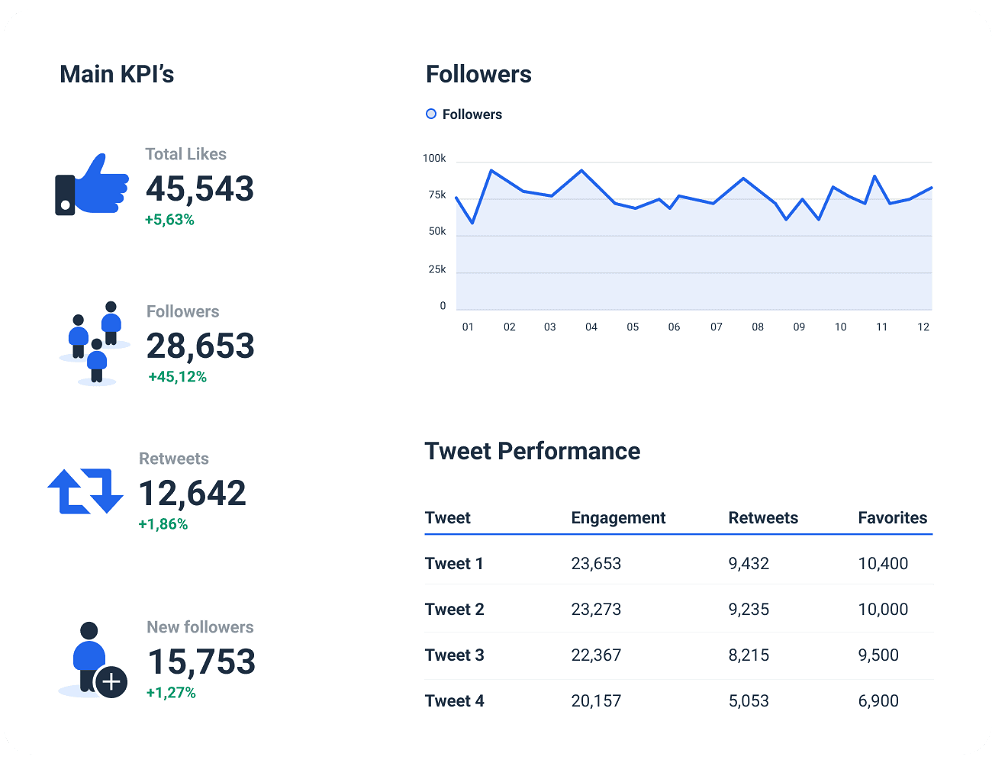
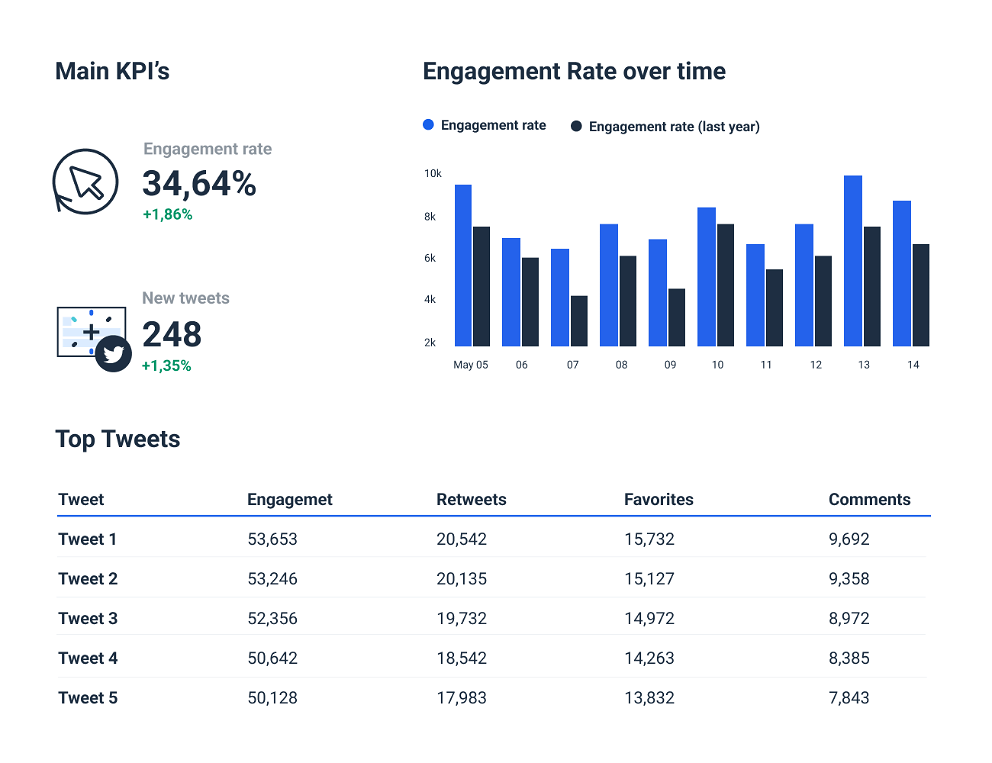
Find out everything about your Twitter account demographics and performance. Capture your key account data, such as top tweets, new followers, mentions, impressions, engagement rates and much more.
View individual tweet performance
High-level overview of your Twitter account performance or a laser focus on individual tweets - you can do both in a Whatagraph Twitter dashboard. No spreadsheets, just modern widgets with up to date Twitter data.
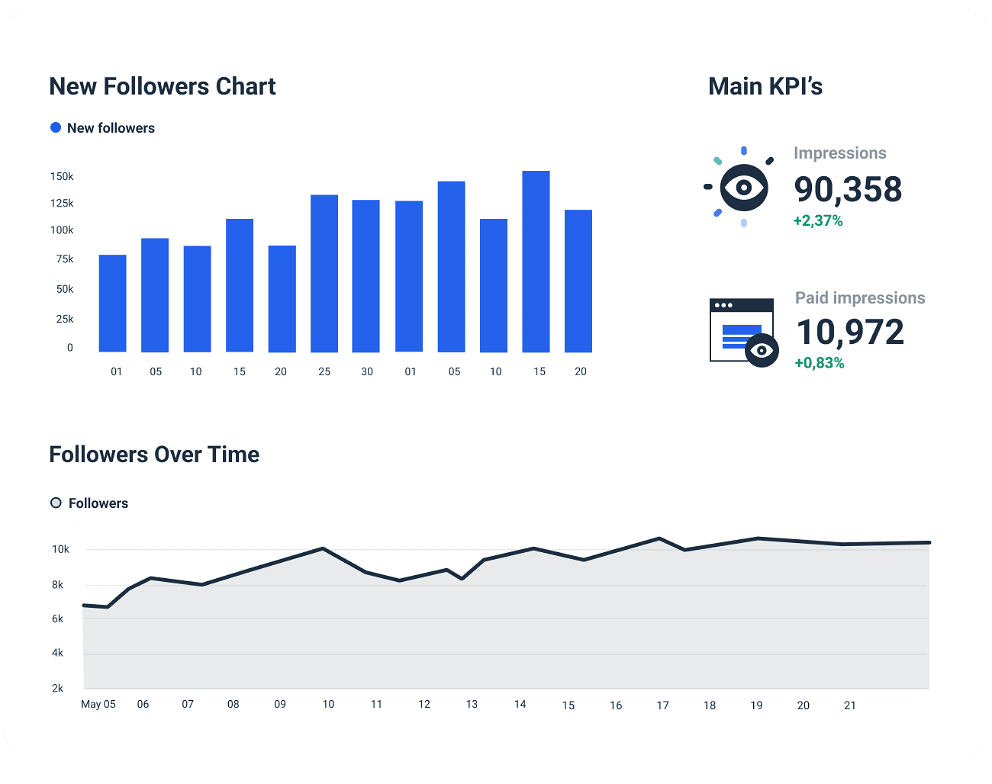
Track your follower growth
Find out how well you’re growing the follower base for your company or your clients. Get detailed Twitter metrics in your dashboard, in real-time.
Other Social Media Dashboard Examples
No credit card required


All reporting features your agency needs


FAQs
All your questions answered. And if you can’t find it here, chat to our friendly team.
What are the benefits of using a Twitter dashboard?
There are multiple benefits to using a dashboard for this social media channel. You can see all your metrics in a single spot for easy reporting. All your data is live and accurate and you don’t have to go into Twitter metrics to find your campaign performance. Also, it’s easy to upsell your clients with new services once you show them their engagement metrics in a Twitter dashboard.
What metrics to include in a twitter dashboard?
It depends on the client and the campaigns you’re running. Suggestions include top tweets, retweets, video views, link clicks, impressions, hashtag performance and others. If you need to include more than Twitter in your report, Whatagraph has 40+ data sources/integrations you can add to your next cross-channel report.
What is the purpose of a Twitter analytics dashboard?
The main purpose of a Twitter analytics dashboard is to show how your Twitter account is performing or how well you’re managing your client’s Twitter presence organically and through Twitter ads. You can use the Whatagraph dashboard to highlight not just Twitter, but also other platforms like LinkedIn, Facebook, TikTok and others.
It’s good to be loved! Our clients are not shy about expressing it.
I made a switch from GDS and Sheets for reporting to Whatagraph, and I am saving literal hours each week on performance report creation. Our small firm actually managed to onboard 2 new clients as a result of all the time we saved on managing data and reporting. The customer service is also really helpful and easy to reach.

Capterra verified review by
Mindaugas S., Marketing Consultant
Having active customer support to help fix any issues was a big contributor, but we also really liked the ability to save templates and connect sources to multiple charts/widgets at once without having to edit them individually. And having the grid layout is much easier to stay consistent with than the free form setup that Data Studio has.

Capterra verified review by
Nico T., Media Planner
The system has standard templates that are easy and fast to use. Also you can build your own report with lightning speed. It is very easy to use, has a lot of integration, and let get started very fast.

Capterra verified review by
Rasmus Bernt K., External Senior Management Consultant
We love Whatagraph - we would definitely recommend and our account manager is great! I love how easy this tool is to use, everyone on the team finds it much more user-friendly than other dashboards. Integration was easy, we sent some example reports to the team who duplicated these for us. We literally had to log in and send it to our clients!

Capterra verified review by
Stephanie S., Digital Director
We are showing our clients the work that we're doing for them and this is incredibly important for our clients ROI. They want to see results and having a tool like Whatagraph that can show data from virtually every source we use is hugely important.

Capterra verified review by
John S., SEO Strategist
The tool is easy to use; you do not need to have development resources. Even my junior project managers are capable of making campaign reports in minutes. There are a lot of pre-made templates you can use as well as many pre-made widgets.

Capterra verified review by
Erman E., Marketing Specialist
Really easy to connect data sources within the tool. The library of report templates has been helpful. The customer support team has been responsive to all of our needs. Our team enjoys the simplicity of setting up the reports and how the data is presented.

Capterra verified review by
Brent N., Director of Operations
Easy to create really beautiful graphs and reports which can help other team members to understand the most important takeaways. I especially like the automated report function, so I don't have to check on the same thing repeatedly.

Capterra verified review by
Orsolya S., Online Marketing Manager