TikTok Dashboard for Agencies
Effortlessly connect TikTok account data and build a stunning interactive dashboard within minutes using widgets as building blocks. Use a ready-made TikTok dashboard template or create a custom TikTok dashboard your clients can use to check live TikTok performance metrics whenever they wish.


Create actionable and engaging TikTok dashboards with Whatagraph
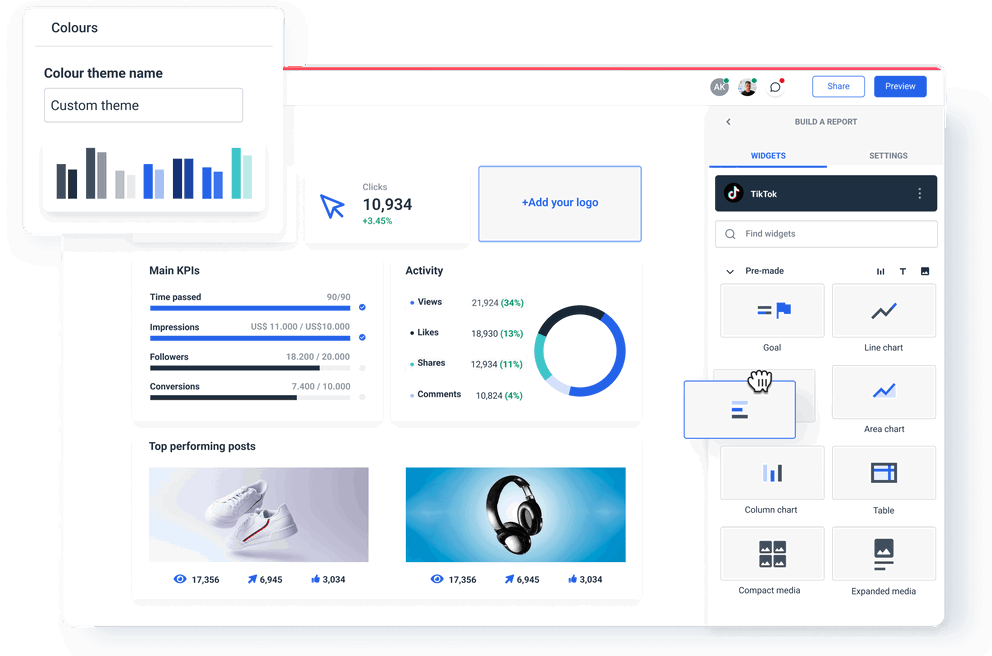
Spend less time building a TikTok dashboard
Drag and drop pre-made graphs, charts, tables, or single-value widgets to show the data you want the way you want. All the widgets stick to the grid for a quick and organized presentation. Save your custom widgets, calculations, and filters and reuse them in other dashboards. Change the layout, colors, and logos. Add media widgets for top-performing posts. Include personal comments and recommendations, and create a custom domain to bring the TikTok dashboard in line with your or your client’s branding. Save the whole dashboard as a template for multiple clients and edit them in bulk.
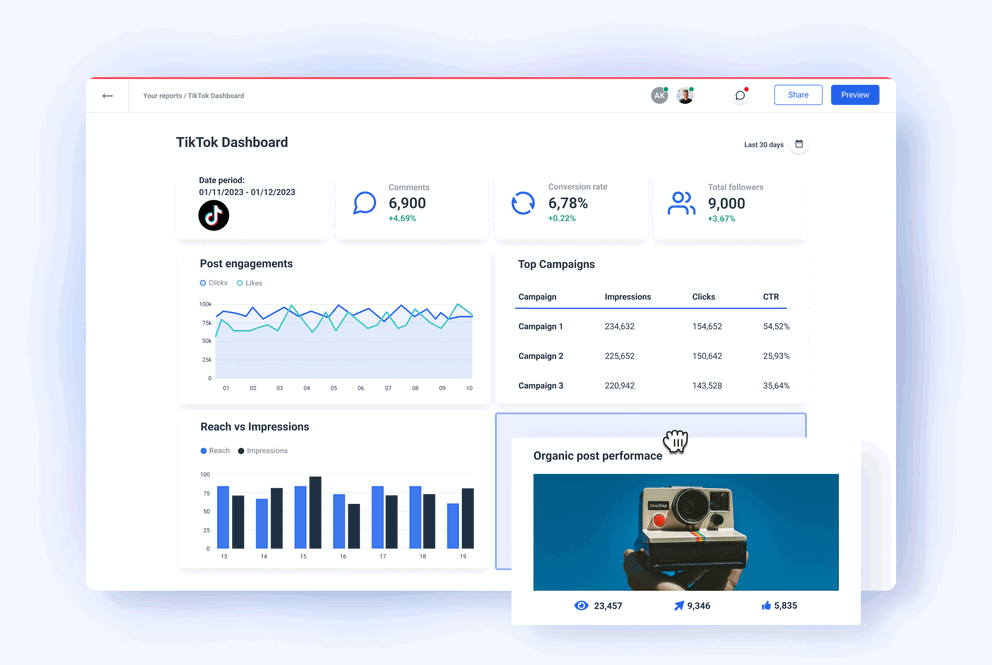
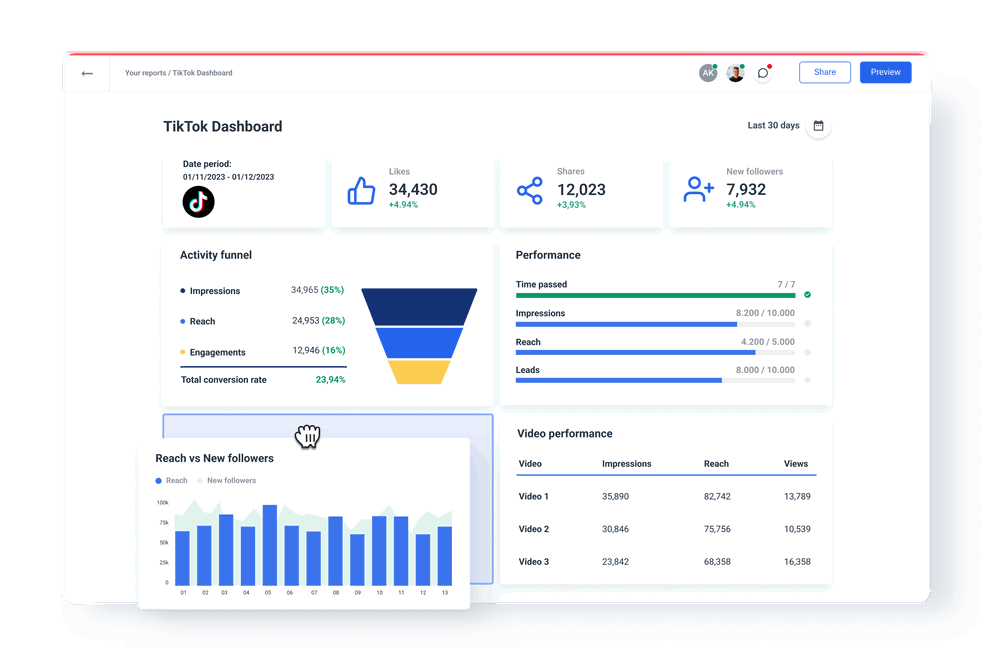
Track the essential TikTok campaign metrics and KPIs
Highlight your TikTok marketing results and measure the real-time performance of your video posts. Monitor likes, shares, new followers, and all other metrics that give you a 360-degree view of your clients’ TikTok campaigns. Build transparency and trust with your clients by giving them real-time insight into the TikTok campaigns you run for them.
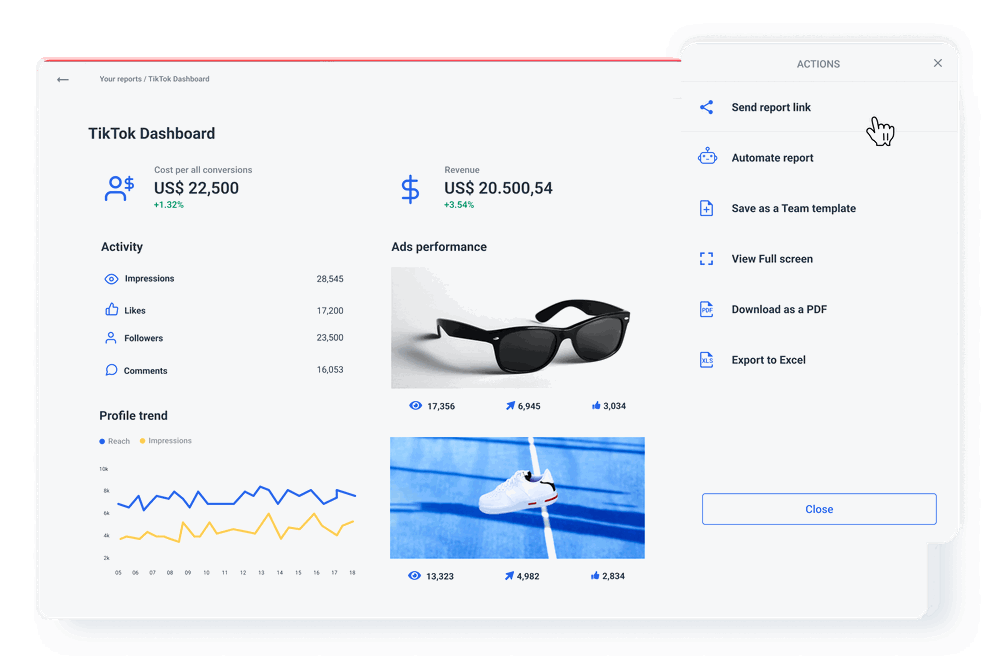
On-demand access via a live link
Share your TikTok dashboard with your clients via a live link for on-demand access. Instead of compiling and sending data every month, present your clients with an interactive dashboard that updates automatically. Let the viewers change the date ranges and explore data at their discretion, and if needed, protect the dashboard from unauthorized views with a password.
Supplement your TikTok dashboard with other useful dashboard templates
View All TemplatesNo credit card required


All reporting features your agency needs


Frequently Asked Questions
Can you create a combined TikTok organic and TikTok Ads dashboard in Whatagraph?
Yes, you can create one Whatagraph dashboard to monitor the performance of both organic TikTok and TikTok Ads campaigns. Just add both your TikTok organic and TikTok Ads account as a source and drag and drop widgets for the metrics you need. Whatagraph really makes it easy to bring data from multiple sources like social media to one place.
Do you need to use Excel or Power BI to visualize TikTok data in Whatagraph?
No, you don’t need to use Excel or Power BI to visualize TikTok data in Whatagraph. Whatagraph is an all-in-one marketing data platform you can use to connect TikTok data, visualize it in a dashboard, and share it with your client via a live link. No other tools or connectors needed.
On the other hand, if you have data in Google Sheets or BigQuery data warehouse, just add them as a source to your dashboard.
What metrics to follow for organic TikTok and which for TikTok Ads?
For TikTok organic, start with new likes, shares, comments, and video views. Also, make sure to add a profile data table where you can monitor the changes on a weekly basis.
For TikTok Ads reporting, you need a campaign performance table for CTR, CPC, CPM, total costs, and conversions. For a high-level view, Whatagraph has single-value widgets for the total cost and CTR.
For both organic and paid TikTok, you should include media widgets for the top-performing posts by selected metrics.
How to upsell your client for TikTok influencer marketing?
TikTok influencer marketing is a common addition to agency campaigns due to its high ROI and impact on other marketing efforts. To convince your client to expand into influencer marketing, you need to present the benefits:
1. When your content is distributed through the influencer’s platform, it comes across as a word of mouth from the influencer to their audience, which increases the click-through rate and purchase intent.
2. TikTok influencer marketing complements other marketing actions by bringing awareness to other parts of marketing campaigns, improving the success of video releases, or coordinating events with your client.
Apart from the TikTok app, what other marketing data sources can you include in a Whatagraph dashboard?
Whatagraph has native integrations with over 45 marketing data sources, including different website analytics, social media, PPC, SEO, email marketing, e-commerce, and CRM platforms. You can also connect data via a custom API or by previously exporting it to BigQuery or Google spreadsheets.
It’s good to be loved! Our clients are not shy about expressing it.
I made a switch from GDS and Sheets for reporting to Whatagraph, and I am saving literal hours each week on performance report creation. Our small firm actually managed to onboard 2 new clients as a result of all the time we saved on managing data and reporting. The customer service is also really helpful and easy to reach.

Capterra verified review by
Mindaugas S., Marketing Consultant
Having active customer support to help fix any issues was a big contributor, but we also really liked the ability to save templates and connect sources to multiple charts/widgets at once without having to edit them individually. And having the grid layout is much easier to stay consistent with than the free form setup that Data Studio has.

Capterra verified review by
Nico T., Media Planner
The system has standard templates that are easy and fast to use. Also you can build your own report with lightning speed. It is very easy to use, has a lot of integration, and let get started very fast.

Capterra verified review by
Rasmus Bernt K., External Senior Management Consultant
We love Whatagraph - we would definitely recommend and our account manager is great! I love how easy this tool is to use, everyone on the team finds it much more user-friendly than other dashboards. Integration was easy, we sent some example reports to the team who duplicated these for us. We literally had to log in and send it to our clients!

Capterra verified review by
Stephanie S., Digital Director
We are showing our clients the work that we're doing for them and this is incredibly important for our clients ROI. They want to see results and having a tool like Whatagraph that can show data from virtually every source we use is hugely important.

Capterra verified review by
John S., SEO Strategist
The tool is easy to use; you do not need to have development resources. Even my junior project managers are capable of making campaign reports in minutes. There are a lot of pre-made templates you can use as well as many pre-made widgets.

Capterra verified review by
Erman E., Marketing Specialist
Really easy to connect data sources within the tool. The library of report templates has been helpful. The customer support team has been responsive to all of our needs. Our team enjoys the simplicity of setting up the reports and how the data is presented.

Capterra verified review by
Brent N., Director of Operations
Easy to create really beautiful graphs and reports which can help other team members to understand the most important takeaways. I especially like the automated report function, so I don't have to check on the same thing repeatedly.

Capterra verified review by
Orsolya S., Online Marketing Manager