Twitter Ads Dashboard

Discover your best-performing ads and see which campaigns bring the most ROI with our Twitter Ads dashboard. One dashboard to display and share all your Twitter advertising data. Connect your or your client’s channels and get an overview of their ad performance, results, and live metrics. Track the number of engagements your Twitter Ads campaigns receive daily to ensure you are hitting your goals and improving over time. Monitor click activity, budget, and engagement through stunning visualizations.

Twitter Ads Dashboard for Marketers
You are in good company with 1,000+ marketing agencies and in-house teams worldwide
mc cann logo
Whatagraph image
Whatagraph image
Whatagraph image
Ogilvy logo
House dentsu logo
havas logo
n365 logo

A stunning Twitter advertising dashboard to easily track your client’s campaigns

Get accurate Twitter Ads campaign insights faster

Use our Twitter Ads dashboard template and evaluate each ad performance by impressions, retweets, video CTA clicks, and other metrics. Once you connect your Twitter Ads account, the dashboard populates with the latest data. No more switching between multiple tools or stitching Excel spreadsheets. Use the data to immediately determine if the promoted tweets are engaging your target demographics. Optimize advertising efforts based on real-time data. Quickly adapt the dashboard for another client’s needs. Link multiple dashboards to one Twitter advertising dashboard template and edit them in bulk.

SVG image
Get accurate Twitter Ads campaign insights faster

Monitor the performance of all your advertising platforms in one place

Try Whatagraph and analyze all paid campaign performance. Highlight your campaign results in a custom Twitter Ads analytics dashboard to quickly identify ad effectiveness. Combine Twitter Ads data with metrics from your social media, display, and programmatic ad channels for quick and easy cross-channel insights and a complete view of your digital marketing strategy. Unify names of ad groups or aggregate countries in tiers. Gauge real-time performance data to recognize key trends and Twitter user behavior patterns.

SVG image
Monitor the performance of all your advertising platforms in one place

Automate Twitter Ads insights with 24/7 live dashboards

Share a live link to a Twitter Ads dashboard that updates automatically instead of gathering and sending over data whenever your clients request it. The viewers can change the date ranges, explore the data, and, if needed, secure it with a password. Quick insights into Twitter advertising campaigns for faster decision-making.

SVG image
Automate Twitter Ads insights with 24/7 live dashboards

All dashboard features your agency needs

50+ data sources

Create a true cross-channel digital marketing dashboard in Whatagraph. Over 50 integrations for your cross-channel marketing campaigns.

Cross-channel insights

Include data from different sources into the same widgets or dashboards with a few clicks. Provide a full picture of your campaigns’ success.

Live dashboards

Securely share interactive access to your dashboard at any time from anywhere.

White-label dashboards

Customize colors and logos in each dashboard to align it with your agency’s or clients’ branding and style.

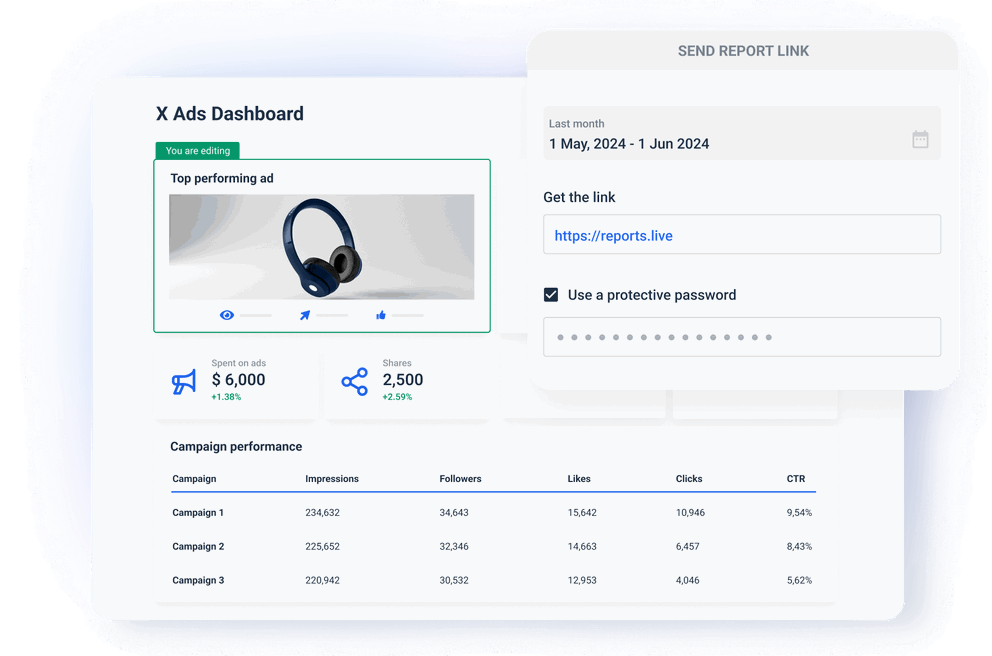
Why should you use a Twitter Ads dashboard?

Twitter Ads conversion tracking can be challenging because there are many key metrics to keep an eye on. A Twitter Ads analytics dashboard solves that issue by aggregating and visualizing your data, making it easier to digest and share with clients or stakeholders. The end-readers will understand the results easier if your marketing team provides engaging graphs and charts that clearly show the critical KPIs.

Twitter Ads dashboard in Whatagraph

In addition, there are many other advantages to using our Twitter Ads dashboard template. Here are the top reasons why you should include a data visualization dashboard into your workflow.

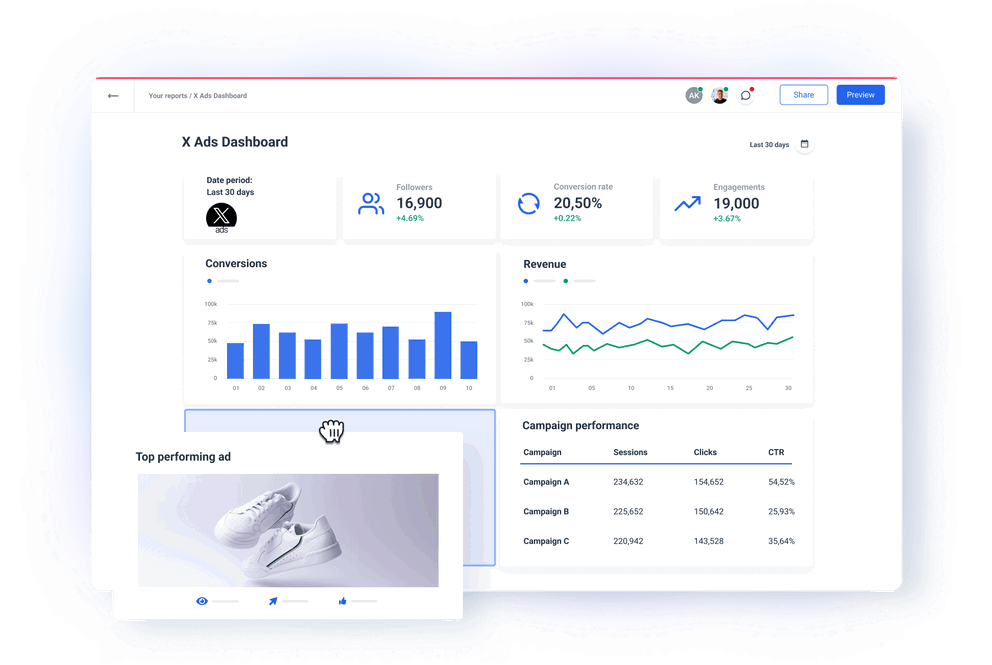
Real-time data access: A Twitter Ads dashboard provides real-time access to campaign data. Thanks to accurate results at any time, agencies can monitor performance metrics and make timely adjustments to your clients’ campaigns, which translates into ensuring optimal results.

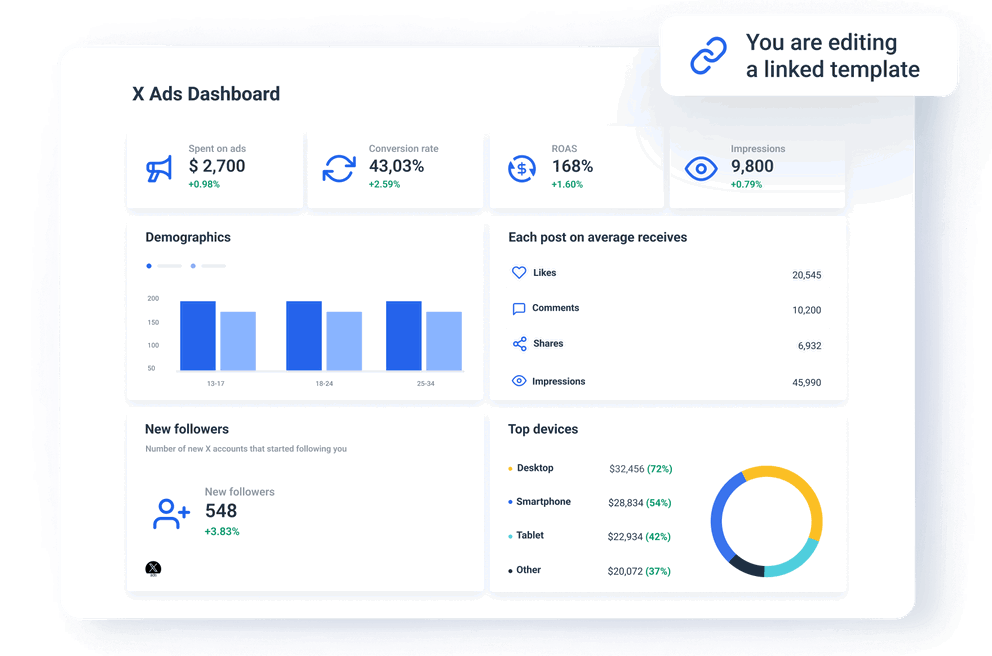
Comprehensive analytics: These dashboards offer a range of analytics, including impressions, engagement rates, click-through rates (CTR), CPM, and conversions. These metrics provide a holistic view of campaign performance, which allows agencies to measure the effectiveness of their strategies accurately.

Detailed audience insights: Twitter Ads dashboard provides detailed audience insights, such as demographics, interests, and geographic data. This information helps you understand your target audience better and tailor your messaging to more effectively target specific segments.

Customizable displays: You can create customized dashboards that highlight the most relevant metrics for your clients. This customization allows you to present data in a clear, to-the-point manner that aligns with the campaign objectives and KPIs.

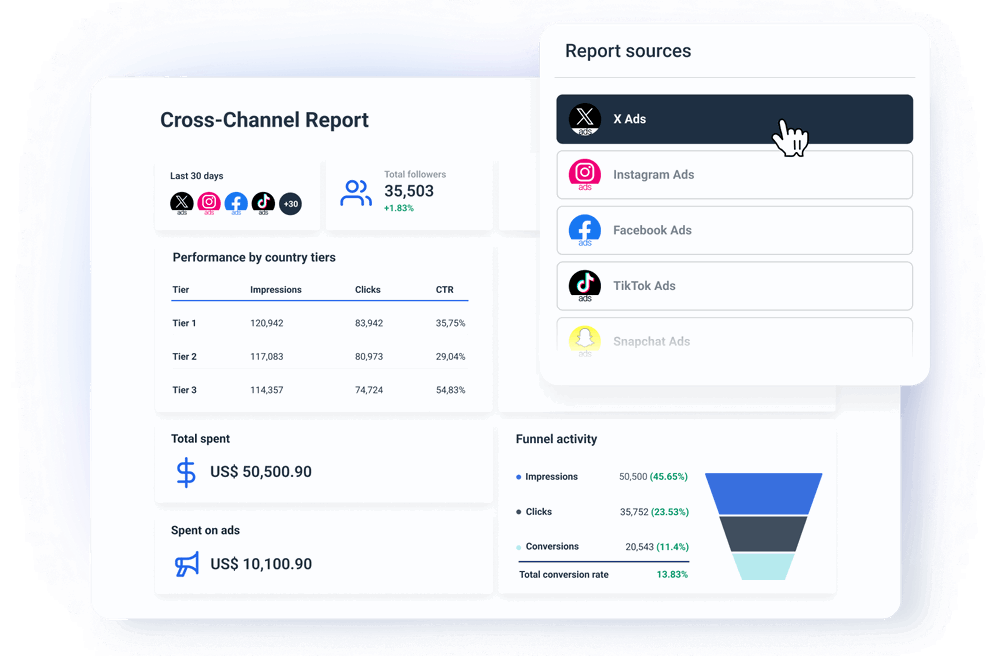
Integration with other platforms: The Twitter Ads dashboard can be expanded with marketing insights from other marketing platforms. In Whatagraph dashboards, you can easily combine Twitter Ads data with other marketing data sources, which gives you a more comprehensive view of the overall marketing situation.

Actionable insights on the go: The insights provided by the dashboard are actionable, allowing agencies to tweak and optimize campaigns on the fly. This capability ensures that campaigns remain effective and that resources are allocated efficiently.

Client transparency: By using the Twitter Ads dashboard, agencies can provide transparent data experience to clients. Clients can see exactly how their campaigns are performing, which builds trust and demonstrates the agency’s value in managing social media advertising efforts.

User-friendly interface: Our Twitter Ads dashboard is designed with user experience in mind, offering an intuitive and user-friendly interface. This ease of use ensures that anyone in your marketing team can quickly navigate and utilize the tool effectively without requiring extensive training.

In summary, the Twitter Ads dashboard provides marketing agencies with robust tools for real-time monitoring, detailed analytics, and actionable insights, all of which are essential for optimizing campaign performance and delivering value to clients.

Build a custom Twitter Ads dashboard in minutes

Pick from over 60 Twitter Ads metrics and create standalone Twitter Ads campaign dashboards or easily combine data from different integrations and build cross-channel dashboards in Whatagraph. 

It’s good to be loved! Our clients are not shy about expressing it.

I made a switch from GDS and Sheets for reporting to Whatagraph, and I am saving literal hours each week on performance report creation. Our small firm actually managed to onboard 2 new clients as a result of all the time we saved on managing data and reporting. The customer service is also really helpful and easy to reach.

Mindaugas S., Marketing Consultant Capterra logo for Whatagraph review

Capterra verified review by

Mindaugas S., Marketing Consultant

Having active customer support to help fix any issues was a big contributor, but we also really liked the ability to save templates and connect sources to multiple charts/widgets at once without having to edit them individually. And having the grid layout is much easier to stay consistent with than the free form setup that Data Studio has.

Nico T., Media Planner Capterra logo for Whatagraph review

Capterra verified review by

Nico T., Media Planner

The system has standard templates that are easy and fast to use. Also you can build your own report with lightning speed. It is very easy to use, has a lot of integration, and let get started very fast.

Rasmus Bernt K., External Senior Management Consultant Capterra logo for Whatagraph review

Capterra verified review by

Rasmus Bernt K., External Senior Management Consultant

We love Whatagraph - we would definitely recommend and our account manager is great! I love how easy this tool is to use, everyone on the team finds it much more user-friendly than other dashboards. Integration was easy, we sent some example reports to the team who duplicated these for us. We literally had to log in and send it to our clients!

Stephanie S., Digital Director Capterra logo for Whatagraph review

Capterra verified review by

Stephanie S., Digital Director

We are showing our clients the work that we're doing for them and this is incredibly important for our clients ROI. They want to see results and having a tool like Whatagraph that can show data from virtually every source we use is hugely important.

John S., SEO Strategist Capterra logo for Whatagraph review

Capterra verified review by

John S., SEO Strategist

The tool is easy to use; you do not need to have development resources. Even my junior project managers are capable of making campaign reports in minutes. There are a lot of pre-made templates you can use as well as many pre-made widgets.

Erman E., Marketing Specialist Capterra logo for Whatagraph review

Capterra verified review by

Erman E., Marketing Specialist

Really easy to connect data sources within the tool. The library of report templates has been helpful. The customer support team has been responsive to all of our needs. Our team enjoys the simplicity of setting up the reports and how the data is presented.

Brent N., Director of Operations Capterra logo for Whatagraph review

Capterra verified review by

Brent N., Director of Operations

Easy to create really beautiful graphs and reports which can help other team members to understand the most important takeaways. I especially like the automated report function, so I don't have to check on the same thing repeatedly.

Orsolya S., Online Marketing Manager Capterra logo for Whatagraph review

Capterra verified review by

Orsolya S., Online Marketing Manager

FAQs

All your questions answered. And if you can’t find it here, chat to our friendly team.

What is the Twitter ad campaign dashboard?

A Twitter ad campaign dashboard is a dynamic display tool that allows marketers to monitor and share the results of their Twitter ad campaigns. It provides key metrics and insights on ad performance, engagement, and overall campaign success, allowing advertisers to optimize their campaigns for their target audience.

How do I monitor Twitter ads?

You can monitor Twitter Ads using the in-app X Ads dashboard. It’s a fast way to get a lot of information about your Twitter Ads performance. However, this way of tracking ad performance leaves many questions unanswered.


The native X advertising dashboard is good for freelancers and startups with a handful of campaigns but has no cross-channel visibility, so you need at least two in-app analytics tools to get a full picture of your marketing performance.


And since platforms often map data differently, you may even use spreadsheets to aggregate all ad performance metrics.


Another problem with native Twitter (X Ads) dashboards is that they don’t allow for effective marketing attribution. Without proper attribution, you can’t understand which campaign on which platform results in most conversions and revenue and which ones need more optimization.


Twitter offers its native tracking pixels, but it requires additional coding to set it up and is often biased towards Twitter, so it might attribute more conversions to Twitter Ads than influences.


That’s why it’s better to use Whatagraph, a marketing dashboard platform that seamlessly integrates web analytics and advertising platforms to track journeys and build user profiles. With a few clicks, you can add more data sources to our X advertising dashboard template and get a complete view of your ad campaigns.

What are the top metrics to use in an X Ads dashboard?

The top metrics to use in an X Ads dashboard depend on the specific goals of the campaign, but some commonly used metrics include impressions, engagement rate, click-through rate (CTR), cost per click (CPC), cost per engagement (CPE), and conversions. Other metrics, such as follower growth, audience insights, and ad placement, can also provide valuable insights into the success of a campaign.

What Is the average ROI on Twitter Ads?

The average ROI for Twitter Ads is around 122%, meaning that for every $1 spent on Twitter Ads, businesses can expect to generate $1.22 in revenue. However, keep in mind that individual results may vary, and a well-planned and executed Twitter Ads campaign has chances to achieve even a higher ROI.

What Is a good CPM for Twitter Ads?

The average CPM for Twitter Ads is around $6.46, but a good CPM ultimately depends on the specific campaign goals and budget. A good CPM is usually considered to be lower than the industry average. Still, it's important to consider the overall campaign performance and ROI rather than just the CPM.

What other marketing channels can I connect with Whatagraph?

Apart from X Ads, you can connect all popular PPCs like LinkedIn Ads and Google Ads, programmatic advertising tools like AdRoll and Trade Desk, social media such as LinkedIn, Instagram, and TikTok, e-commerce platforms like Shopify and WooCommerce, SEO tools like Ahrefs, Semrush, and Google My Business, email marketing tools like Klaviyo and Mailchimp, web analytics platforms like Google Analytics 4 and Matomo, and CRMs like HubSpot and Salesforce.


If you can’t find the integration for your marketing data source, connect it via a Custom API or export it to Google Sheets docs or BigQuery data warehouse and add it as a source.

Need more help with getting started?

An image of the Whatagraph dashboard, with a custom reporting template

We can set up your report campaign for you!

If you need help with setting up Whatagraph - our team can create your campaign reports!

Ready for insights?

It's time to focus your time on the tasks that really matter, and let us worry about your marketing analytics. Start your free 7-day trial.

  • Free for 7 days
  • No credit card required
  • Live chat support
  • Cancel anytime
Start Reporting For Free

No credit card required

Cross channel reporting template with Whatagraph