


What is cross-channel marketing data?
Cross-channel marketing data is the performance data from every channel you run (ads, analytics, social, email, CRM and ecommerce) brought into one view, so you can compare channels and add them up. It's the first step before you create a cross-channel marketing report.
Consolidating the data in one place is just the beginning. The harder part is standardizing it so numbers mean the same thing everywhere, whether that’s in your external report, internal dashboard, or AI tools.
Each ad platform names and counts things its own way. Google Ads records conversions within a conversion window that defaults to 30 days and can be set anywhere from 1 to 90. Other platforms use different windows and different names for the same action. For example, Google Ads calls ad spend “Cost”, while Meta Ads calls it “Amount spent”. Campaign names also vary depending on which platform you’re on.
Modeling cross-channel marketing data means building one marketing data model on top of your sources: one definition per metric and one set of dimensions that works across every channel and every client. You build it from four parts:
| Building block | What it does | Example |
|---|---|---|
| Custom metric | A calculated number built from other metrics | Gross spend = spend / 0.8, or blended ROAS = total revenue / total spend |
| Custom dimension | A grouping or label built from existing fields | Region, product and objective split out of campaign names |
| Blend | Joins a few different sources on shared dimensions | Facebook and Instagram reach in one view, joined on date |
| Source group | Adds up many similar sources into one | Every Google Ads account a client has, as one source |
Analytics tools have their own versions of these. GA4, for example, offers custom dimensions and metrics with a cap of 50 event-scoped custom dimensions, 50 custom metrics and 5 calculated metrics on a standard property. Those only cover GA4 data, though. A cross-channel model has to work across every source at once.
How do agents help with cross-channel marketing data modeling?
AI agents build the model for you from a plain-language description. Whatagraph comes with three pre-made agents for this work:
- KPI builds custom metrics and custom dimensions. It checks whether an equivalent already exists before it creates anything, so you don't end up with four versions of ROAS.
- Omni builds blends across channels. It joins sources on a shared date dimension and builds rate metrics like CTR on top of the blend, never inside it.
- Rollup builds source groups. It waits for the data to load and checks the group in a widget before handing it back.
Agents hand work to each other as they go, so a report-building agent can ask KPI for a field it needs. Every change is attributed to the agent that made it, and you decide which actions need your approval first.
Modeling cross-channel marketing data: manual vs. with AI agents
With agents, you describe the definition once and the agent builds, checks and reuses it. If you’re doing it manually, you’ll need to rebuild the same fields for every source, client, and report.
| Manual | With AI agents | |
|---|---|---|
| Time per build | Hours to days, repeated per client | Minutes. Four dimensions from campaign names took two minutes; a three-source CRM schema took about 30 minutes |
| Where the formula lives | Inside each report or source | Once in the data layer, reused by every report |
| Consistency across clients | Drifts as different people rebuild it | The same definition is copied to each new client |
| Splitting campaign names | Regex or spreadsheet work | You describe the pattern; the agent writes the rules |
| Duplicate metrics | Several slightly different versions pile up | KPI checks for an existing equivalent first |
| Who checks | Whoever built it, if anyone | The agent checks in a widget; you approve the plan and the result |
The manual route eats whole days. A marketer at a US agency said: "I literally spent all day yesterday working on blended sources and source groups. That's all I did all day."
Building by hand still makes sense in two cases: a one-off metric for a single report, and a definition your team hasn't agreed on yet. Agree on the definition first. An agent will build whatever you describe, including the wrong thing.
Case studies: how teams use AI agents to model cross-channel marketing data
GKV
GKV is a communications agency based in the US. Anna Alexiadi Smyrniotaki, Director of Analytics at GKV, uses agents to create custom metrics, custom dimensions and source groups.
Before agents, every source group meant the same rebuild. Duplicating a group didn't copy its custom metrics, so she created CTR and a handful of other metrics by hand, group after group. Now she asks an agent to create the source group and its metrics in the same request.
Anna Alexiadi Smyrniotaki said:
"There's... same... four or five metrics that I have to create again and again, but... I no longer do that manually. Using the agents to create custom metrics and dimensions has been... amazing."
A consumer electronics brand
A consumer electronics brand was switching CRM platforms. Before switching off the old one, its marketing analytics manager had to unify three sets of customer data: a data dump from the old CRM, a spreadsheet of historical CRM data and the live CRM source that was about to be switched off.
The fields overlapped, but the same metric often had a different name in each file, and the spreadsheets had to match the live source's schema so the history would survive.
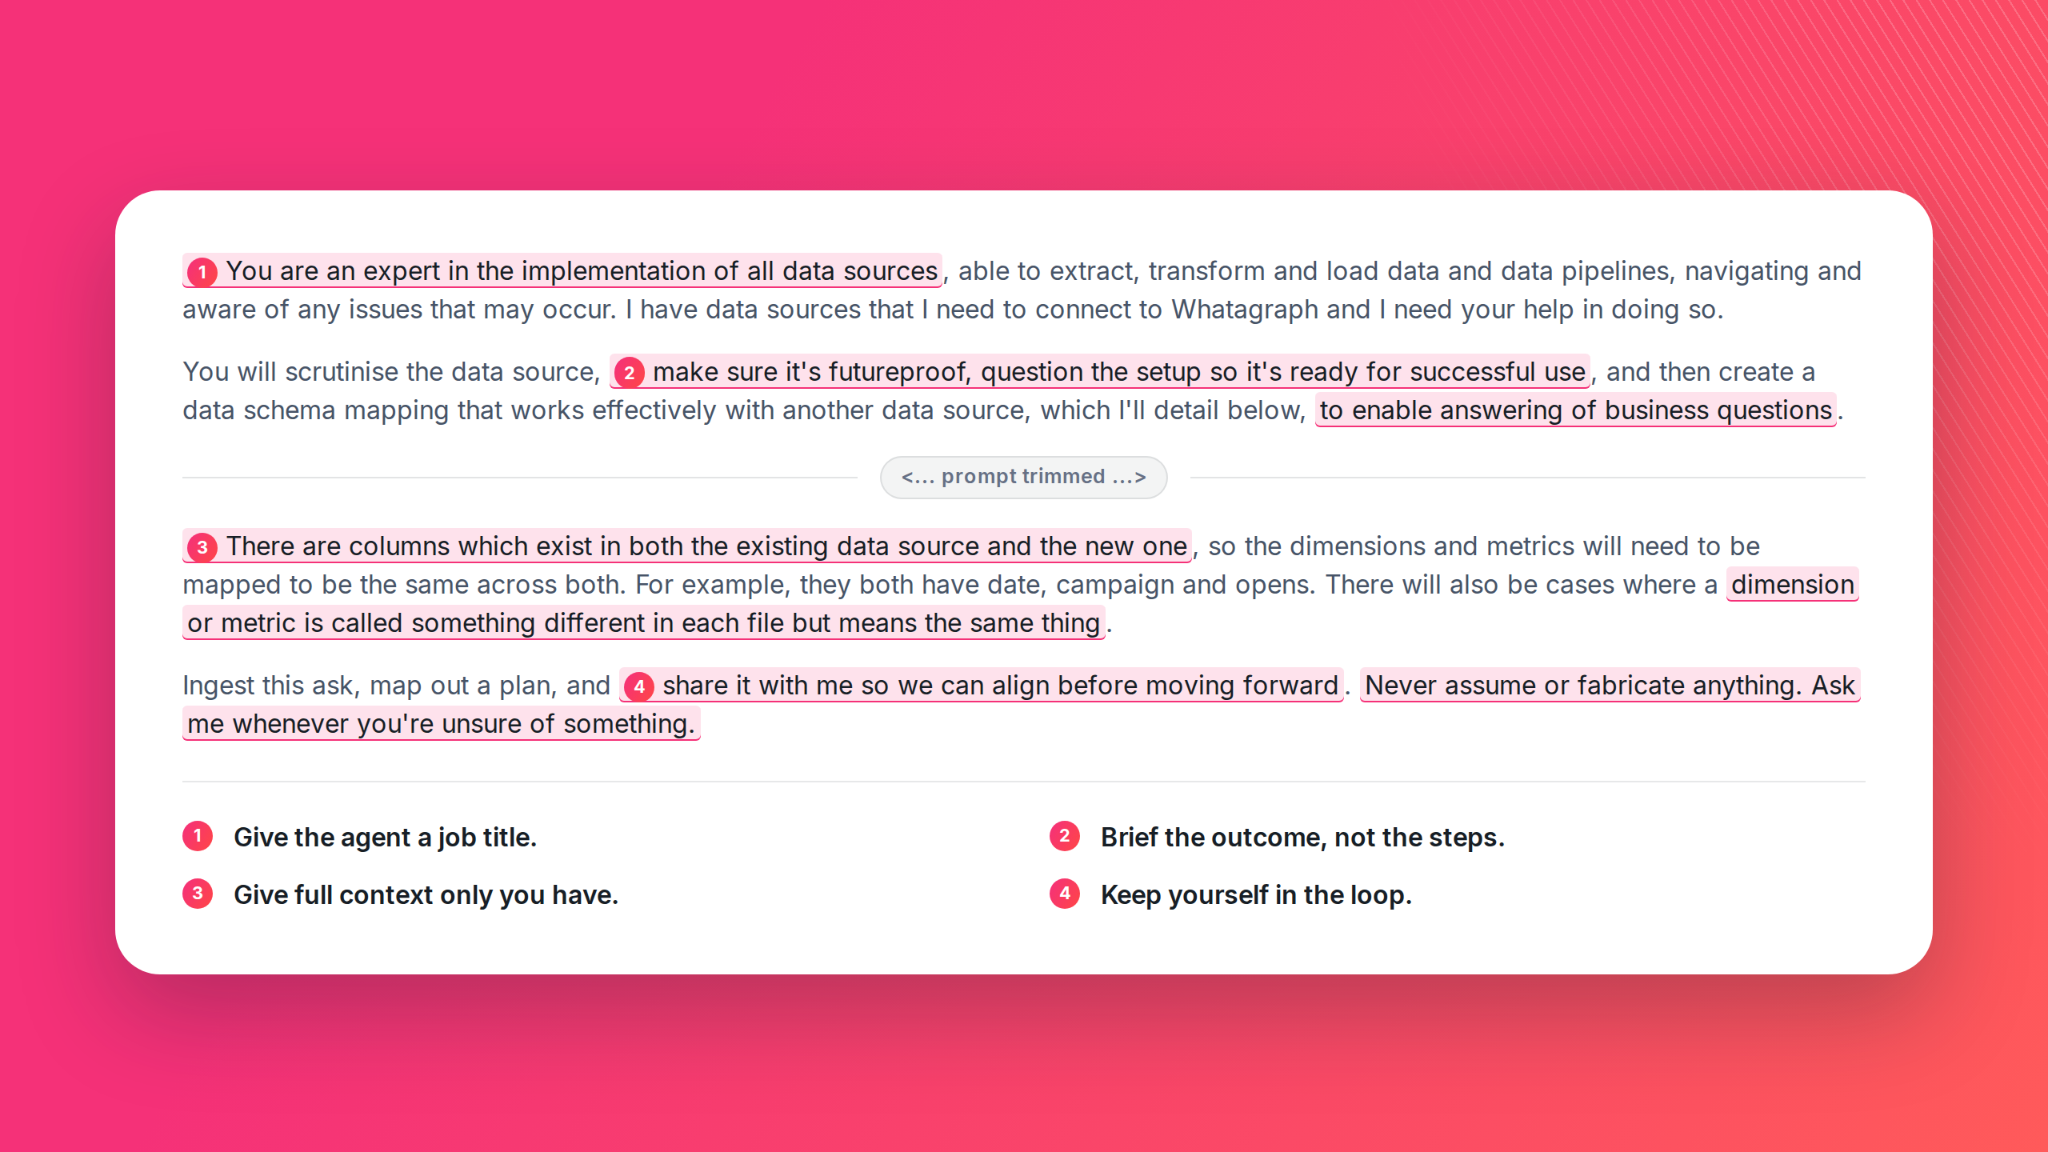
He used agents to clean the data and map schemas instead. He gave the agents a job title, the outcome he wanted and the context only he had, and asked for a plan before any work. Here’s the prompt he used:
The agents came back with an implementation plan.
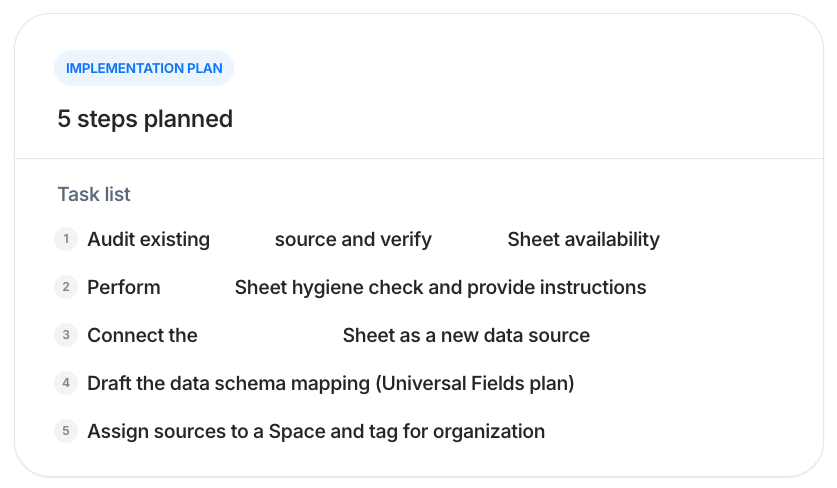
He added his own mapping definitions and two extra metrics, then approved it. About 30 seconds later, the agents returned an audit of all three schemas and a mapping plan built around the existing production schema.
He also wanted the CRM data reported next to paid media, so a metric like clicks would fill in for both in the same table. The agents mapped the CRM metrics onto the same universal fields the paid channels already use.
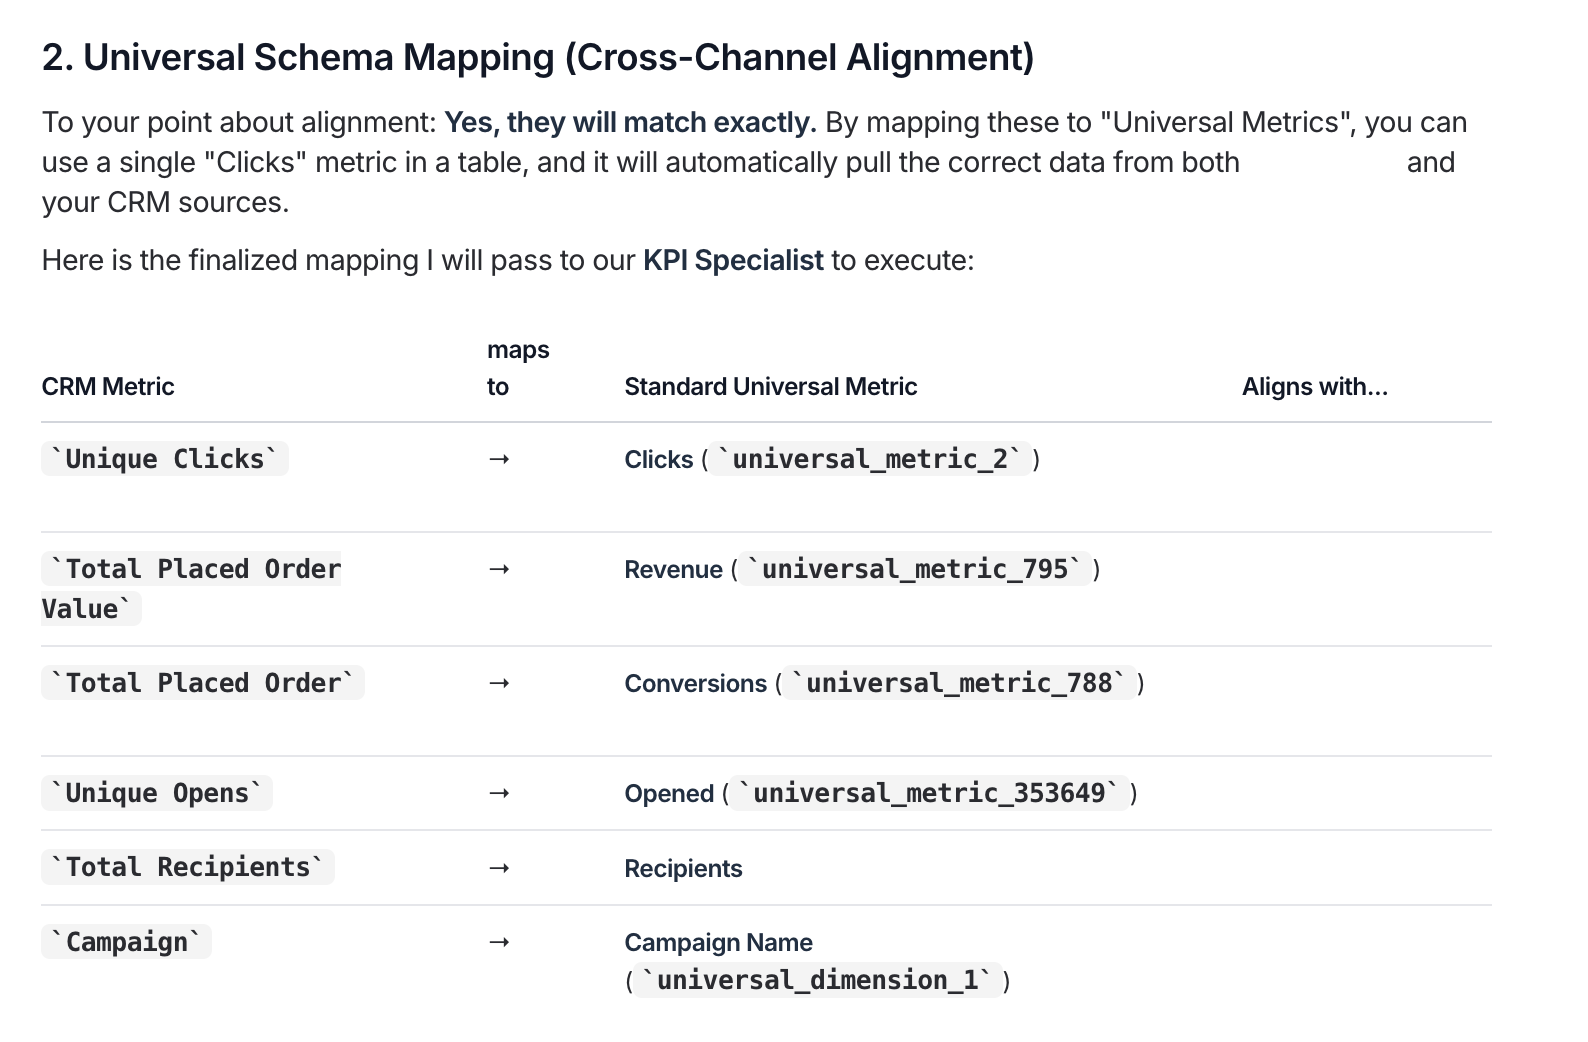
Then three pre-made agents at Whatagraph split the work amongst themselves without being instructed to do so.
- Roster, the agent that connects and checks data sources, planned the mapping and ran the audits.
- KPI built five unified fields.
- Rollup grouped the sources into one total CRM source group.
The entire job only took about 30 minutes. The brand's marketing analytics manager said:
“IQ Agents saved me a ton of time and work. I now have all the data speaking the same language, and all I had to do was prompt.”
The team now has one set of definitions across CRM and paid media, and the next source they connect maps onto it.
A performance agency
A performance agency needed to group a client's Shopify products into product types for its dashboards. The product names didn't follow a pattern, so simple "contains" rules wouldn't sort them.
The agency's reporting analyst asked an agent to write the categorization prompt, then had it build the custom dimension. It sorted every product into about 10 categories, and it could tell phone cases apart from screen protectors without being told.
The agency's reporting analyst said: "for Shopify, we have a lot of product line items that we need to group into different product types. So it's not really uniform... I think this is 10 categories. And it actually created this one for me."
An agency with multilingual client reports
An agency that runs client reports in several languages needed readable GA4 events. Event IDs meant nothing to the client, so the agency had an agent build a custom dimension that maps each event ID to a plain label. A marketer at the agency said: "I never manually setup of the custom dimensions because the agents are too good."
A UK social media agency
A UK social media agency wanted total social reach across Facebook and Instagram, organic and paid, in one view. An agent built the cross-channel blend and worked out the agency's own "effectiveness rate" (interactions divided by reach).
The agency's social lead said: "I made it work out the engagement rate, which was like individual interactions... divided by reach, which we actually call effectiveness rate... Normally I’d have to do that manually."
How to analyze cross-channel marketing data with AI agents
You analyze cross-channel marketing data in two passes: model it first, then ask questions of the model. Here's how that works with agents in Whatagraph.
- Connect your sources. The Roster agent connects, tags and sets the currency on each source. Everything lands in the Data Hub, the data layer your reports and agents read from.
- Write down your definitions. List each formula, the markup per client, the pattern your campaign names follow and which conversions count. This becomes the agent's brief.
- Ask KPI for custom metrics and dimensions. Describe the field in plain words, like "split campaign names into region, development, objective and format." An agent built those four dimensions from a housebuilder's campaign names in two minutes.
- Ask Omni to blend channels, or Rollup to group accounts. Use a blend to put a few different channels side by side. Use a source group to add up many accounts of the same kind.
- Approve the plan, then check the values. The agent shows what it'll create before it builds. Afterwards, compare a widget's totals with the platform for last month.
- Ask questions of the modeled data. The Insight agent answers questions like "what was CPA by channel last month?" from the same definitions your reports use.
- Reuse the setup for the next client. The Intake agent copies your blends and custom fields to each new client, so the model doesn't get rebuilt from scratch.
Here's a brief you can copy and adapt:
You're our data modeling specialist for [client name].
Goal: one set of cross-channel metrics and dimensions for [client name] that every report can use.
Sources: [Google Ads account], [Meta Ads account], [GA4 property], [CRM source or sheet].
Definitions:
- Gross spend = spend / [0.8]
- Conversions = [conversion action names] only
- Campaign names follow [pattern, e.g. Region_Product_Objective_Format].
Split them into dimensions for [region], [product], [objective] and [format].
Rules:
- Before you create a metric or dimension, check whether one with the same meaning exists. If it does, reuse it.
- Build rate metrics (CTR, CPA, ROAS) on top of the blend or source group, from summed values. Never inside the blend.
- Join channels on date.
- Don't change or delete existing metrics, dimensions, blends or source groups that reports use. If one needs to change, ask me first.
- If a value doesn't map cleanly, list it instead of guessing.
- If a source returns no data, flag it.
Before you build anything, show me the plan: what you'll create, what you'll reuse and the formula for each metric.
When you're done, check each new field in a widget for last month and compare the totals with the platform. Write a short summary of what you built and what I should review. Don't add the fields to client reports or share anything with the client.
How to create a cross-channel marketing data dashboard with agents
Once the data is modeled, you can ask an agent for a cross-channel dashboard in plain language. In Whatagraph, that's Recap, the pre-made agent that builds reports and dashboards from a short prompt. It builds on top of your metrics, dimensions and blends.
- Describe the dashboard. Name the client, the channels, the metrics and the filters you want.
- Let the agent fill gaps. If the dashboard needs a metric that doesn't exist yet, the agent creates it from your definitions or asks another agent to.
- Use your custom dimensions as filters. Region, product type or campaign objective become dropdowns on the dashboard.
- Apply the client's branding. Add the logo, colors and fonts.
- Share it. Send a live link with a password, or schedule it by email.
An example prompt:
Build a one-page cross-channel overview for [client name] covering [Google Ads], [Meta Ads] and [GA4] for [last 30 days].
Show total spend, gross spend, blended ROAS and CPA by channel, plus a trend line for conversions.
Add filters for [region] and [objective].
Use only existing metrics and dimensions, and tell me if one is missing.
After an agent split the housebuilder's campaign names into four dimensions, it built a five-tab report that used the new dimensions as filters, so the team could look at one region at a time.
Best tools for cross-channel marketing data collection and analysis
The right tool depends on whether you need to run campaigns across channels or report on them. A few options:
- Whatagraph: cross-channel reporting and marketing intelligence. One governed data foundation holds your custom metrics, dimensions, blends and source groups, and AI agents build and maintain them.
- HubSpot Marketing Hub: running and tracking campaigns across email, social, ads and your website, with CRM data built in.
- Salesforce Marketing Cloud: cross-channel marketing for large enterprises.
- SE Ranking: SEO and search visibility data.
See our full comparison of cross-channel marketing platforms.
What your team still owns
Agents build the model. Your team owns what goes into it and what goes out.
- The definitions. Which conversions count, the markup per client, what engagement means for each client. An agent can't decide these.
- The check. Compare new fields against the platform before they reach a client report.
- Approval on shared fields. Changing a metric that 40 reports use changes 40 reports. Keep those changes on approval.
- Naming conventions going forward. Dimension rules only work while campaigns follow the pattern.
A marketing lead at a global company's in-house team said: "I modified just there with IQ, and then I checked it manually myself..."
This is the same discipline as marketing data governance: agree the definitions, write them down and check that the numbers match.
Before a new field goes live, check that:
- the formula matches what you agreed with the client
- last month's totals match the platform
- no older version of the same metric is still in use
- every value in a new dimension has a category, with nothing left blank
Challenges in cross-channel marketing data management
Most cross-channel data problems come from definitions that don't line up. Here are the common ones and how to fix each.
Rates that average averages. Put CTR or conversion rate inside a blend and you get an average of each channel's rate, not the true rate. A PPC team lead at a German agency said: "I don't have a working summary row for relative KPIs like click rate or conversion rate." Fix: calculate rates on top of the blend from summed clicks, impressions and conversions. Omni does this by default.
Near-duplicate metrics. Every rebuild adds another version of CPM or ROAS, and nobody knows which one is right. Fix: one definition per metric, clearly named. KPI checks for an existing equivalent before it creates one.
Metrics that don't carry over when you copy. Custom metrics live on the source, so duplicating a blend or source group leaves them behind. An account team at a Dutch agency said: "when you duplicate the blend, the metrics are not there because metrics is created on the source." Anna Alexiadi Smyrniotaki at GKV said: "if I duplicate a source group, it doesn't duplicate its custom [metrics] with it." Fix: ask an agent to duplicate the blend or group together with its metrics.
Messy or changing campaign names. The information is there, but inside a string. Fix: describe the naming pattern and let an agent turn it into dimension rules. Review any values it can't map.
Different conversion windows. Platforms count conversions over different periods, so totals don't line up. Fix: agree which conversion actions count per client and build one conversions metric from those.
Blend joins. Blends match rows on fields that have to hold the same values in every source, and the join type decides which rows survive. Looker Studio, for example, supports five join types, from inner to cross joins. A marketer at a property marketing company said: "it was, like, select to join, but, like, there was also select to join here. And then the whole outside, inside, something, something." Fix: join on date and let Omni handle the join rules. Our guide to blending data in Looker Studio shows how this works by hand.
Data that's still loading. A new source group takes time to fill. Fix: wait for the data to load, then check. Rollup waits and validates the group in a widget before handing it back.
Platform changes. When a platform renames or retires a metric, every report that uses it needs a fix. The owner of a French agency said: "Facebook or Instagram decides to change... you have to change in all the reports... really... exhausting." Fix: point reports at one custom metric, so a platform change means one edit to the definition.