Cross-Channel Marketing Report: A Step-by-Step Guide
The easiest (and fastest) way to create a cross-channel marketing report is to use a dedicated marketing reporting tool to automate the whole process. In this article, you’ll learn how to choose the right data and reporting tool and use it to structure your reports to be the most useful for clients.

Feb 13 2025●8 min read


You can log into multiple platforms and download each report as a spreadsheet, but this is not practical at all.
Plus, there’s a huge margin for error.
You can combine exported data in spreadsheets or write custom formulas to get cross-channel insights….
… and even if you somehow manage the data, you’ll have to repeat the process for every cross-channel marketing report you create.
But at the end:
- Will your clients get the big picture?
- Will they understand the value of your work?
- How can you save time building the reports?
We asked 7 agency experts:
Camden Olivero, Owner and Growth Strategist @ Niche and Needle Marketing,
Aaron White, CEO @ Outbound,
Stef Oosterik, Quality Manager @ Dtch. Digitals,
Firdaus Sateem, Founder @ VoidSEO,
Chris Coussons, Founder @ Visionary Marketing,
Peter Murphy Lewis, CEO @ Strategic Pete,
Drew Cove, Senior SEO Manager @ DigitalParc
… these questions and compiled their insights in this article.
Plus, we'll also share two resources: a free Google Sheets template for cross-channel marketing reporting and Whatagraph's cross-channel report template.
Let's get started.
Cross-Channel Marketing Report: How to Prove ROI?
Chatting to marketing agency leaders, we’ve heard many times that clients don’t pay much attention to the reports they get.
After all, they only care about results, right?
That's true, but clients who don’t read reports often fail to see the value of your cross-channel marketing strategy month after month.
And the first step is to keep them engaged with your reports.
How do you do that?
Start by choosing things you put in reports in the first place.
1. Choose the KPIs that Matter
So, what do clients want to see in your cross-channel marketing dashboard?
For Camden Olivero, CEO of Niche and Needle, clients want to see the ROI and whether they have the right cross-channel mix to optimize their marketing budget:
They will not want to spend money on underperforming platforms, so my reports will highlight where money is being well spent and where it needs reallocation.
The KPIs that Olivero tracks depend on the client’s business type but always trace back to the sales funnel:
The key metrics tracked include Customer Acquisition Cost (CAC), Lifetime Value (LTV), Cost Per Click (CPC), Cost Per Acquisition (CPA), and Conversion Rates across all platforms. However, CPA is my priority because keeping acquisition costs low while maximizing top-of-funnel volume is key to sustainable growth.
Firdaus Sateem, founder of VoidSEO, likes to combine paid and organic:
I usually pair SEO and Google Ads together. Both impact Google search visibility, so reporting on them side-by-side gives a clearer view of overall Search Engine Marketing (SEM) effectiveness.
This approach helps clients identify trends, explains Firdaus.
Chris Coussons, Founder of Visionary Marketing, chooses KPIs depending on the client’s goals.
But still, he focuses on business impact, not vanity metrics:
Instead of just showing impressions or clicks, it is important to prioritise lead quality, conversion rates, and ROI. If a client cares about brand awareness, it makes sense to look at reach, engagement, and sentiment.
If they’re focused on sales, then revenue, ROAS, and customer acquisition costs should take centre stage, explains Coussons and adds:
A report is only useful if it answers the question: is this marketing actually working?’’
2. Tell the Story of Cross-Channel Marketing Data
Once you’ve decided which KPIs to use in your report, you should structure your report in a way that tells a story.
Start with a high-level performance overview and expand into more specific KPIs with comparison charts, audience distribution, paid overview, socials, etc.
Aaron White, CEO of Outbound, says that at the end of the day, clients care about two things: what’s working and what’s not:
When it comes to cross-channel reporting, clarity is everything. We always start with a easy to read summary so clients can quickly see how their marketing is performing, then we dive into the details by channel.
For Coussons, the key to structuring cross-channel reports is simplicity with depth.
Cross-channel reporting is one of those things that can either be very useful or the total opposite, filled with numbers that many don't understand.
He adds that it’s important to break reports into three core sections:
An overview (the big picture), channel performance (the specifics), and key insights (what’s working and what needs adjusting).
White prefers to highlight key takeaways rather than dump a ton of raw data:
We found it's a better user experience as the user doesn't have to skim through blocks of content to find key info. A good reporting tool should make this easy by blending data seamlessly, offering AI-driven insights, and allowing customization so clients get the info they need without the fluff.
Blending data helps you get insights from cross-channel reporting faster.
A good reporting tool can blend similar metrics from different channels like Google Analytics, social media platforms, paid media, etc.
This way, you can always see the big picture, for example, the click-through rates across all channels.
To Coussons, data blending is a key part of multichannel reporting:
If we’re running multi-touch campaigns, we’ll also blend data to show how different channels contribute to conversions rather than looking at them in silos.
Another way to support your story of data is to use AI to create actionable insights.
We’ve heard from many agency leaders that clients often go straight for the insights section, skimming through the rest of the report.
However, digging out valuable insights for the specific context takes a lot of time.
Whatagraph’s AI chatbot can answer any questions about all your connected data or campaigns in natural language—just like talking to your personal data expert.
For example, “What was the total ad spend from Google Ads and LinkedIn Ads in January last year”?
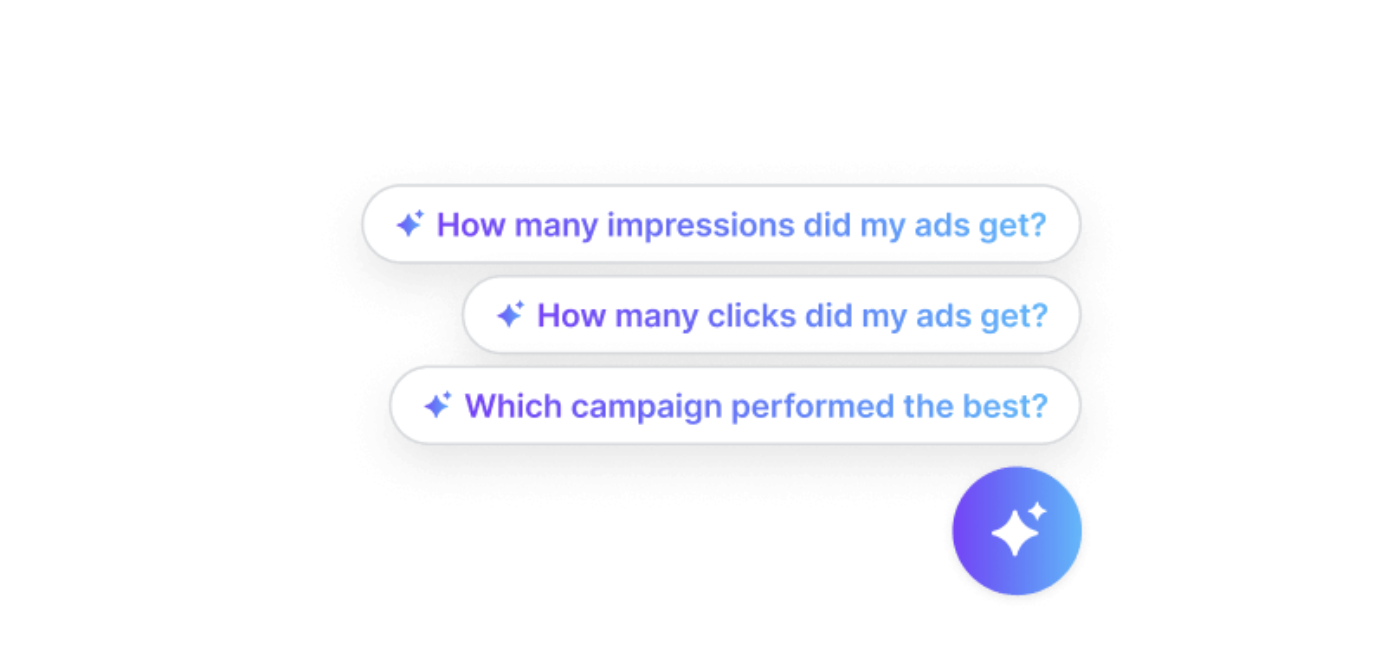
It works for report summaries as well.
Instead of writing summaries yourself, you can generate AI report summaries and add them to your multi-channel marketing dashboard using our Text widget.
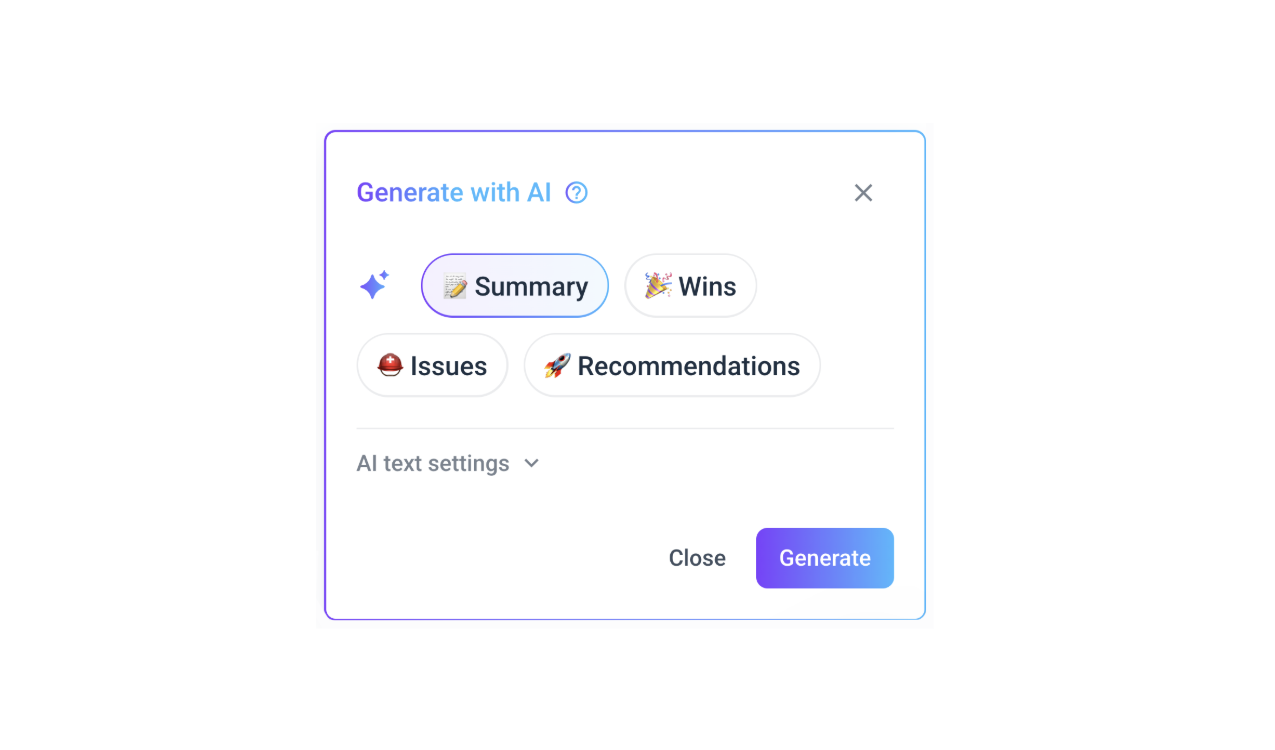
You can then tweak the AI summary to add more granular insights or personal comments.
As Coussons points out:
AI insights can be useful, but they’re never a replacement for human analysis.
According to him, you should never skip on adding your own notes:
Clients want to see results, not just raw data, so we always include commentary on why certain metrics have changed and what we’re doing next.
3. Make the Reports Visually Engaging
So far, you’ve selected the KPIs you want to use and decided how to structure your report so your clients can understand what works and what doesn’t.
Now, it’s time to make your report visually appealing.
Sure, Excel charts do the job, but there are a lot of things you can do to make your reports look professional and easier to read.
The biggest change you can make is to choose a dashboard reporting tool that has clean and sleek visuals out of the box.
When building a multichannel marketing reporting dashboard for clients, the best advice is to stick to a minimalist layout.
Olivero explains why:
I keep reports clear and actionable, using visualizations, trend lines, and simplified breakdowns instead of raw numbers. I also highlight key takeaways upfront so clients don't have to dig through data to find the insights that matter.
You may want to fit more KPI widgets onto the page, but keep in mind which ones matter the most.
Group the related data visually and avoid clutter by using plenty of white space.
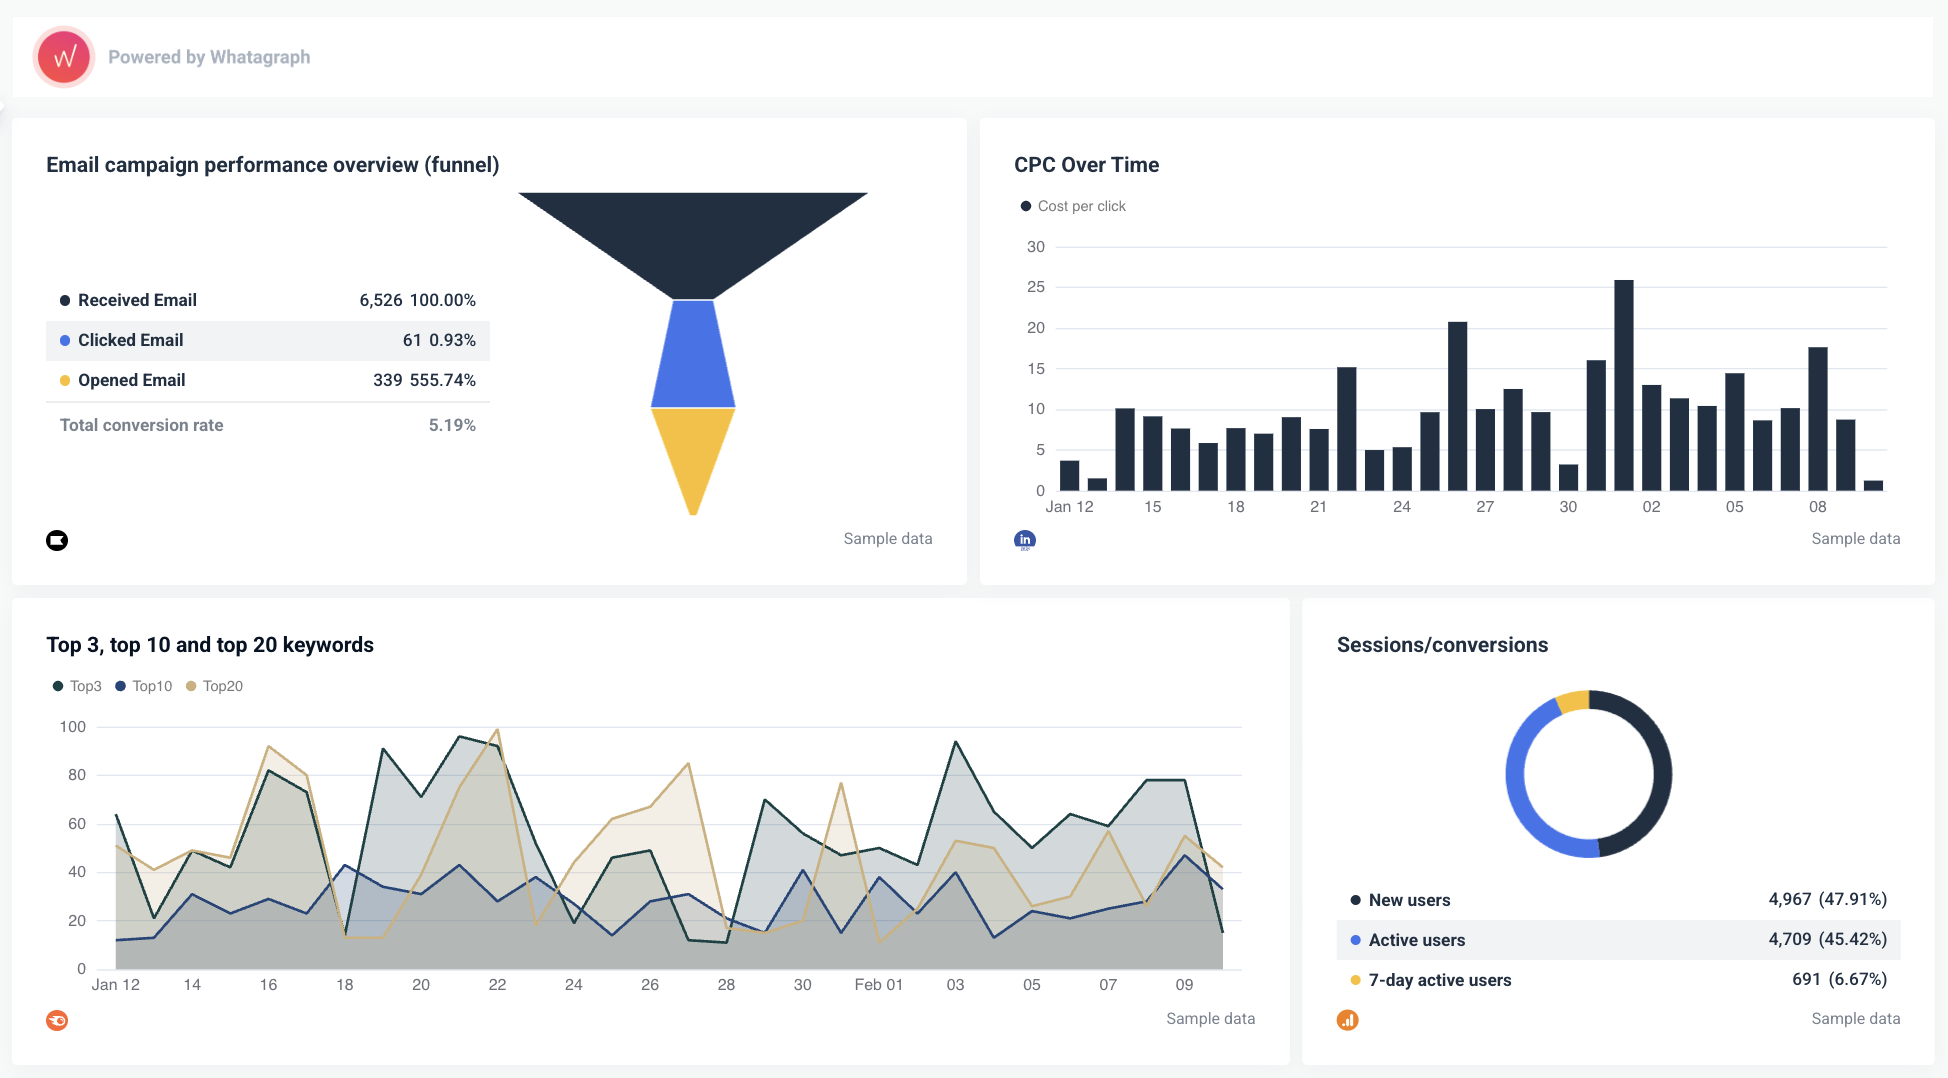
Charts and graphs are your best friends when showing trends. For example:
- Bar graphs for campaign comparisons month-over-month
- Pie charts for audience demographics
- Line charts for performance trends over time or comparisons
Even better if you highlight key data with different colors, like, for example, green for improvements and red for drops. This way, you can draw attention to important changes.
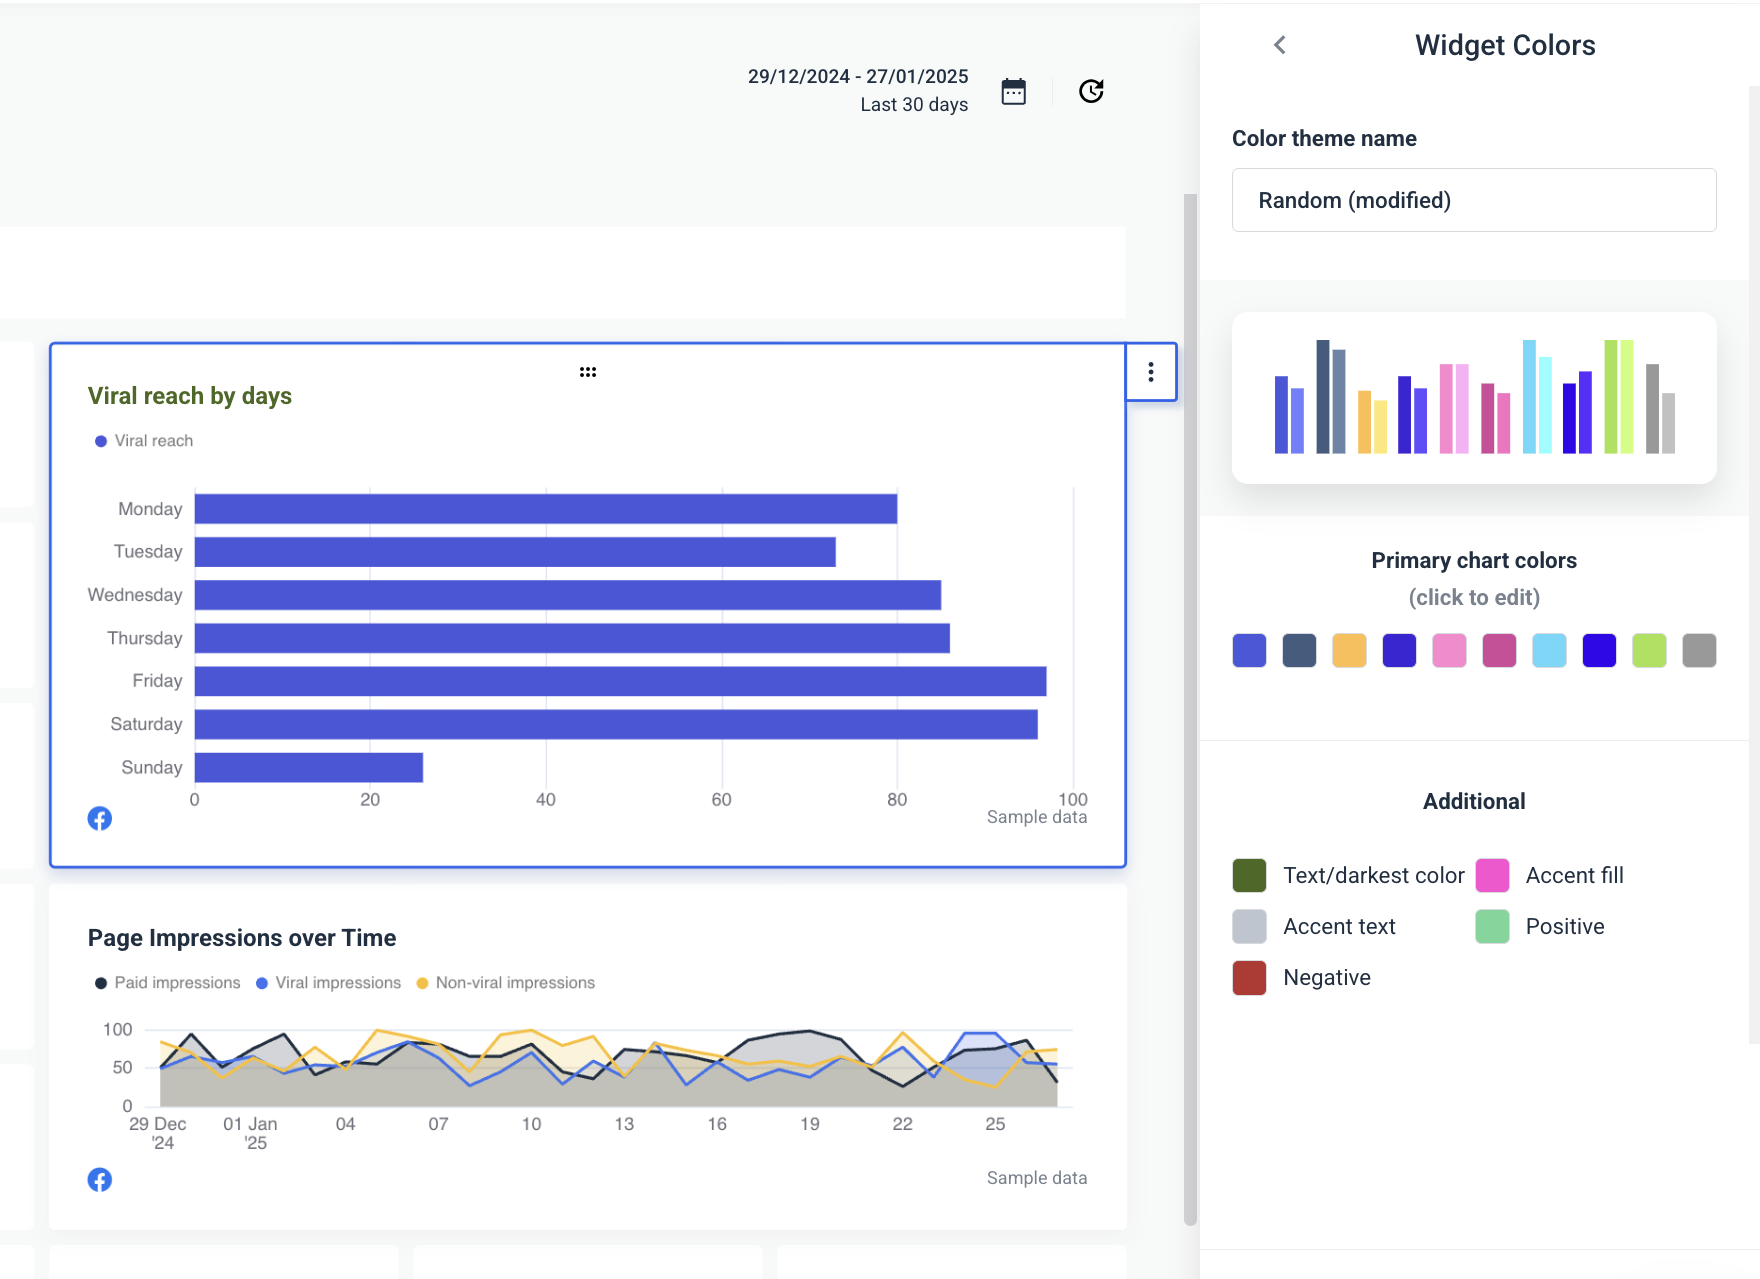
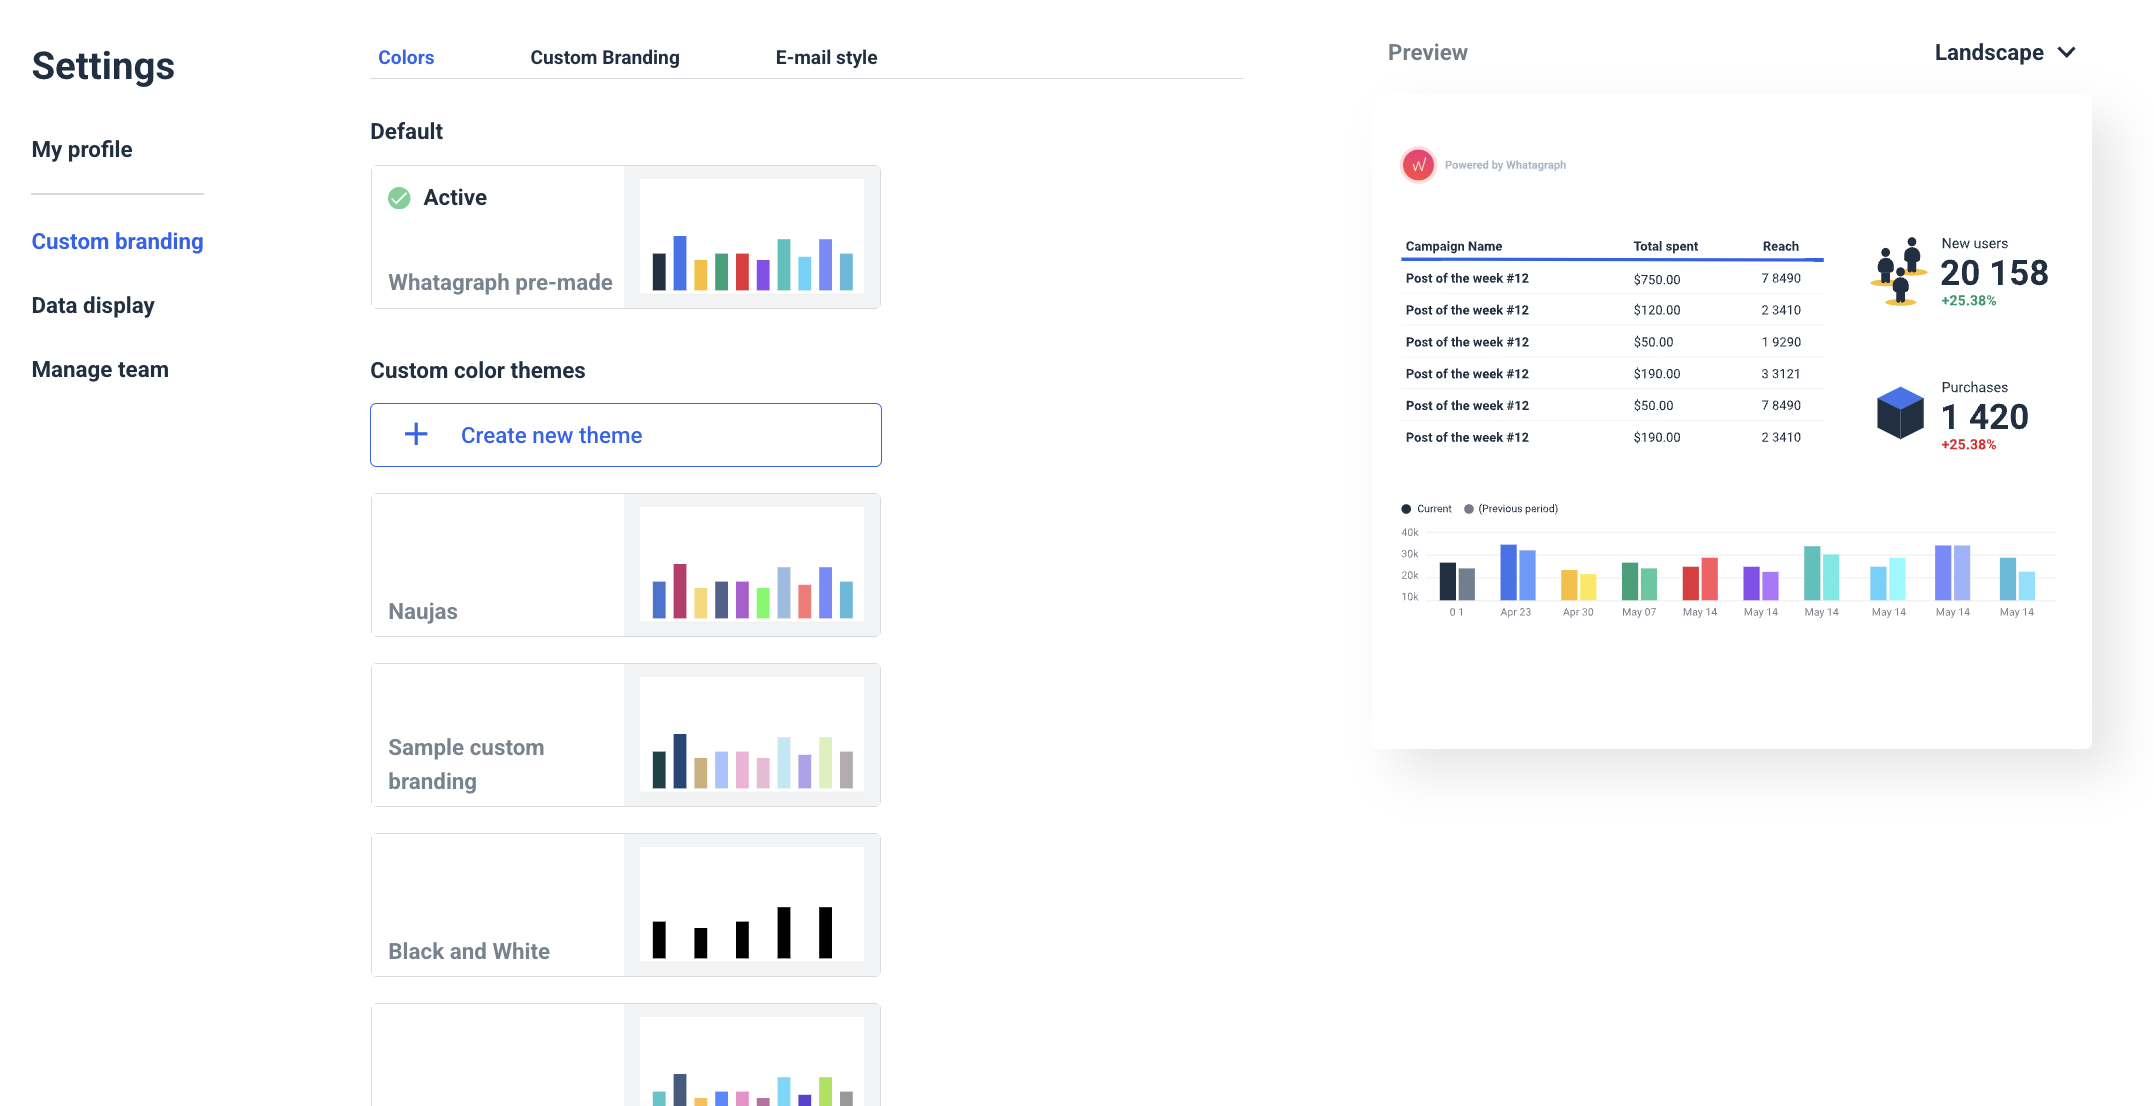
On Whatagraph, you can choose custom colors for every part of your visuals and even save your own schemes.
You can use custom headers with subtle brand elements to make the report look more personalised.
On Whatagraph, you can completely remove any mention of us as a software provider and use your agency’s or client’s logo on every report you make.
You can also change every widget icon for a more personalised or engaging variant.
![]()
Another way to add more visual interest to your cross-channel marketing reports is to highlight the best-performing social media post or ad creative with Whatagraph’s media widget.
Just pick whether you want a compact or expanded version and drop it on your report page.
Select the metrics, dimensions, and other info you want to show, and you’re good to go.
With media widgets, you can:
- Present media and story engagement on a single board.
- Show thumbnails of each post to see what performs and what doesn’t.
- Resize the widget to show more thumbnails.
Finally, you should white-label your reports with custom branding.
Here are some of the perks you get:
✅ Caring for the client: A white-labelled report communicates that you really took the effort to create it instead of using a generic third-party tool.
✅ Boosting brand awareness: You can use your agency logo on every report you send to boost your brand awareness. In combination with your good work, clients will automatically relate your agency's colors with efficiency and trust.
✅ Professionalism & confidentiality. When you remove the third-party branding, clients feel reassured that their data is handled securely in your ecosystem.
White labelling is especially important if you're looking to sign on bigger clients.
Let's take the example of Dtch. Digitals, a full-service agency based in the Netherlands that made rebranding—down to the last report—a key part of their growth strategy.
In 2023, this agency grew rapidly, expanding to over 50 employees and 250 clients.
Along the way, they realized their identity and operations needed to evolve, too.
As Stef Oosterik, their Quality Manager, explained, they needed to level up their reporting tech stack to meet the demands of the growing team and clients.
We wanted to make reporting more professional for our clients and ensure it aligned with our rebranding.
While with their previous reporting software, they could only upload a logo, with Whatagraph,
Dtch. Digitals could fully white-label the dashboards and reports to reflect their new branding.
The look and feel of the reports is way more professional compared to before, Stef noted.
With their old reporting tool, the visuals were static and looked outdated. With Whatagraph, the agency now has sleek, professional reports that match their new identity.
Whatagraph's live dashboards, cross-channel insights, and overall intuitive design also made it easier for the Dtch. Digitals’ team to communicate the results of their marketing campaigns with clients.
Whatagraph’s reports are now our foundation for discussing results with clients. And thanks to attractive visuals, clients can see the professionality behind our agency, Stef concluded.
In fact, since adopting Whatagraph, Dtch. Digitals have seen a 50% decrease in churn.
4. Automate Reports
One client will ask for a live cross-channel marketing dashboard, which they can check in real-time, even on mobile.
Another will tell you they prefer static PDF reports they can file and present at monthly performance meetings.
The best thing you can do?
Choose a reporting solution that can do both without missing a beat.
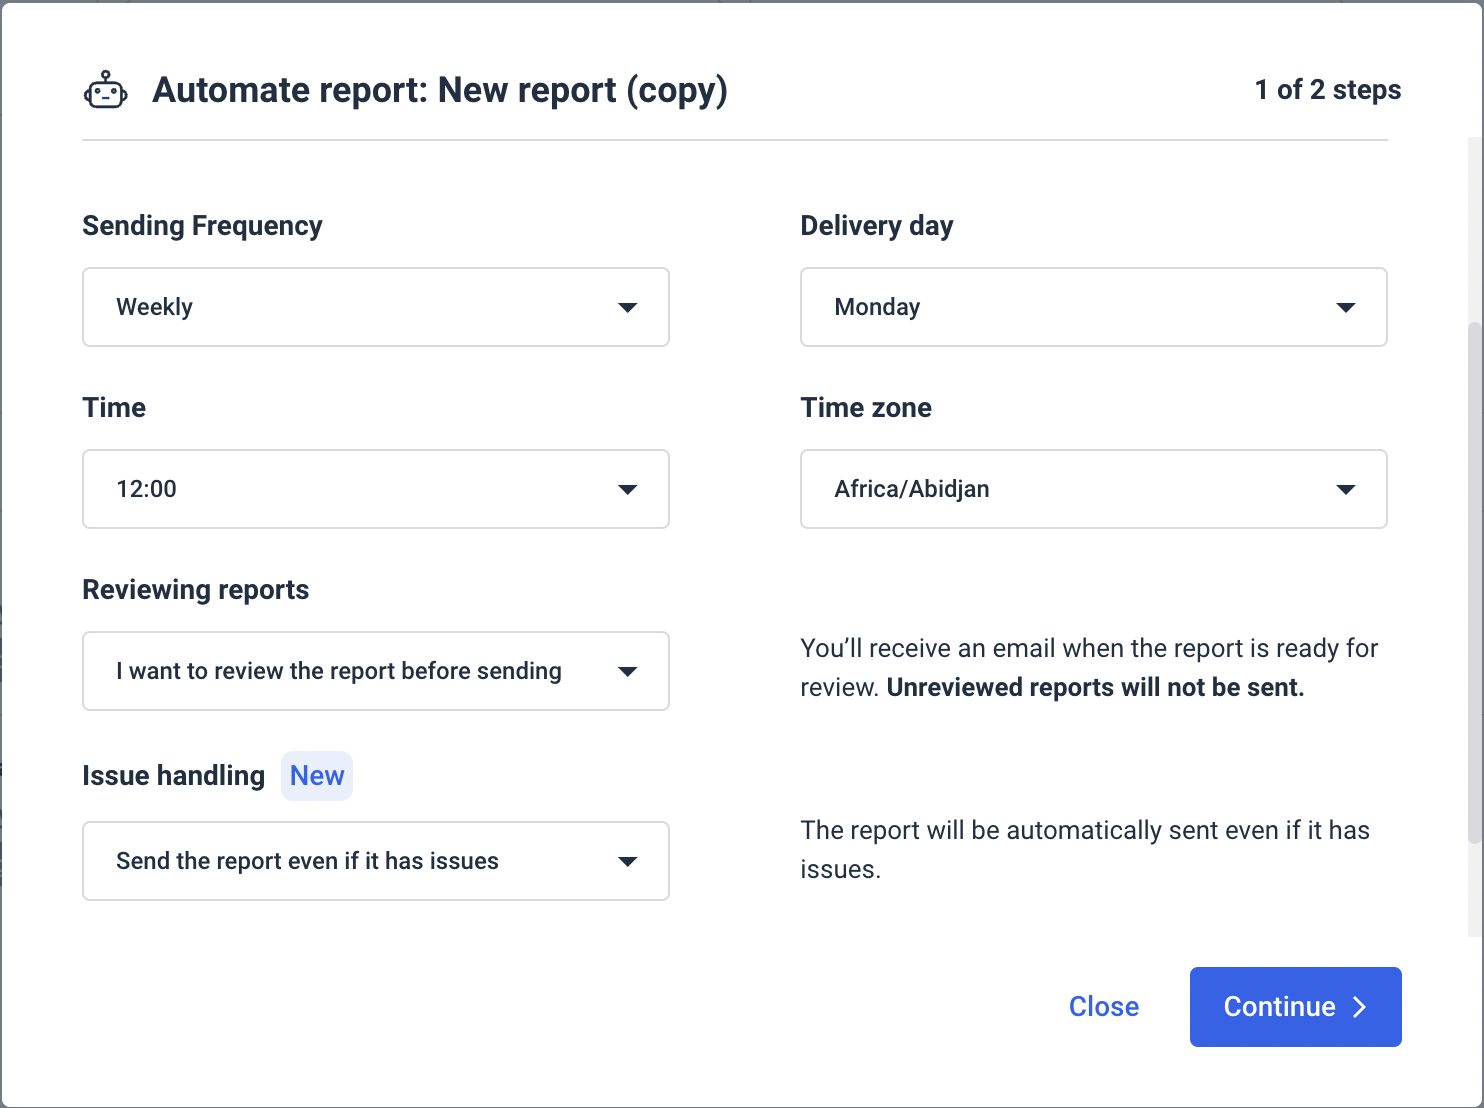
On Whatagraph, you can easily set up both report automation options:
- Share a link to a live report: Clients can access it anytime. They can change the date range to see how the performance has changed over time and hover over graphs to get more data from specific touchpoints.
- Schedule PDF report sending: Once you finish a report, set up an email schedule by the client’s preferences.
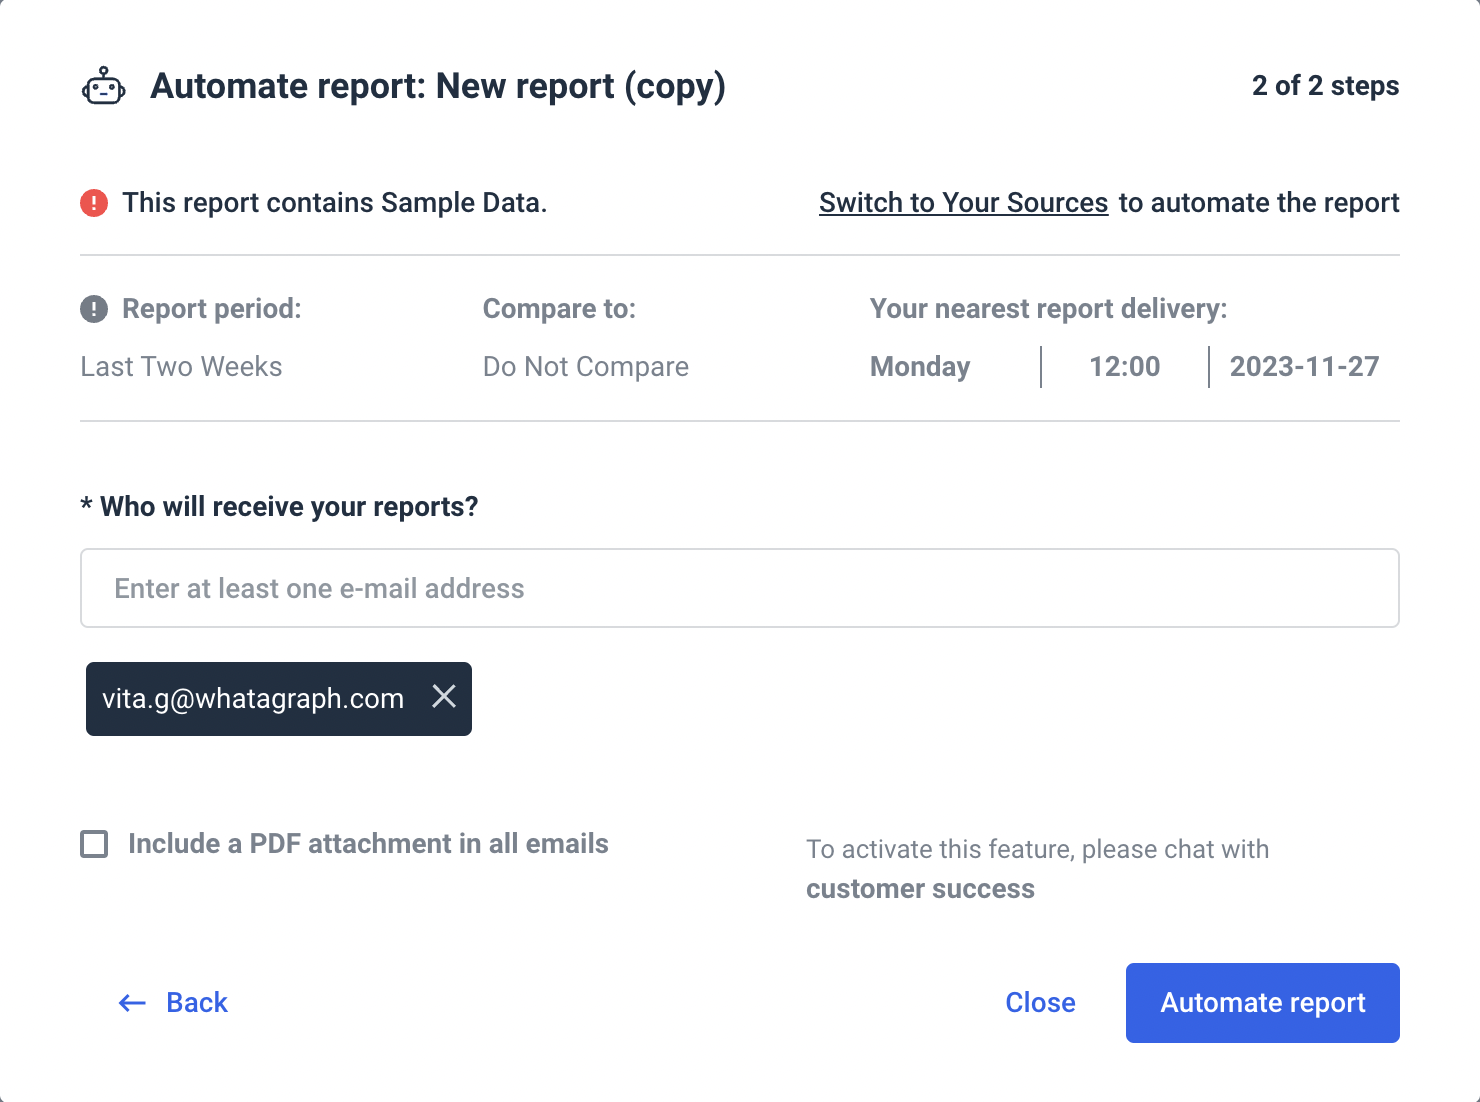
Set a date range, time of day, time zone, and you're done. The client will get a fresh report in their inbox at the same time every time.
Still, Coussons advises against setting the reports on full autopilot:
Automation helps, but we always include a human touch, every report has an accompanying summary with clear takeaways written, not just charts and tables.
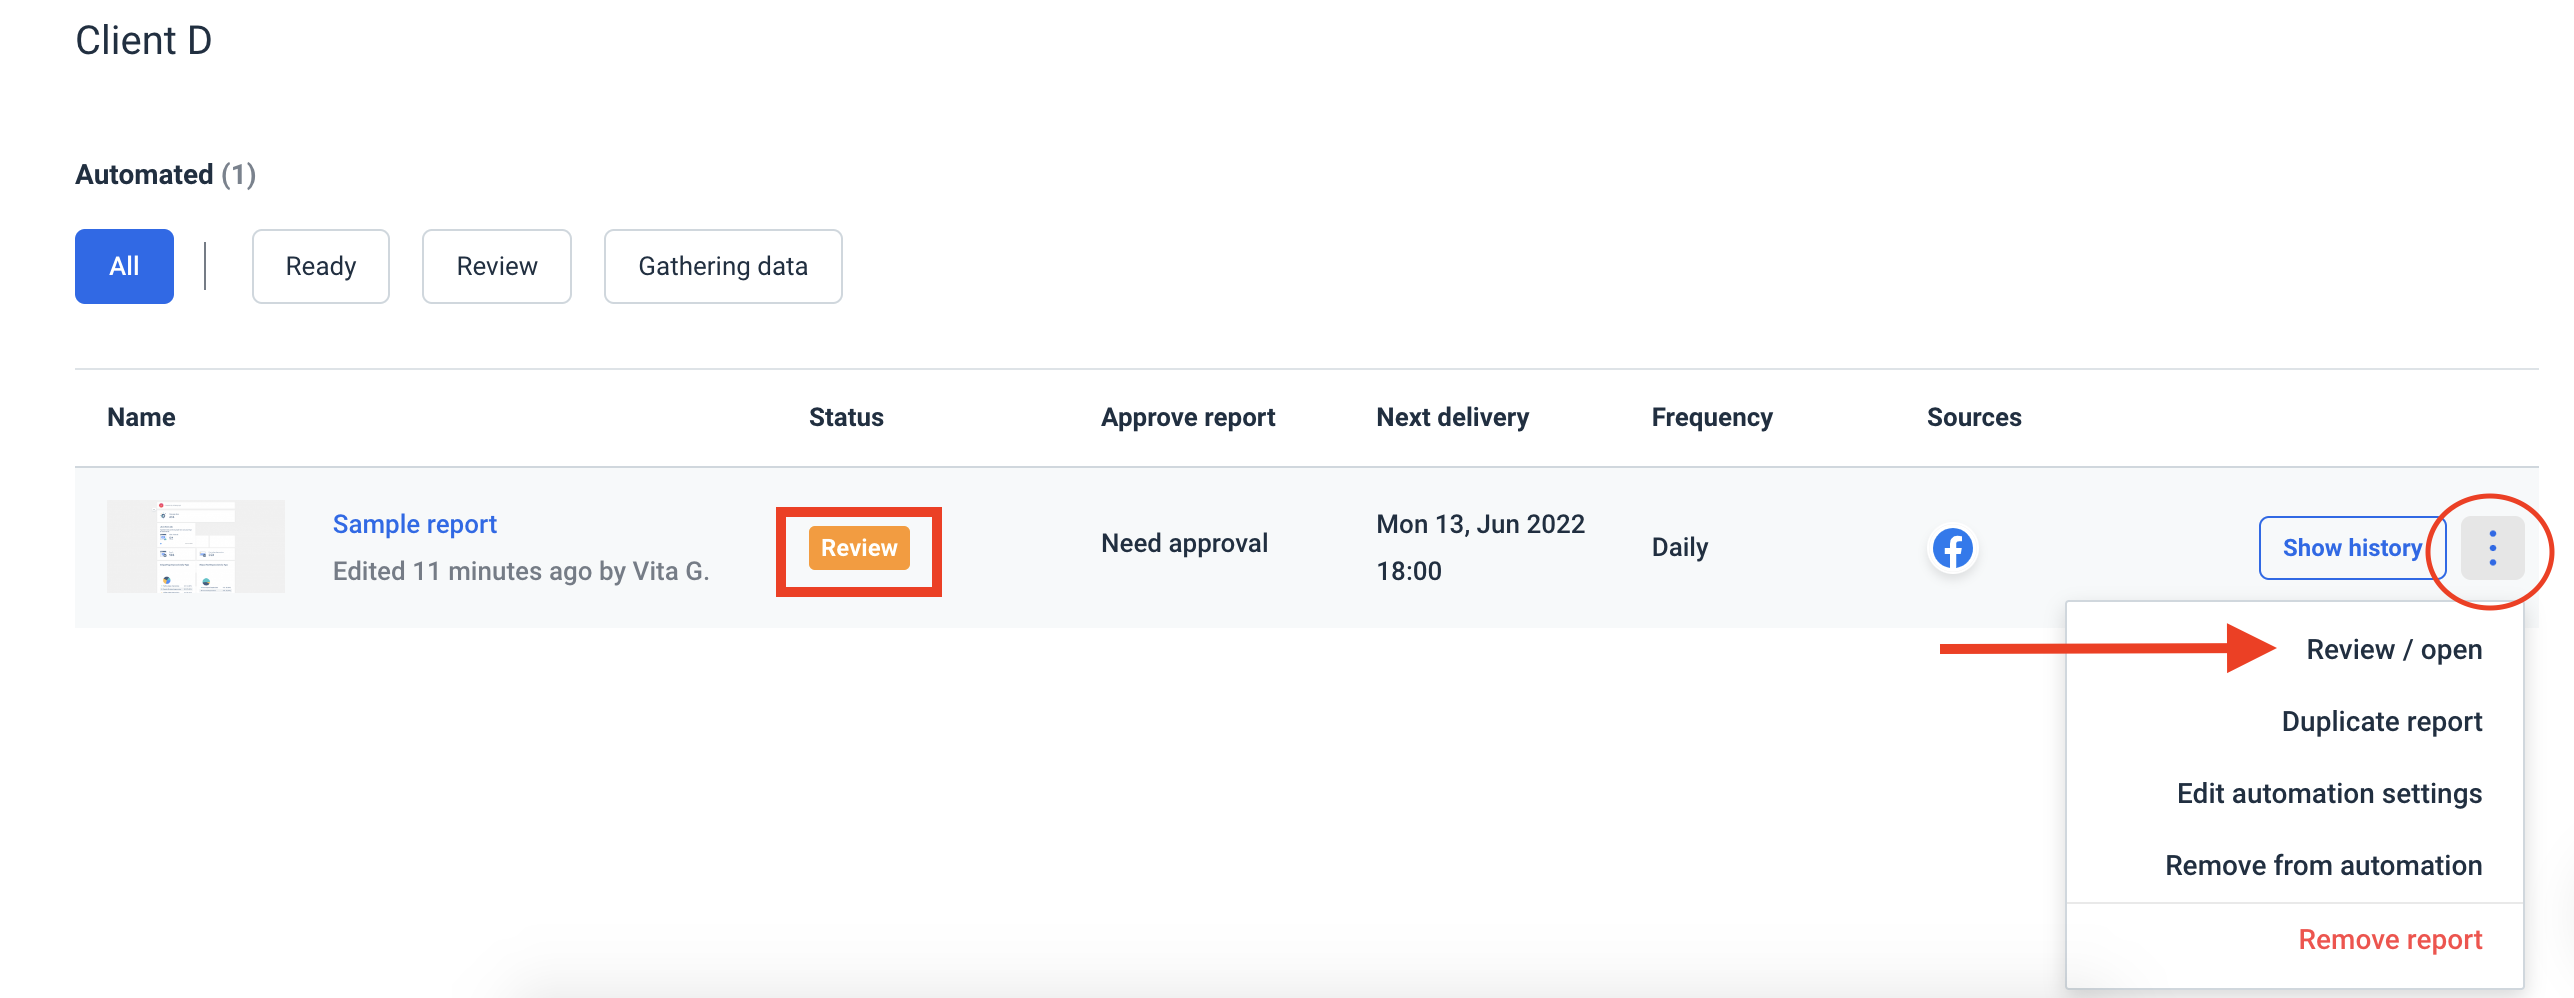
Even when you automate report sending, on Whatagraph, you have a Review step before the report gets sent.
This is where you give each report a final check and, if needed, add an AI-generated summary or suggest the next steps.
5. Keep the Reports Consistent
Use the consistent report format, structure, and terminology in every report you send.
It’s also important to use the terminology that your clients are familiar with.
For example, different marketing platforms often have different names for the same metrics.
On Whatagraph, you can easily unify metrics and dimension names for any data source group.
This not only makes reports cleaner and more organized but also easier for non-marketers to understand.
No one explains this better than Drew Cove, SEO of DigitalParc:
We use Whatagraph for all our client’s reports. The ability to title metrics differently is important to us because we often report the same metrics to different clients and just need to call them differently because many clients have internal terminology that is very different from one another.
Also, you may think that changing the report layout from time to time is good for keeping the readers engaged, but it will only confuse them.
To avoid this, Peter Murphy Lewis, CEO of Strategic Pete, regularly uses report templates:
Consistency also matters—use the same report format every time so clients can quickly find and interpret what matters to them.
Apart from the library of pre-made templates, on Whatagraph you can save any report as a team template and use it whenever you want.

How to Create a Cross-Channel Marketing Report: Step-by-Step Guide
You can create a cross-channel marketing report in two ways:
- Make a copy of this FREE Google Sheet – this is free, but you won't get comprehensive omnichannel marketing insights, and you'll need to spend a lot of time copying and pasting data points from various channels.
- Follow the steps below to use Whatagraph – this is easy and fast since you don't need to do any manual work. Whatagraph collects, cleans, and visualizes your data automatically.
Step 1: Connect all Your Data
Start by connecting the data from all the channels relevant to your cross-channel marketing campaign.
With Whatagraph, you don't need to stitch any spreadsheets. Instead, you can connect all your data in just a few clicks.
Whatagraph has fully managed integrations with popular social media platforms, SEO, PPC and other marketing tools:
- Google Analytics 4
- Google Search Console
- Ahrefs
- Semrush
- Facebook Ads
- LinkedIn Ads
- YouTube
- Mailchimp
- CallRail
- Salesforce
- HubSpot
And many others.
These direct integrations are much more reliable than third-party connectors that many other marketing reporting tools use. Third-party connectors can slow down your online report or give you inaccurate data as they can refresh at different rates from one another.
With Whatagraph, you can pull data from scattered sources right into your reports without missing a beat.
The integrations are developed and maintained by our dedicated team of engineers, so once you connect your accounts, there’s nothing to update or re-connect on your part.
How to do it:
- Open Whatagraph, go to Data Sources and select the marketing platforms you need.
- Follow the on-screen instructions to provide the necessary credentials and connect each source.
- Once connected, Whatagraph will automatically pull in the latest data and update it automatically.
Apart from these integrations, you can connect any other data source you have, including offline data (store visits, TV advertising, etc), in several ways:
- Google BigQuery connection
- Custom API connection
- Google Sheets
- Manual copy/pasting Excel, Google Sheets, or CSV data in Offline Widgets. (see below)
This way, you get:
✅ A centralized view of all your performance metrics across platforms and tools.
✅ Accurate and relevant data in every report you send.
Step 2: Choose a Report Template or Start From Scratch
You can create your report from scratch and structure it just as you want.
Still, having a template to start with saves a lot of time, especially if you need to report to several clients or stakeholders regularly.
Whatagraph offers pre-made digital marketing report templates you can customize for each client.
The template is your starting point. From there, you can pick the metrics and add sections that best present your campaign’s results.
How to do it:
- Go to the Templates section in Whatagraph.
- Choose a report or dashboard template that matches your needs.
- Alternatively, select Create New Report to build a report from scratch, choosing only the widgets and metrics that you need.
The result:
✅ Faster report building for multiple campaigns and stakeholders.
✅ You can tailor each report for a specific campaign by highlighting the most relevant data.
But, when it comes to tailoring, the next step is crucial.
Step 3: Customize the Report for a Specific Client
On Whatagraph, you can quickly customize any report template to a client's specifications.
Once you find a template that's the closest match to your needs, you can start tailoring it.
Let's recap quickly:
✅ Connect the data sources: You can load a template with just one source connected, but now you need to add other sources that hold your campaign data.
✅ Customize metrics and widgets: Check out the metrics already included in the template and decide if you need to remove some of them so the clients can really focus just on the important ones.
✅ Choose the appropriate visuals: Whatagraph has different chart options, such as line charts, bar graphs, funnels, and pie charts. If your client prefers a bar chart to a pie chart for a specific metric — a piece of cake. Pick the bar chart widget and select the metrics and dimensions you want to see.
✅ Arrange the widgets for easy interpretation: Always put the key metrics like New Subscribers, Customer Engagement, and Conversions at the top of your report, right next to the goals widget.
You can also create custom charts and save them as template widgets.
Step 4. Organize Data for Actionable Insights
Let’s do a quick recap:
✅ Connect scattered sources – Done
✅ Pick a template – Done
✅ Tweak it for your campaign – Done
But here’s the catch—your actionable insights are still buried under a mountain of raw data.
That’s where Whatagraph steps in.
Instead of sifting through rows of numbers, you can use Whatagraph to cut through the noise and find exactly what’s driving your campaign’s success (or holding it back).
With Organize, you can turn scattered data into clear, actionable insights using:
- Custom metrics – Standardize and rename metrics across platforms or create new ones with a simple formula.
- Custom dimensions – Unify naming conventions across different data sources and group data for easier comparison.
- Data blending – Merge multiple data sources into one unified dataset for quicker insights and a clutter-free dashboard.
No more scrolling through long reports—just clear, data-driven decisions at a glance.
All these features are 100% code-free and can help you cut through the clutter and uncover hidden actionable insights.
Thanks to recently launched Performance Monitoring, you can get actionable insights from your data even faster.
You can create:
- Source groups: Group 100s of scattered data sources into a unified group in seconds.
- Custom tags: Add custom tags to your data and filter it by client, business type, location, Account Manager, etc.
- Overview: Visualize your key metrics in one view and easily spot performance trends.
The Overview is especially useful for bigger marketing agencies, who can use it to:
- Get an unified view of their client portfolio
- Track team performance
- Drive faster decision-making
Step 5. White-Label the Report with Client Branding
With Whatagraph, every report you share looks and feels polished and professional—just the way your clients expect.
Here’s what you can customize:
✅ Branding – Upload your logo or your client’s logo for a fully personalized look.
✅ Colors – Match your reports to brand guidelines with custom color schemes.
✅ Headers & footers – Add important notes or branding elements.
✅ Custom domains – Host and share reports on your own domain.
✅ Widgets & icons – Adjust widget colors and icons to align with your brand’s aesthetic.
Whether you want a global theme for your agency or need custom styling for individual reports or widgets, Whatagraph gives you complete control.
You can also share your white-label reports on a custom domain and remove all traces of Whatagraph—so your reports look 100% like your own.
Step 6. Automate How You Share Your Report
The last step is to share your reports with your clients or stakeholders.
You can do this on Whatagraph in three main ways:
- Share password-protected links to a live report.
- Send reports as automated emails on a regular timetable (e.g. every week, month, …).
- Export as Excel or CSV files.
How to Structure a Cross-Channel Marketing Report
Here are the 6 sections of a cross-channel marketing report that no marketing professional will skip.
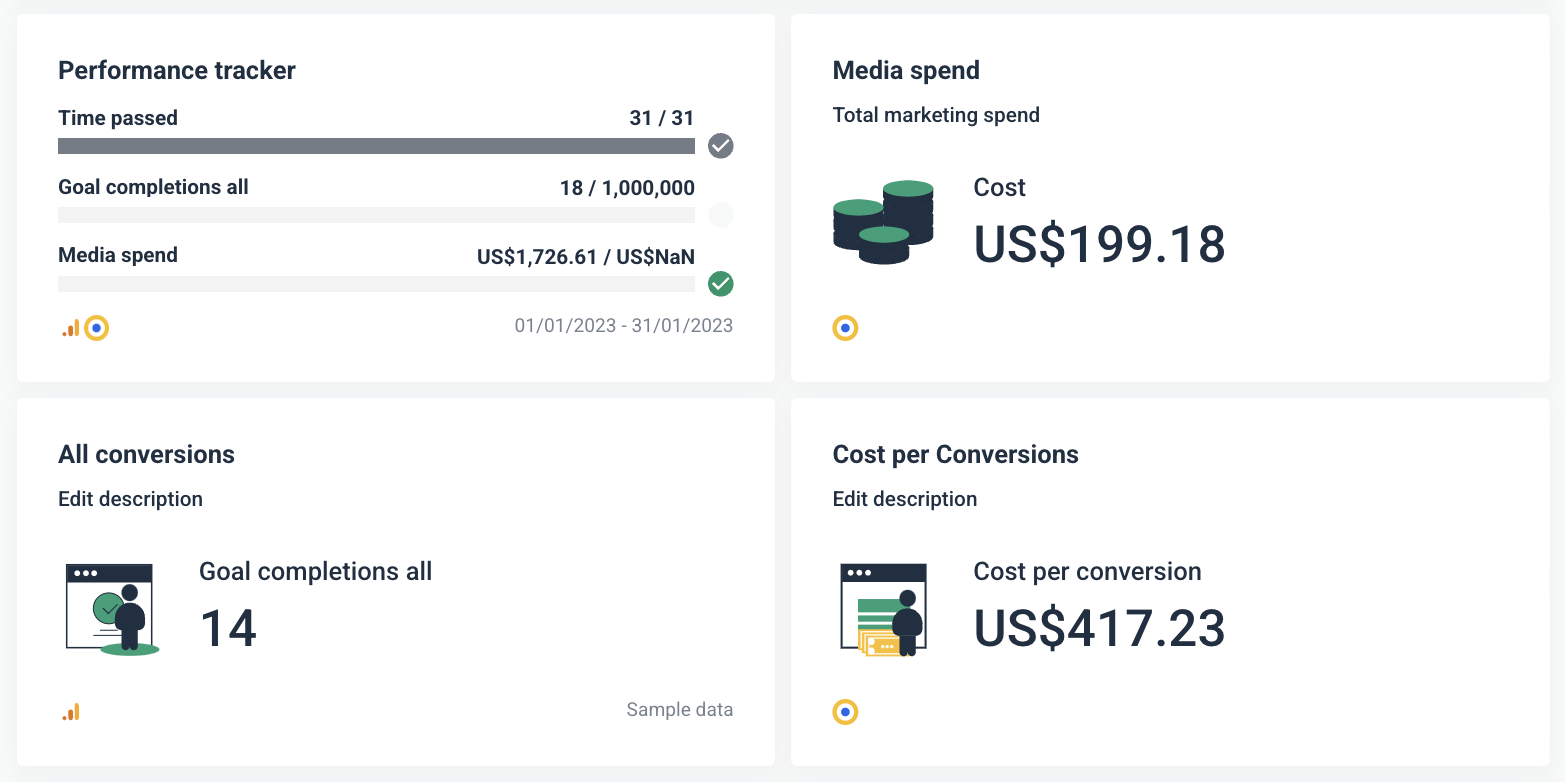
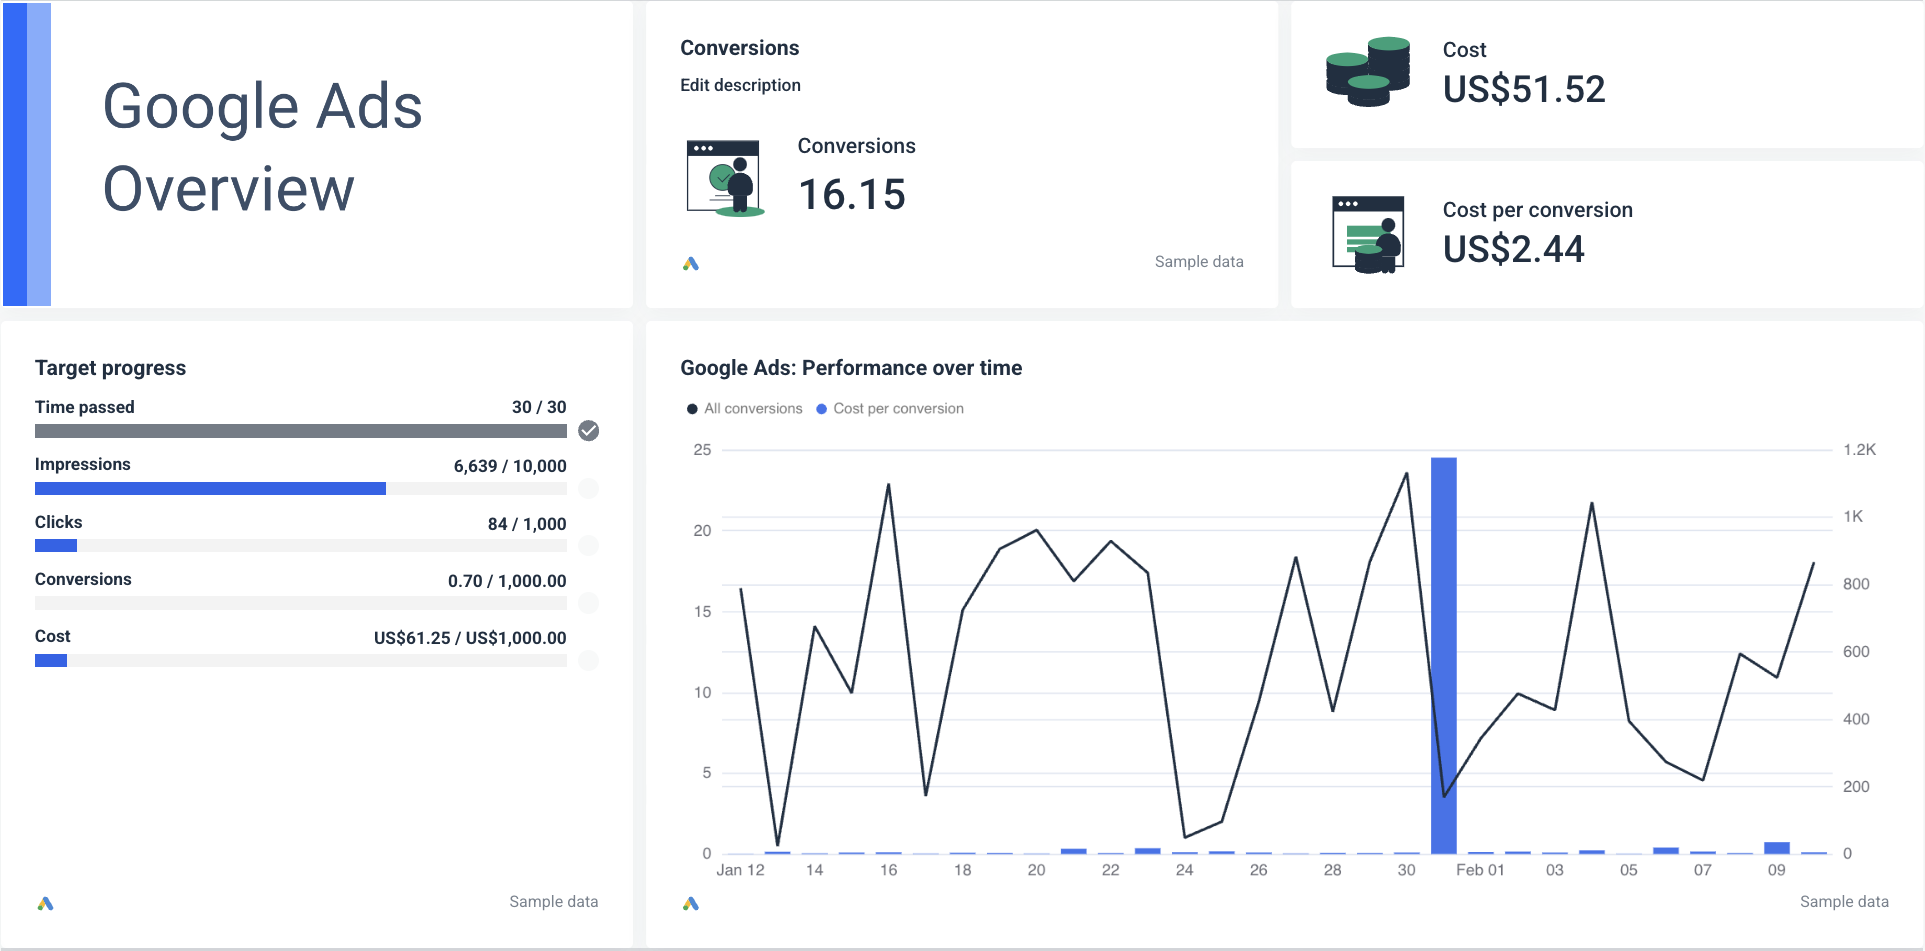
1. Performance Overview
The Performance Overview section gives you a clear breakdown of key marketing metrics—so you can track goal completion, spend, and quickly compare the campaign performance with the previous month.
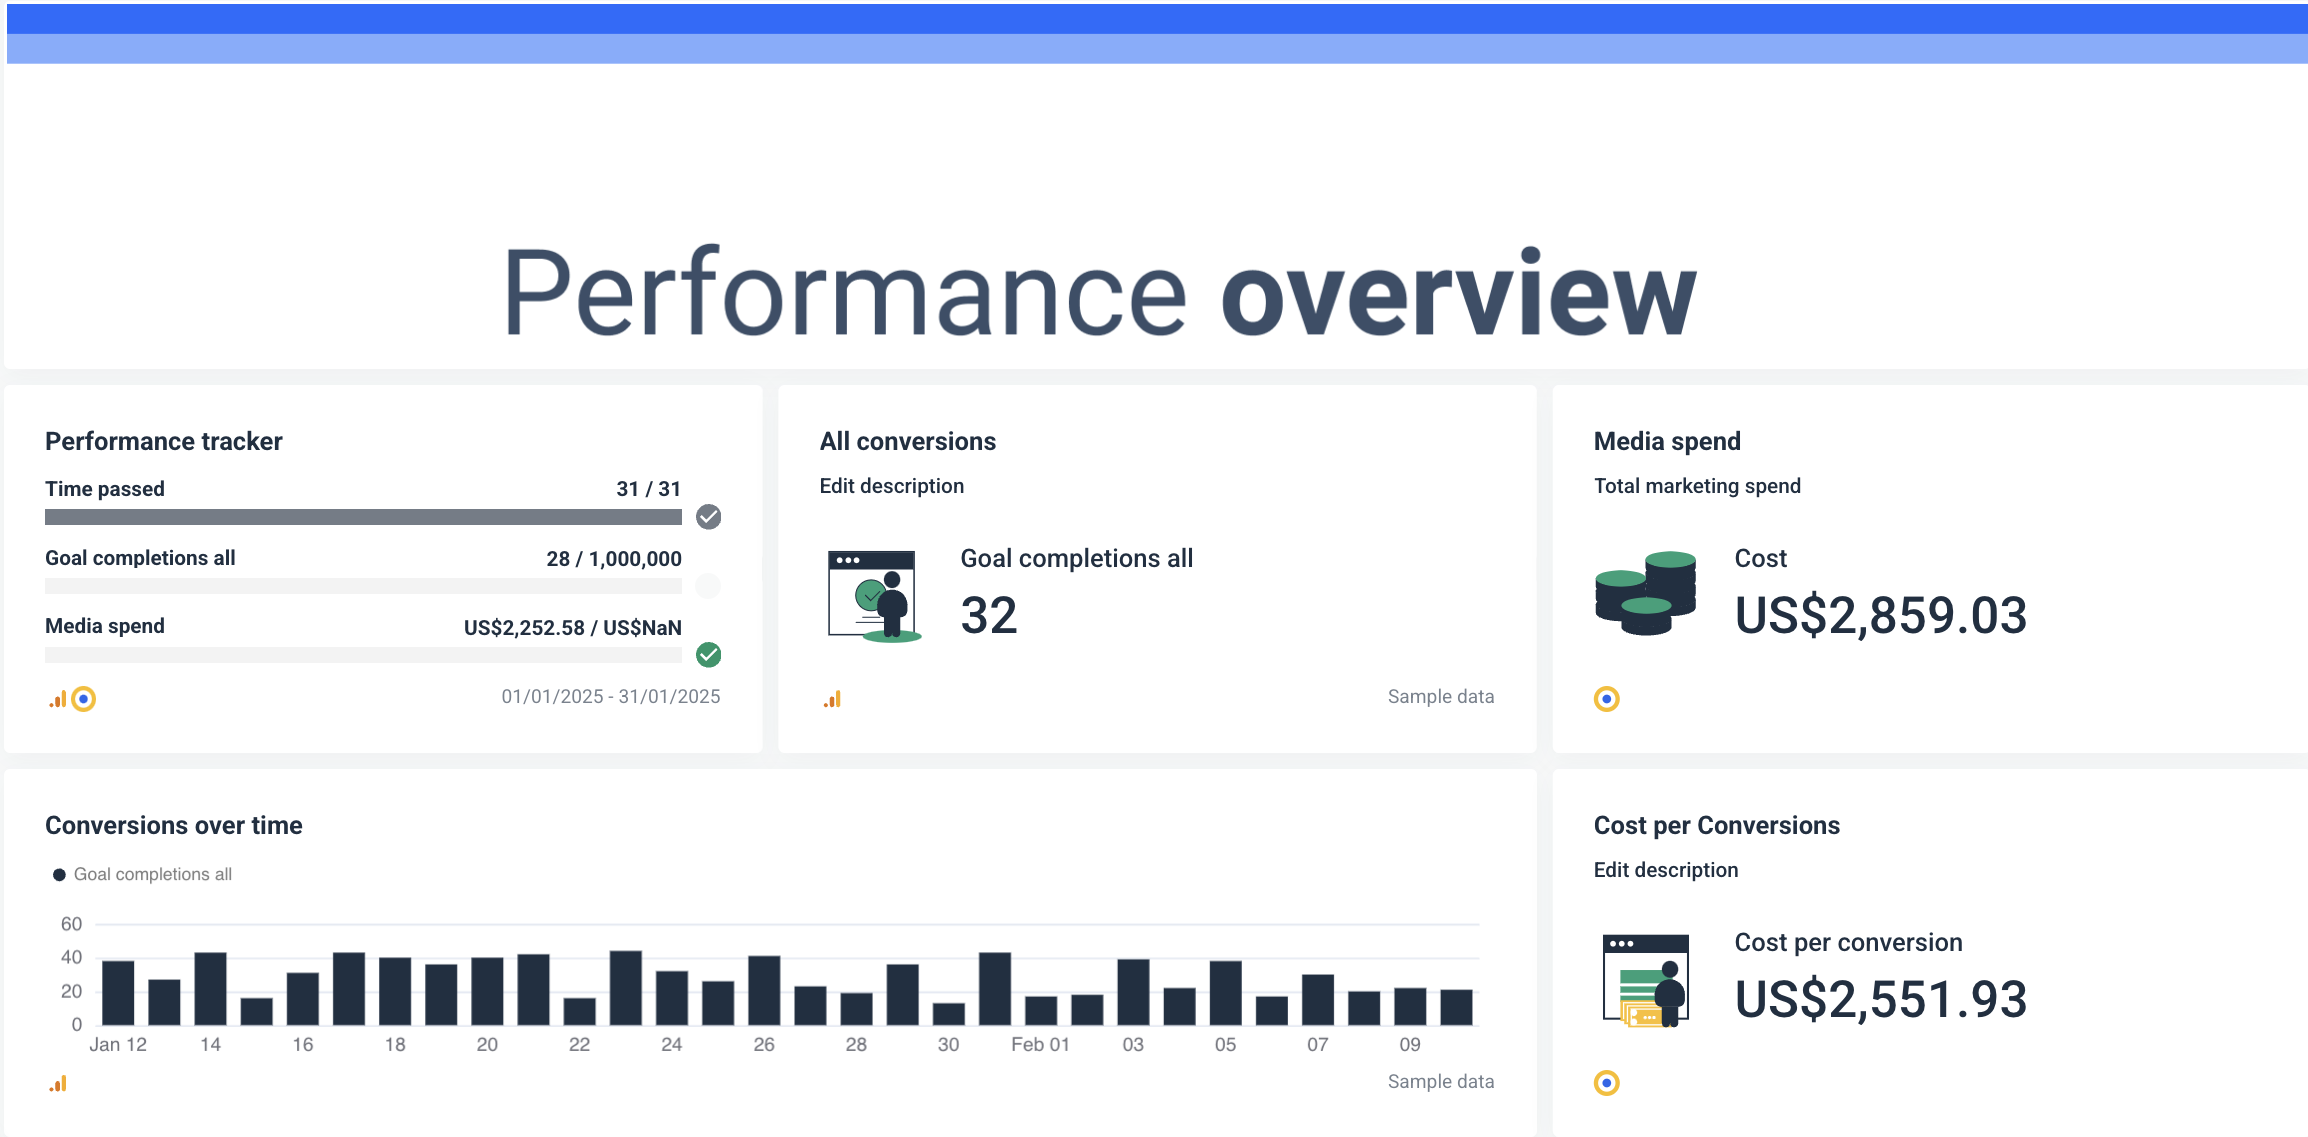
Key metrics to include:
- All Conversions: Shows the total goal completions, so you can measure the overall effectiveness of your cross-channel marketing strategy right on. If the number is low, you should look deeper into areas that need optimization.
- Media Spend: Displays the total amount spent on marketing campaigns. It’s useful for keeping budgets in check and aligning your spend with results.
- Conversions Over Time: A timeline view of goal completions makes it easy to spot trends and seasonality. It helps you identify high- and low-performing days so you can tweak your scheduling.
- Cost per Conversion: Tells you how much you’re spending per successful action (e.g., leads, sales, sign-ups). A high cost means you may need to refine targeting or optimize ad spend.
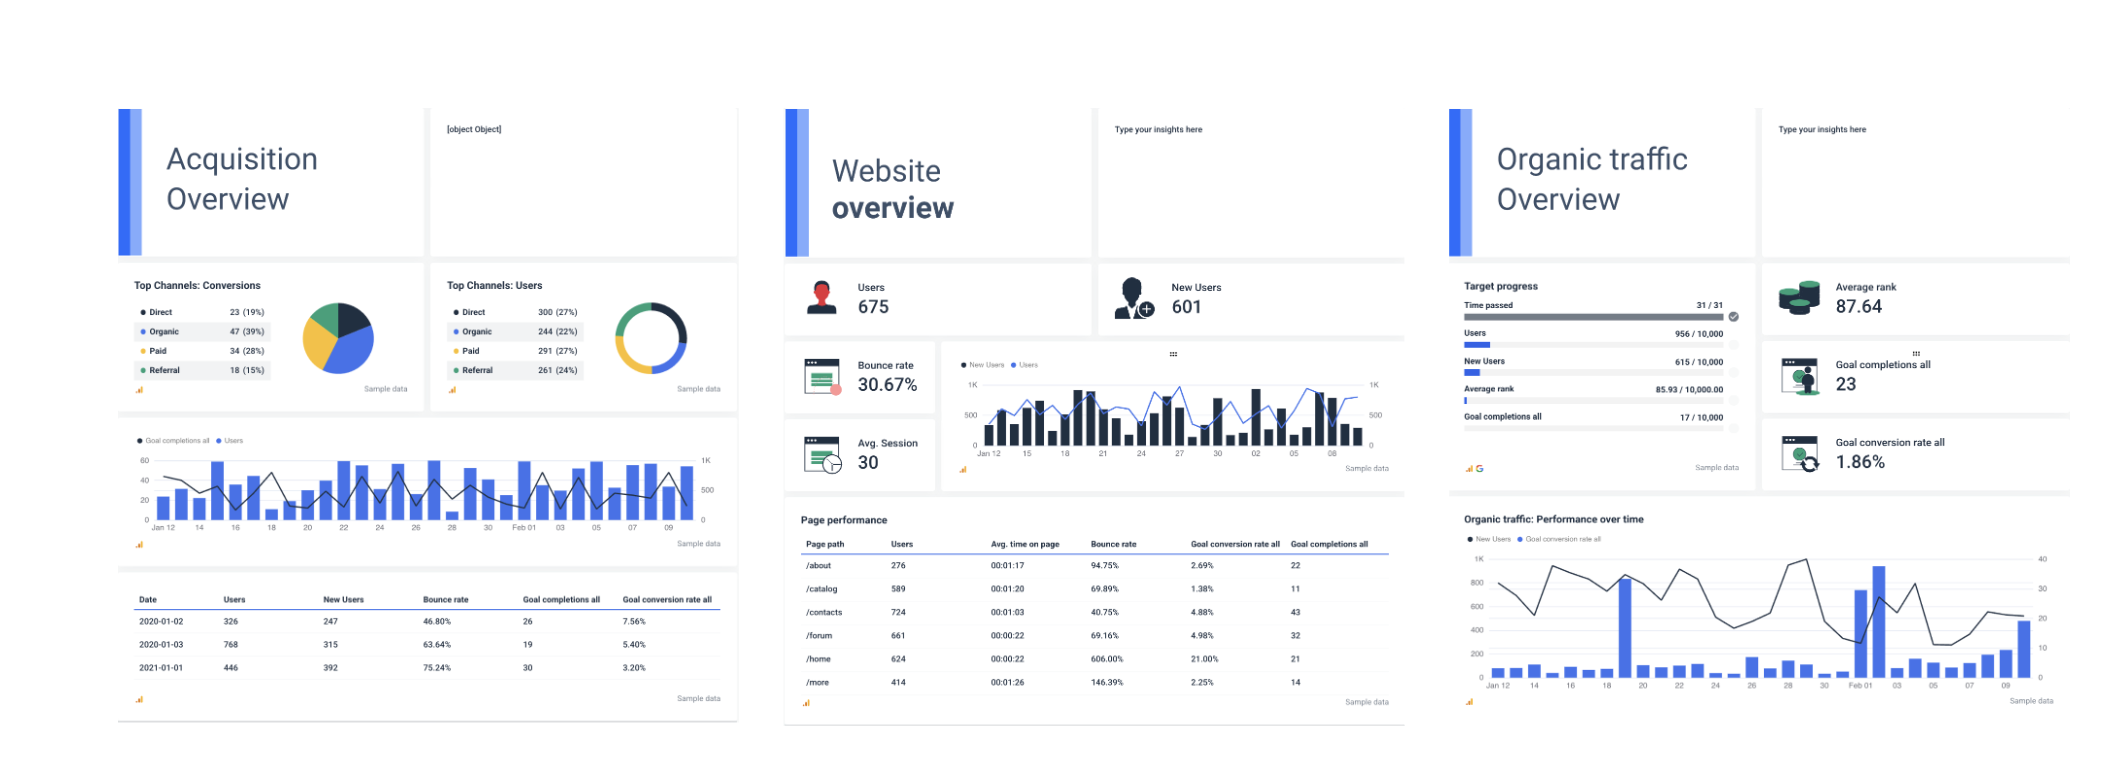
2. Acquisition Overview
The Acquisition Overview helps you understand how users find your client’s website and how effectively each channel drives conversions.
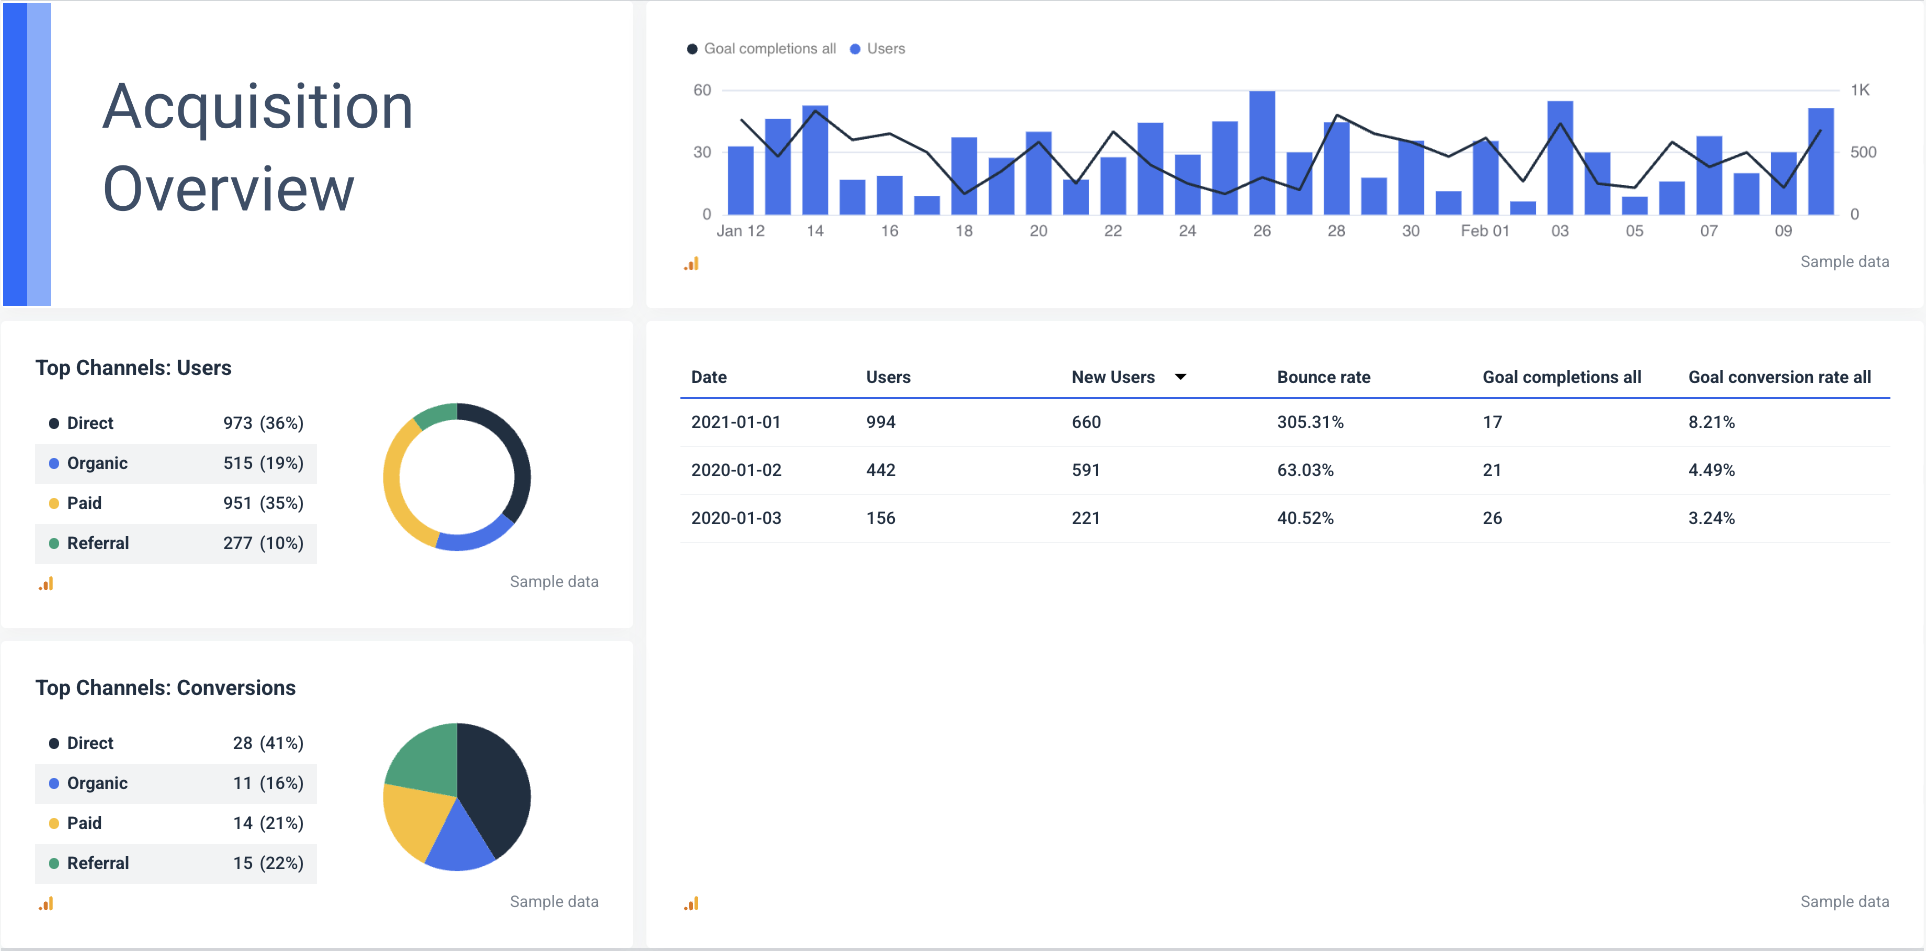
Key metrics to include:
- Top Channels - Users: Shows which channels (Direct, Organic, Paid, Referral) bring in the most visitors. When you know which sources drive the most traffic, it’s easier to focus your marketing efforts.
- Users & New Users: A high percentage of new users is a sign of strong reach, while a high returning visitor rate suggests strong engagement.
- Bounce Rate: Measures how many users leave without interacting further. A high bounce rate can mean two things: A) irrelevant traffic or B) poor user experience.
- Goal Completions & Conversion Rates: These are the most important KPIs of success as they tell you how many users take action (purchase, sign up, download, etc.).
3. Website Overview
You can use the Website Overview to get a big-picture view of your site's performance.
It helps you track user engagement, identify problem areas, and optimize messaging for better results.
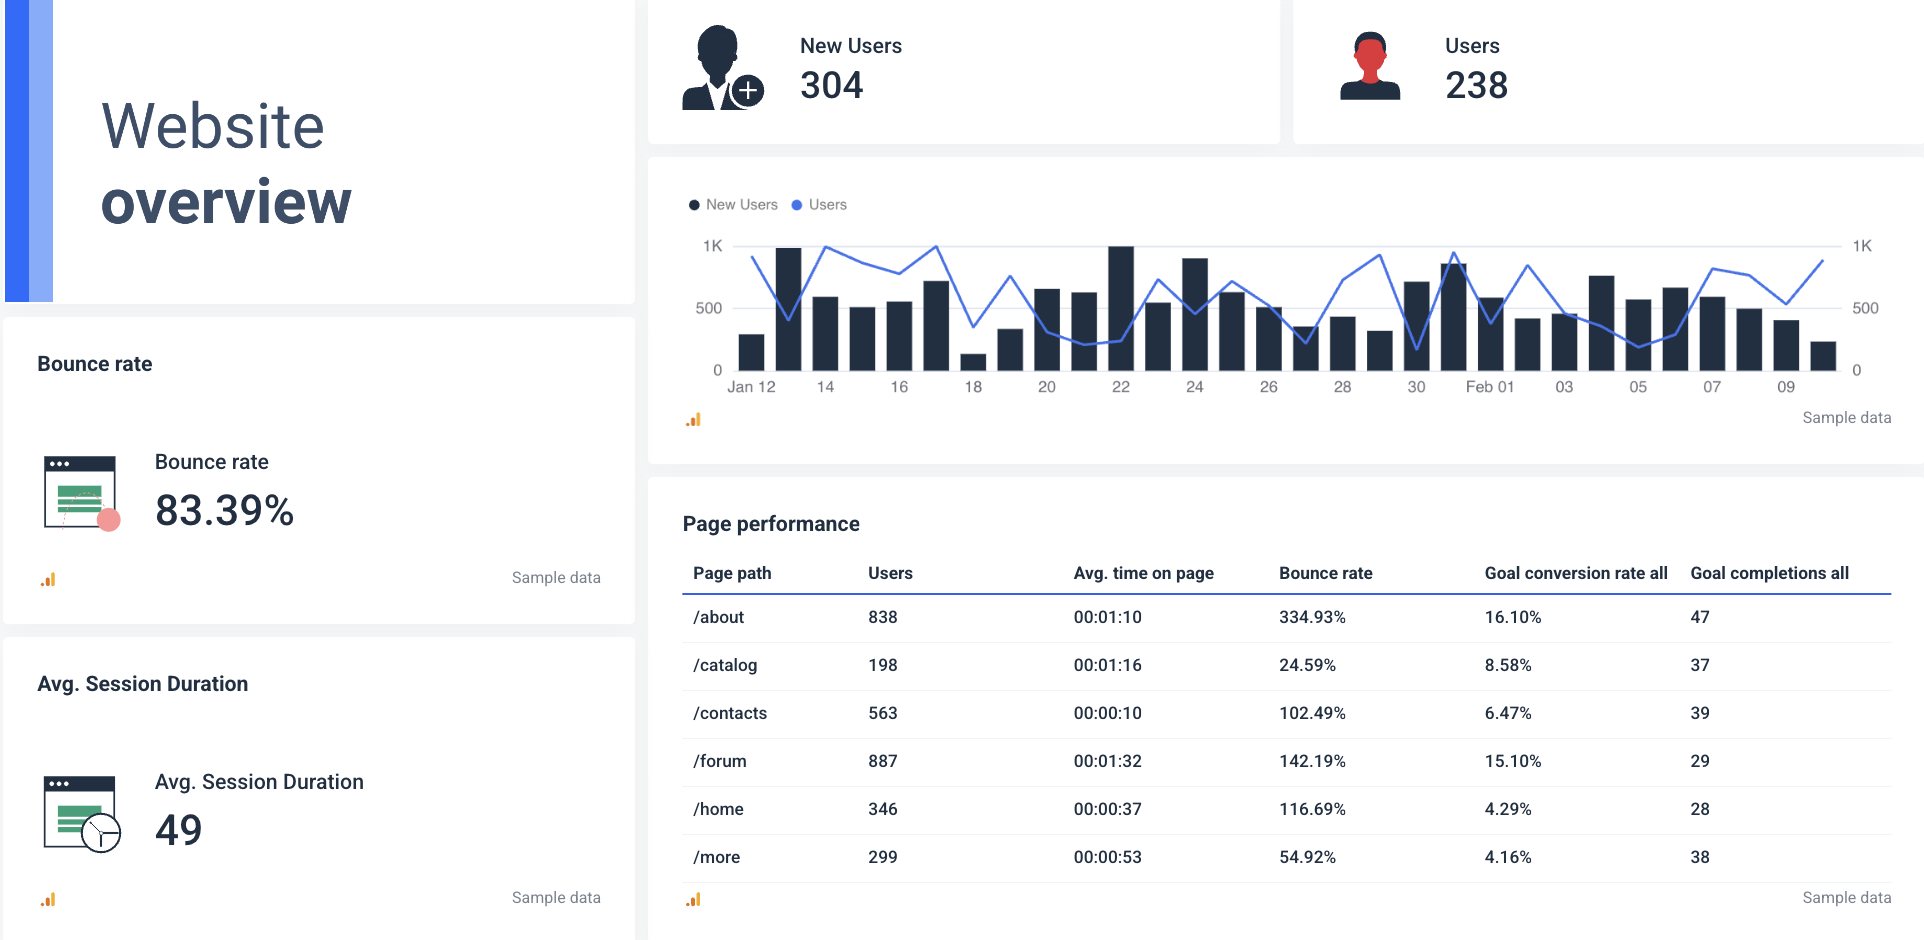
Key metrics to include:
- Users & New Users: A high number of new users means your outreach is effective. A high share of returning users is a sign of strong engagement.
- Bounce Rate: A high bounce rate (like the one shown here) can signal issues with content relevance, page load speed, or user experience—something worth looking into.
- Avg. Session Duration: A higher session duration usually means users find your content interesting, while a low number is a warning for weak engagement.
4. Audience Overview
This section helps you understand who your users are, where they come from, and what interests them.
Instead of guessing who your audience is, you get a clear breakdown of demographics, device preferences, and customer behavior to tailor campaigns effectively.
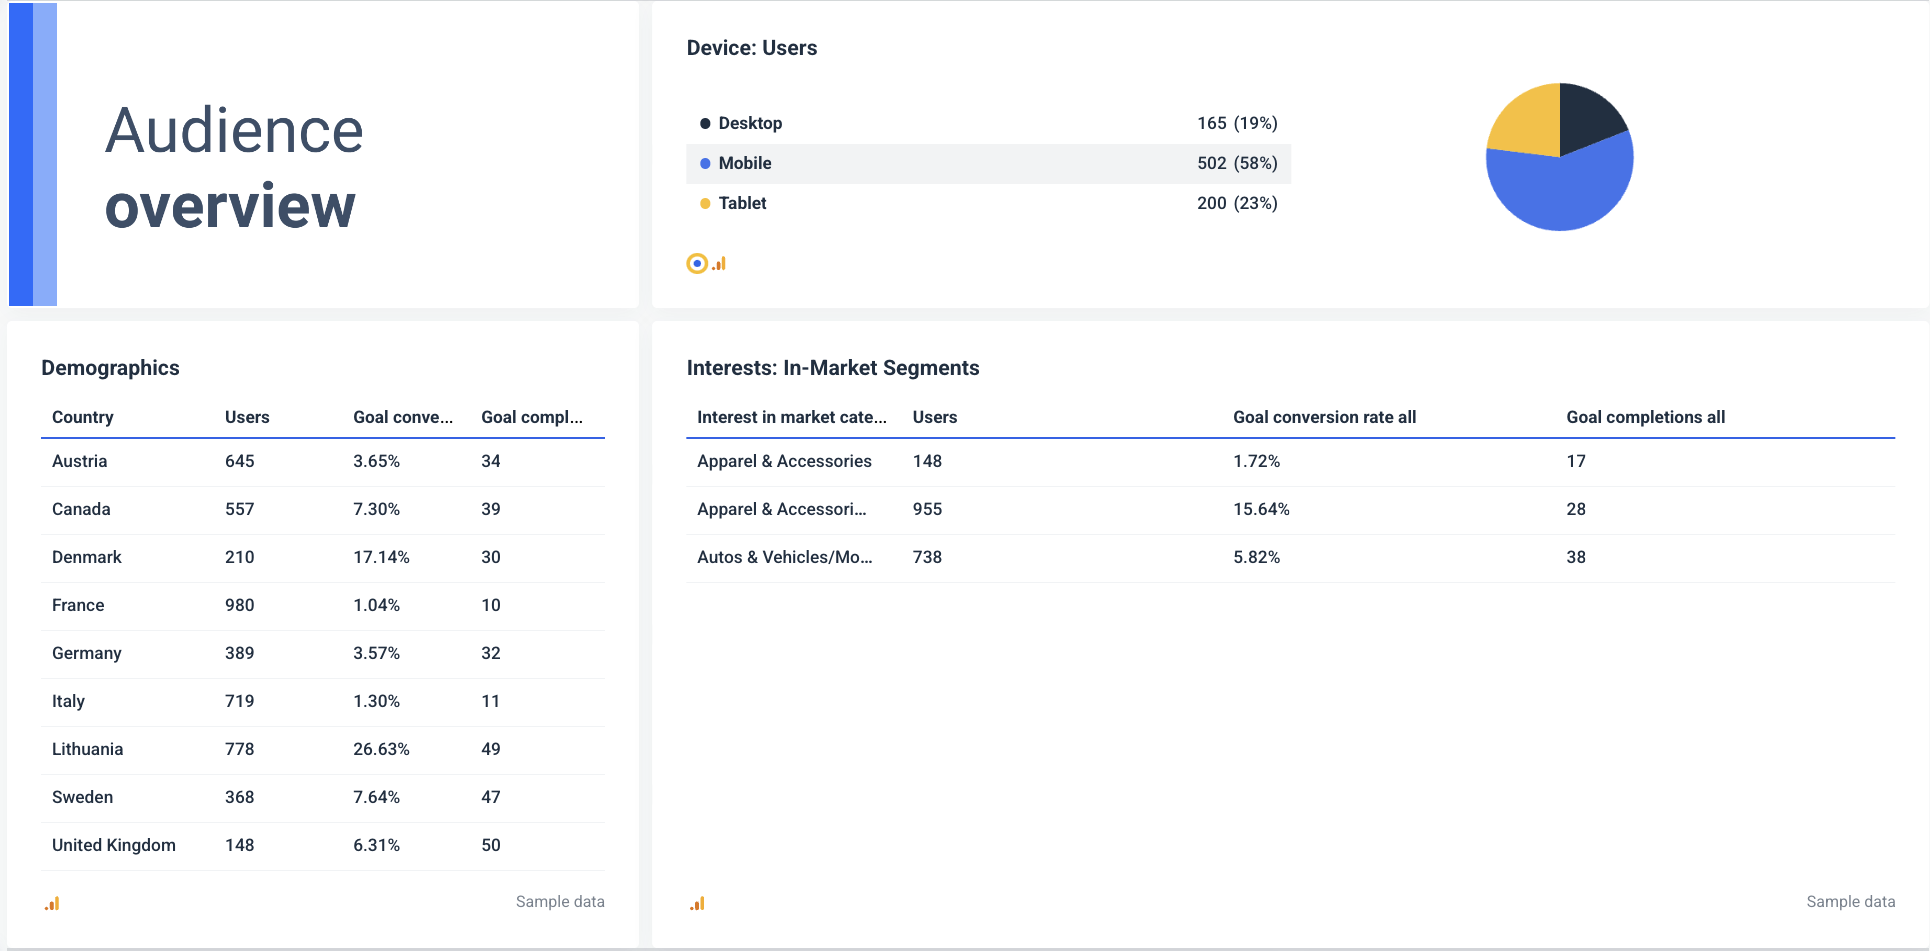
Key metrics to include:
- Users by Country: Helps in targeting specific regions with localized content, ads, or promotions. Conversion rates show you which countries bring high-value users vs. just traffic.
- Device Breakdown: For example, a high mobile user base means you need to optimize your content and UX for mobile. On the other hand, high desktop traffic might mean B2B users are engaging during work hours.
- In-Market Interest Categories: Reveals what topics and industries your audience is interested in. You can use these insights to refine your ad targeting and create content that resonates with their buying intent.
5. PPC Channels Overview
This section is handy for monitoring PPC campaign effectiveness, controlling costs, and optimizing conversions.
Instead of jumping between platforms, this section brings all the key metrics into one place.
Key metrics to include:
- Impressions & Clicks: Impressions tell you how often your ads are seen, while clicks show engagement.
- Conversions & Cost per Conversion: Conversions measure how many users complete a goal (purchase, sign-up, etc.). Cost per conversion tells you how efficiently your ad spend translates into actual results—again helping you optimize ROI.
- Total Ad Spend: Keeps you within budget and ensures your ad dollars are spent wisely. If spend is high but conversions are low, it may be time to refine targeting or ad creatives.
- Ad Performance Over Time: Tracks conversion trends and cost fluctuations throughout the campaign. It helps you spot peak-performing days and adjust bids or budgets accordingly.
Apart from Google Ads, with Whatagraph you can connect and report on any paid media channel—Facebook Ads, LinkedIn Ads, TikTok Ads, Reddit Ads, or any other platform in your PPC mix.
This way, you get a true cross-channel view of your advertising efforts and can compare which platforms bring the best ROI.
6. Organic Overview
The Organic Traffic Overview shows you how well your website is performing in search engine rankings and whether your SEO efforts are driving the right audience.
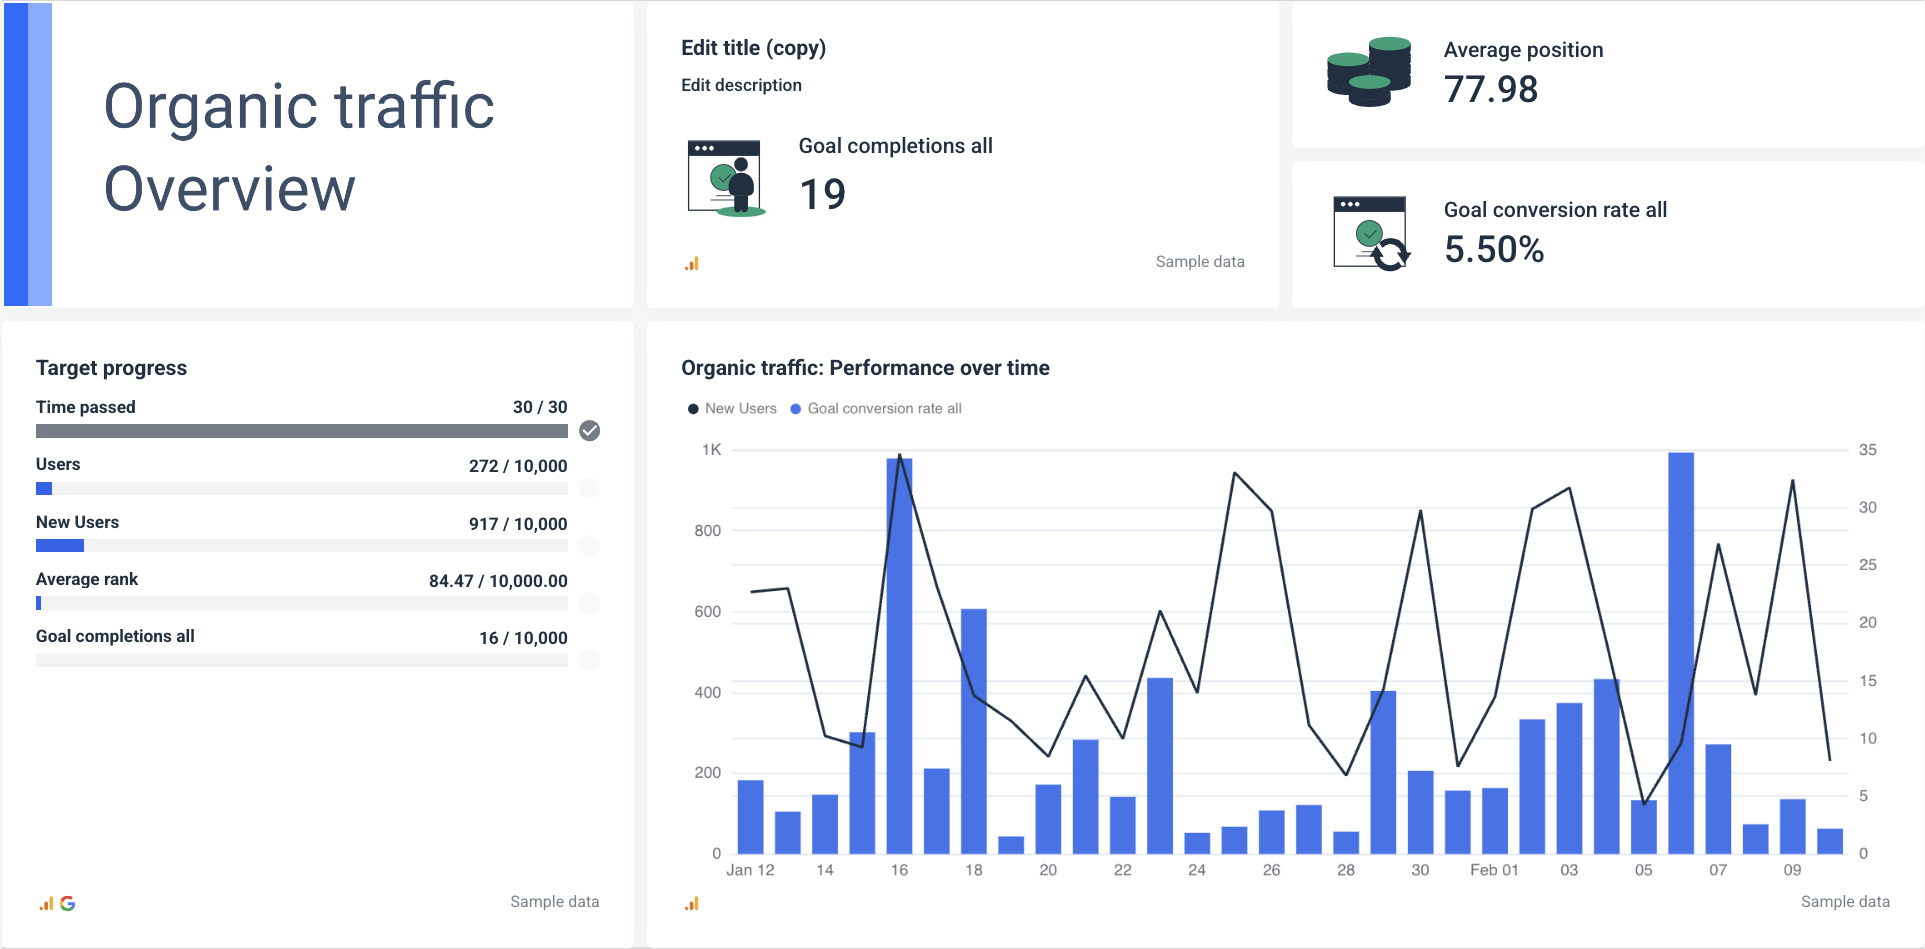
Key metrics to include:
- Average Position (Ranking): This shows how well your pages rank on search engines. A lower number means better visibility, which means more clicks and traffic.
- Performance Over Time: This line+bar chart tracks fluctuations in organic traffic, which helps you to spot trends and seasonality. It comes in handy for assessing the impact of SEO updates, content changes, or Google algorithm shifts.
Cross-Channel Report Examples
Let’s now take a look at 3 examples of effective cross-channel marketing reports created on Whatagraph:
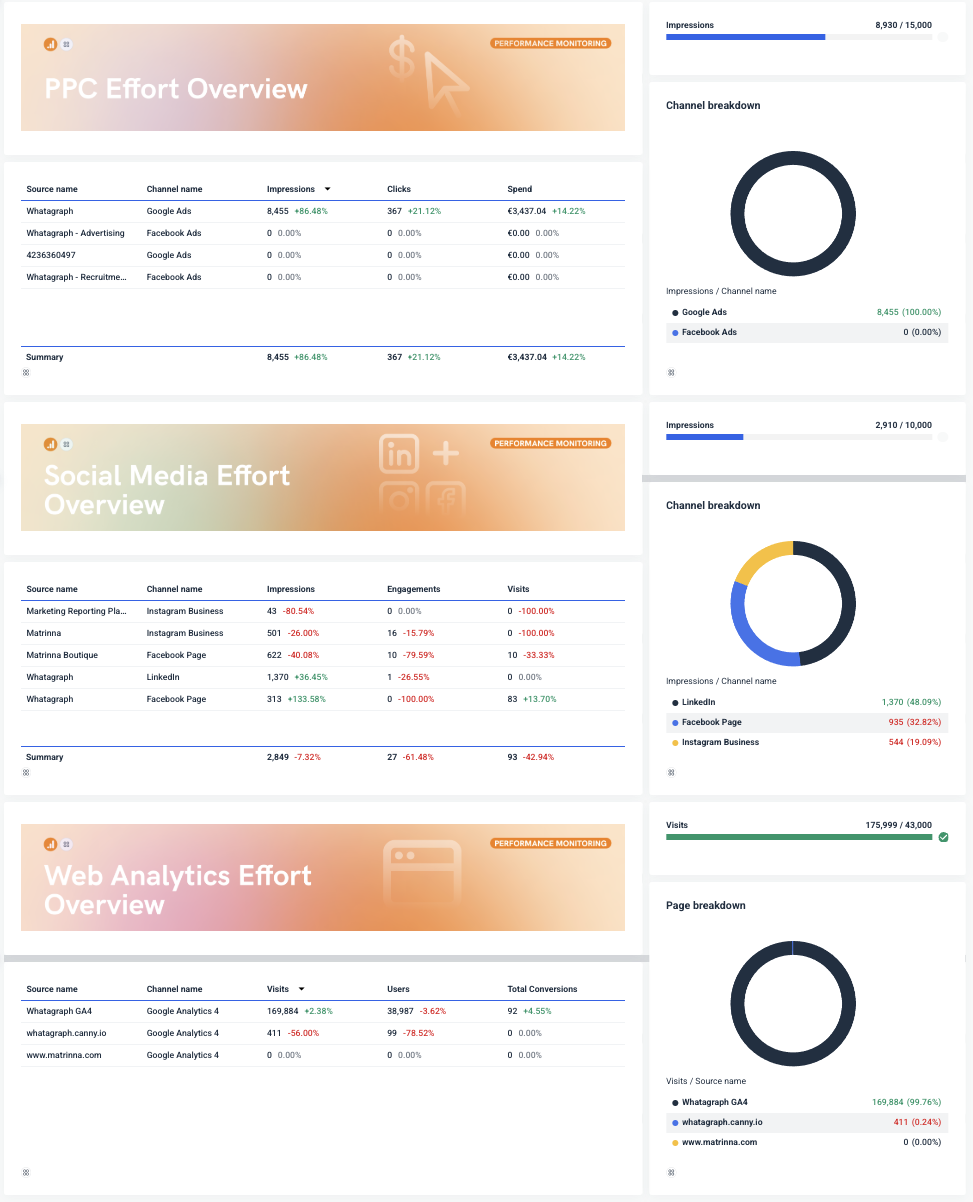
Example 1
This dashboard helps you quickly grasp the performance of your PPC channels, social media, and website.
You can easily add more sections to cover additional channels like e-commerce or email marketing.
The PPC channel breakdown chart clearly shows that something is wrong with this client’s Facebook Ads campaign.
Example 2
It’s a good practice to give your report a human touch by adding a cover image which celebrates teamwork and joint effort.
The executive summary section is right at the top, together with recommendations. Busy clients may just read these takeaways and consider themselves informed.
The most important KPIs for this client are clearly shown in the next section with an interesting combination of 3 widget types:
- Single value widget — for highlighting the KPI
- Goal widget — to show the completion of the KPI goal
- Line chart — to show the fluctuation of KPI for the reporting period
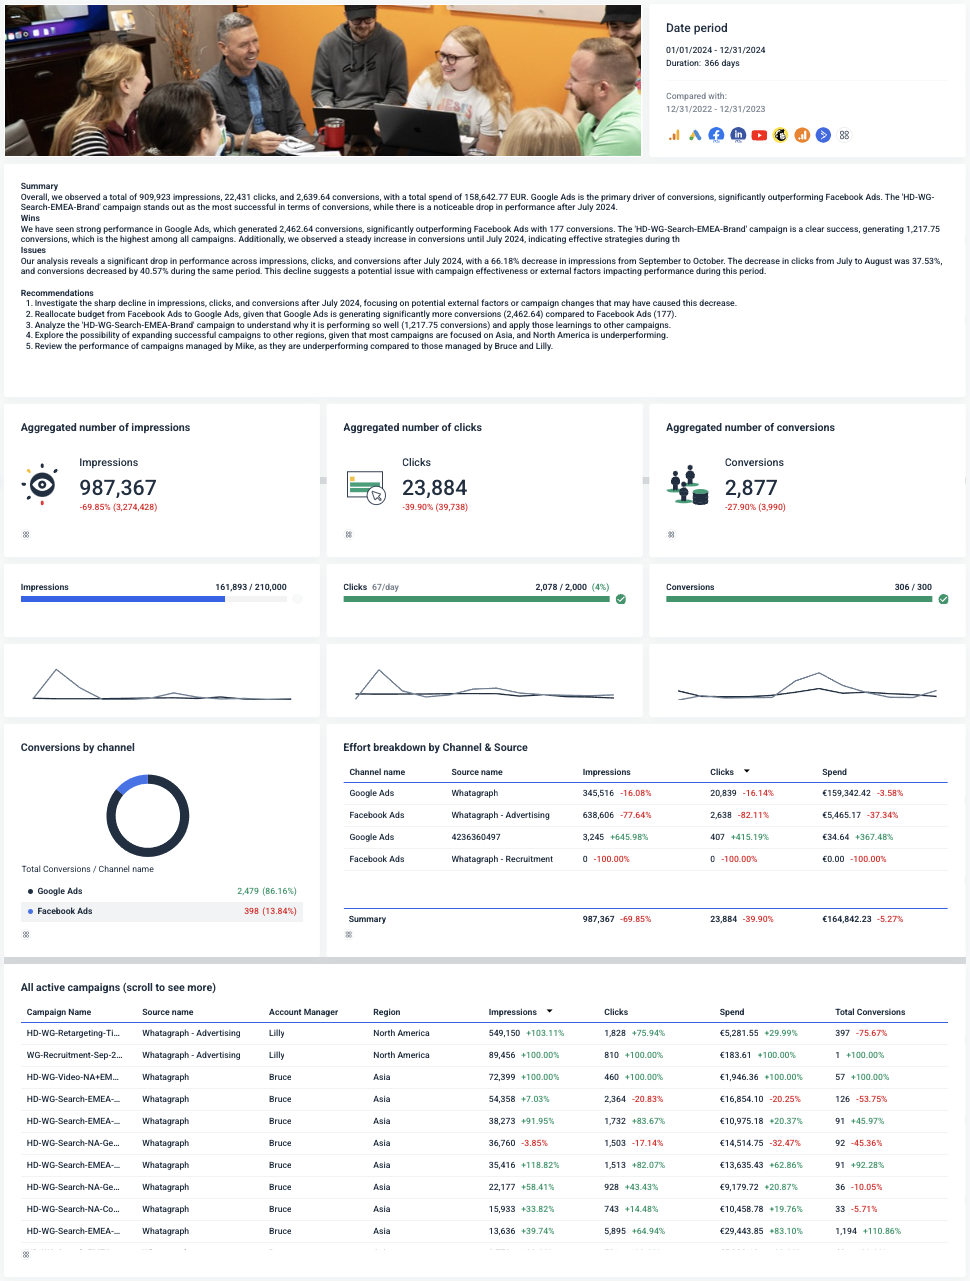
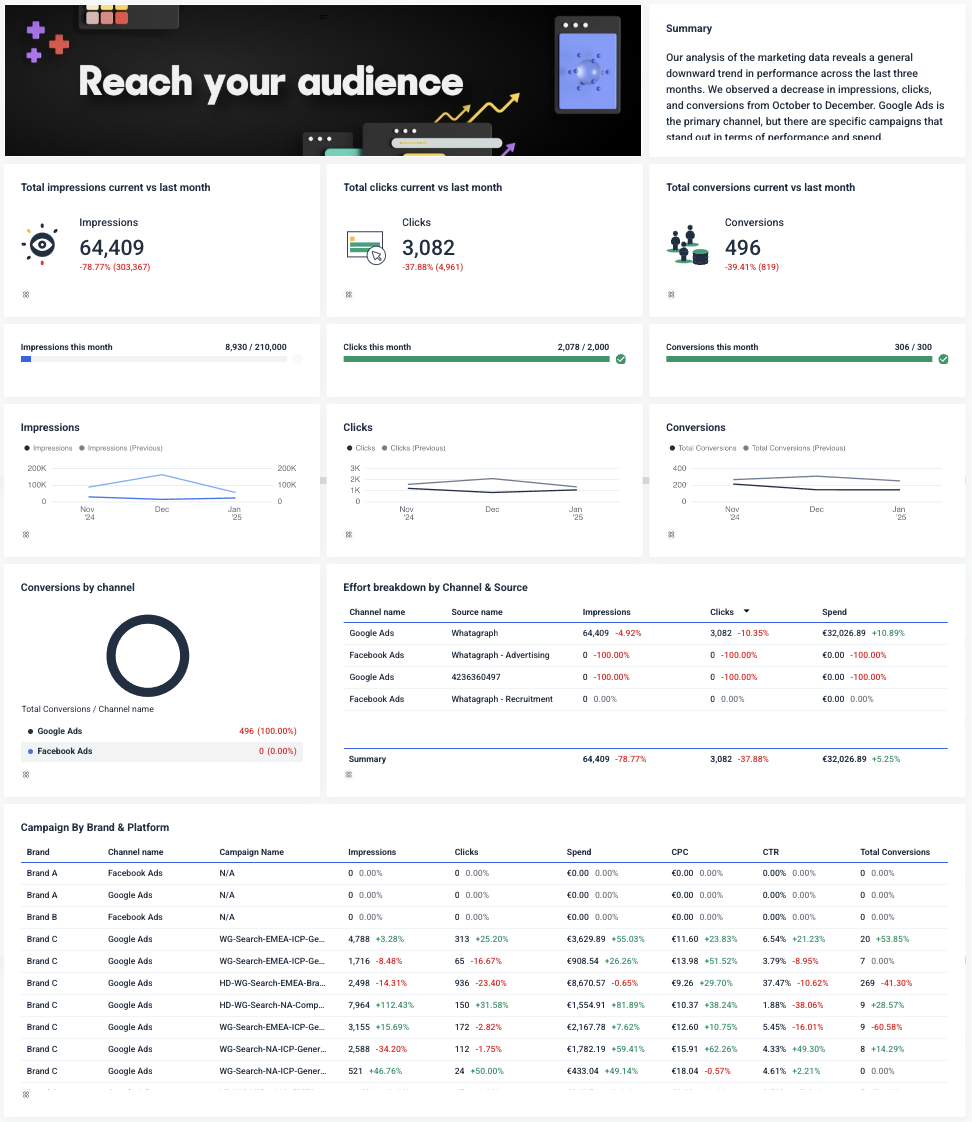
Example 3
This report uses blended sources to show the total marketing performance across all channels.
This client’s most important KPIs are clearly Impressions, Clicks, and Conversions.
After the high-level metrics, this client has requested a more detailed breakdown by channel and source, as well as a campaign overview by brand and platform.
FAQs
What is cross-channel marketing data analysis?
Cross-channel marketing data analysis is a form of marketing analytics where you collect and analyse data from every channel and campaign you use. The result is a complete view of your customer's journey and the role of each channel in converting customers.
What’s the difference between cross-channel marketing analytics and multi-channel analytics?
The main difference between cross-channel marketing analytics and multi-channel analytics is that multi-channel analytics measures the performance of several channels, not necessarily all of them, nor how they work together.
Cross-channel analytics, on the other hand, measures the performance of all your marketing channels and how they work together to drive conversions.
What is omnichannel marketing?
In omnichannel marketing, the channels are all related, but the platforms are also interconnected to create an interactive customer experience.
This strategy maximizes engagement and removes the boundary between offline and online marketing.
Published on Feb 12 2025
WRITTEN BY
Nikola GemesNikola is a content marketer at Whatagraph with extensive writing experience in SaaS and tech niches. With a background in content management apps and composable architectures, it's his job to educate readers about the latest developments in the world of marketing data, data warehousing, headless architectures, and federated content platforms.